 Close
Close

London History Maps
By Harriet S, on 14 May 2020
The retrospective cataloguing team recently embarked on a project creating records for London History Maps, ca. 300 Special Collections maps, atlases and panoramas of London and the surrounding area.
The size of some of the maps was a little problematic (see images!), and finding appropriate locations to safely examine them was difficult in the busy Science Library. With a little planning, however, we were able to schedule map cataloguing time for when the office is at its emptiest, and at times (carefully) use floor space as well as any available desk space.

Finding London University in Cruchley’s New Plan of London, [1829?]
Thankfully, there are a number of helpful internet tools out there (such as this one to discern scale), and we discovered the “Bounding Box,” a website by Klokan Technologies, a Swiss company specialising in online map publishing. The bounding box tool gives approximate coordinates when adjusted to contain the area of the individual map. This is particularly helpful when many of the older London History maps do not operate on coordinates at all, but rather have numbered or lettered grids for reference to that map alone. Those that do, often have St. Paul’s, the centre of historic London as the meridian, not Greenwich. In fact, it was not until the 1880s that maps had any consensus as to what meridian to refer to, and many chose the centre of their respective cities/countries rather than settling on an international standard.
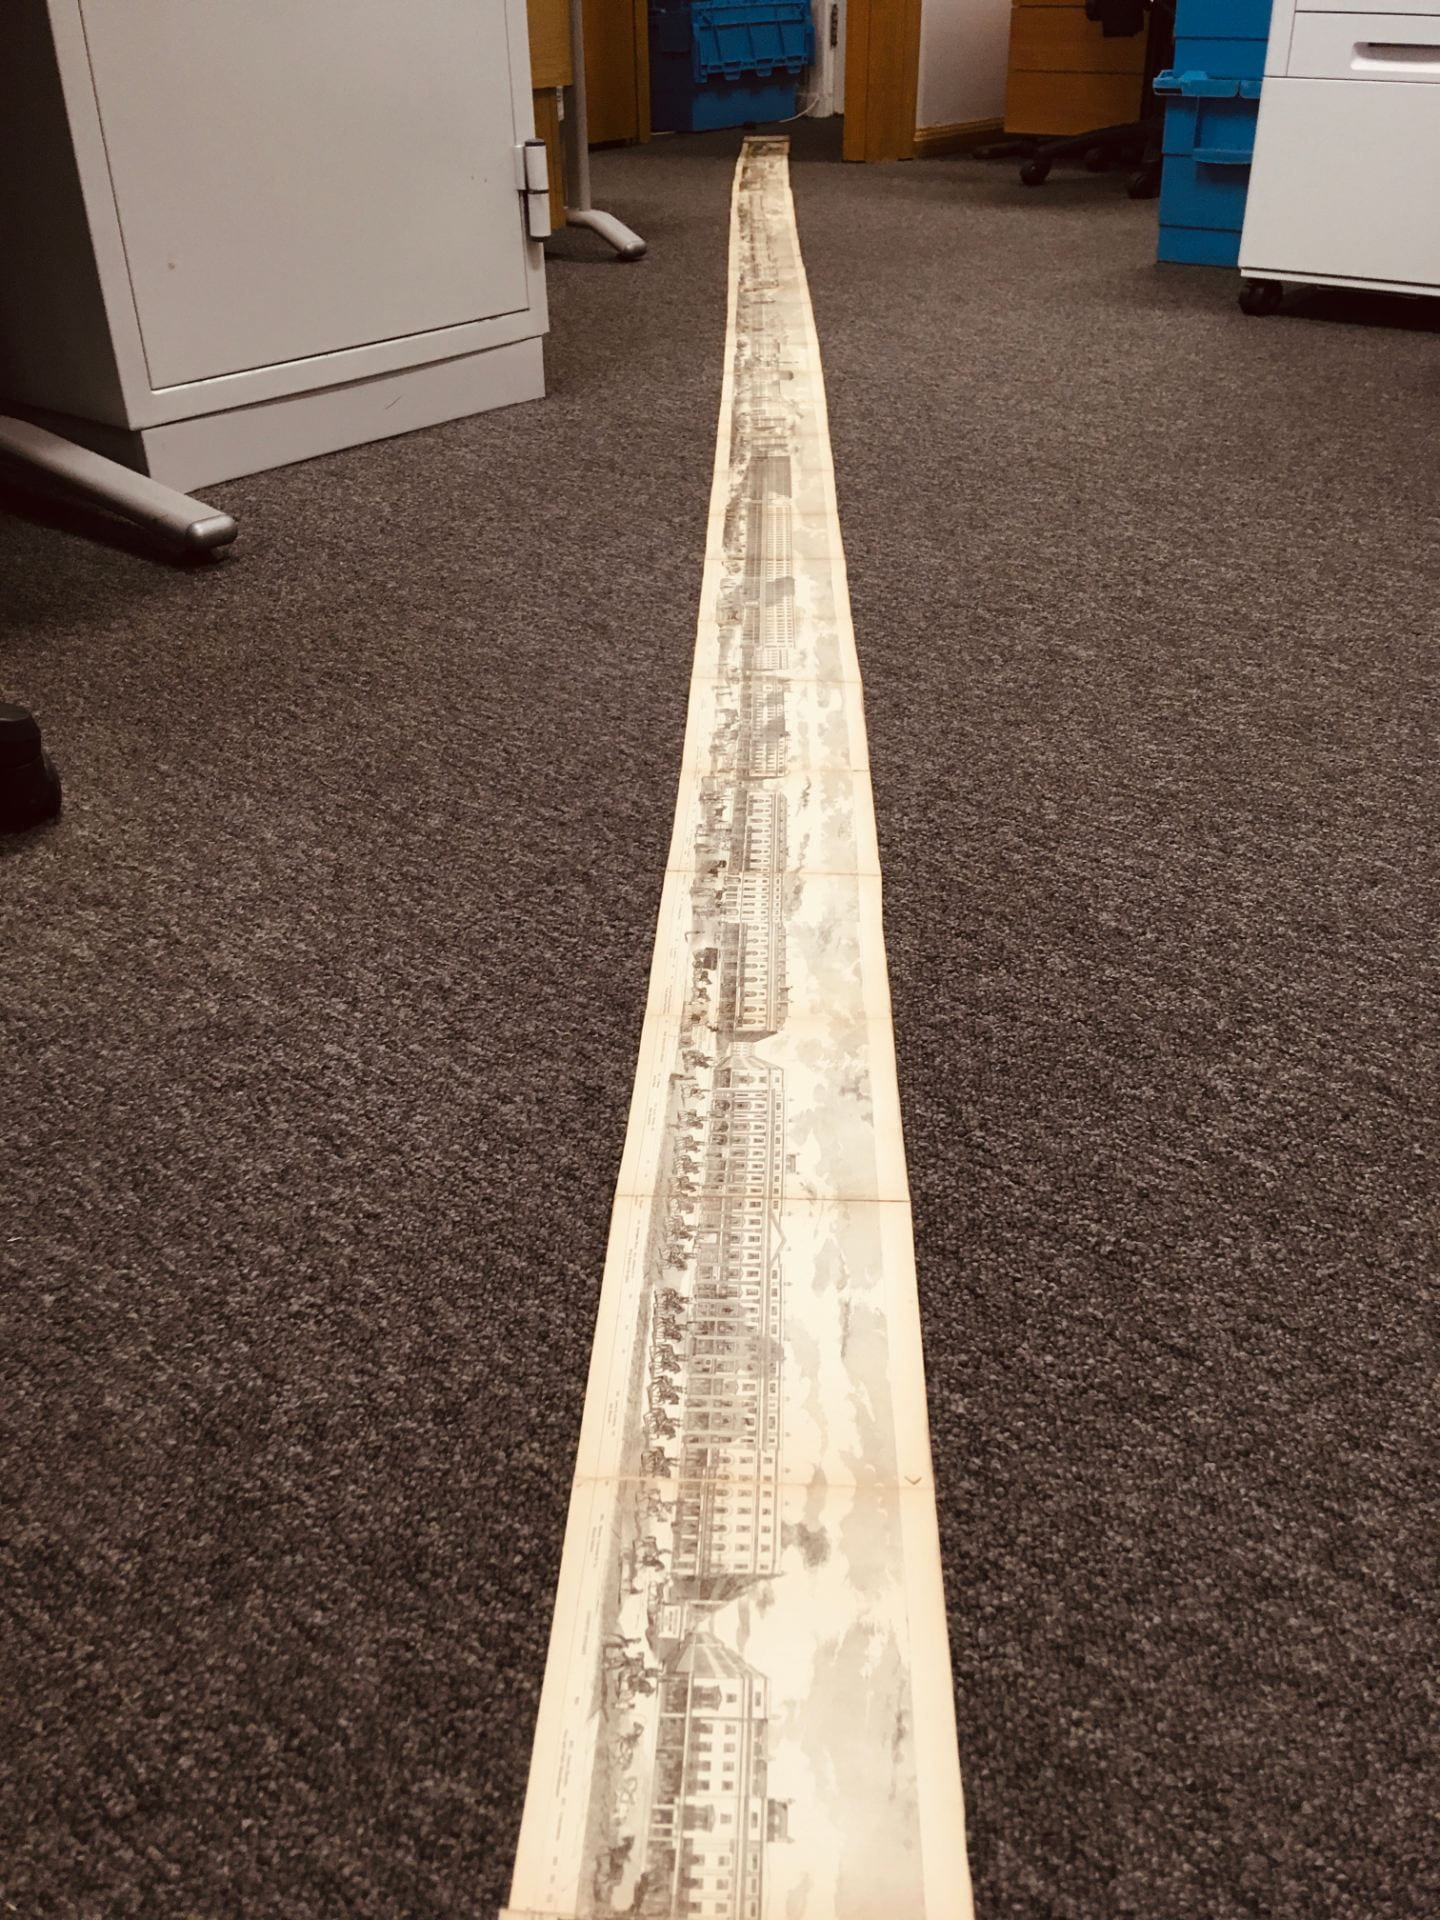
I think we’re going to need a bigger floor!
Finding their objective coordinates would have been a very arduous task if we had needed to relate to other maps, so the Bounding Box has been an invaluable resource to help us provide as much detail as possible. The site even helpfully provides coordinates formatted specifically for MARC cartographic fields 034 and 255. Alongside these websites, we also shared expertise and created standard phrases for common occurrences, such as the way the maps have been cut and mounted, and cartographic detail extending beyond the neat line (border) of the map.
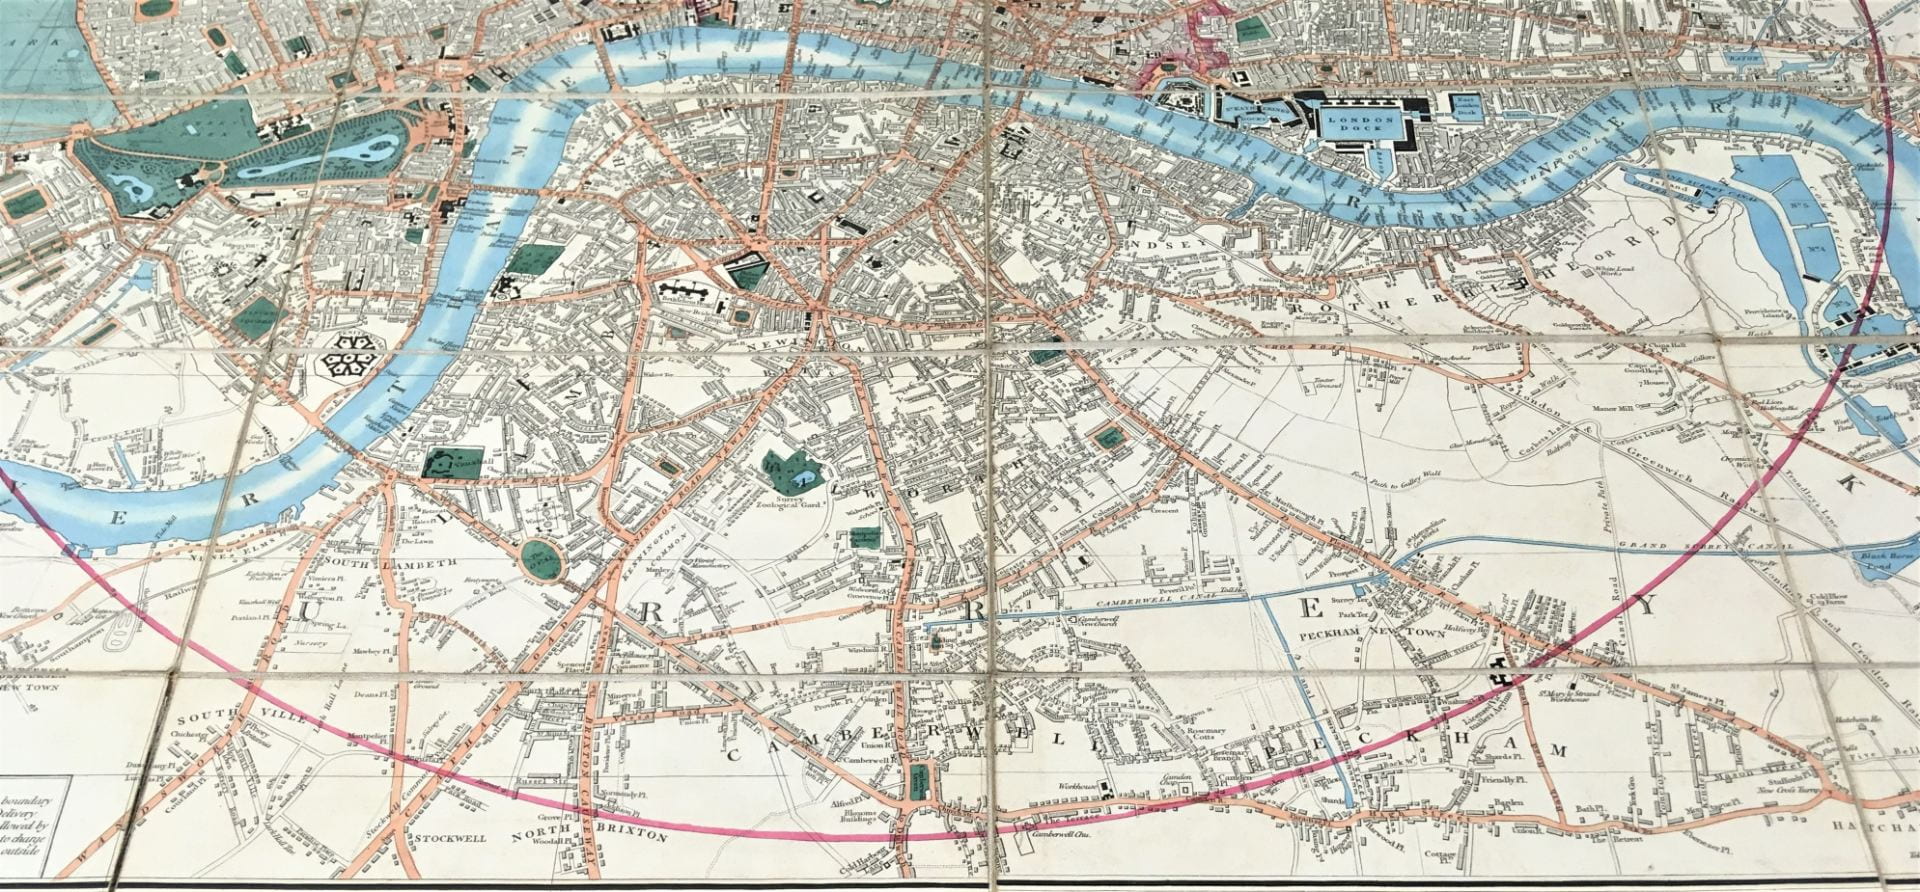
A sparsely populated Camberwell and Peckham in Cary’s New Plan of London, 1839
With the nitty gritty out of the way, we had space to focus on the content of the maps. Many are beautifully engraved and hand-coloured, with parks showing detail up to the individual tree or flowerbed and the individual docks labelled along the Thames. Some maps emphasise railways, hackney carriage routes or walking distances, some even show the network of sewers! What is most striking is how different London was, and how quickly its expansion occurred. Up to the late 19th century, the land North of Regent’s Park dissolves into fields and farms, and South of the River is even less urbanised. Some maps even split boroughs into landowners’ estates. On a personal level, seeing UCL campus slowly emerge on the maps was particularly interesting.
The retrospective team began cataloguing London History Maps in February 2020, and almost half the collection is now online. Further map-related posts to follow when we regain access to our physical collections.
