 Close
Close

UCL open access output: 2023 state-of-play
By Kirsty, on 15 April 2024
Post by Andrew Gray (Bibliometrics Support Officer) and Dominic Allington Smith (Open Access Publications Manager)
Summary
UCL is a longstanding and steadfast supporter of open access publishing, organising funding and payment for gold open access, maintaining the UCL Discovery repository for green open access, and monitoring compliance with REF and research funder open access requirements. Research data can be made open access in the Research Data Repository, and UCL Press also publish open access books and journals.
The UCL Bibliometrics Team have recently conducted research to analyse UCL’s overall open access output, covering both total number of papers in different OA categories, and citation impact. This blog post presents the key findings:
- UCL’s overall open access output has risen sharply since 2011, flattened around 80% in the last few years, and is showing signs of slowly growing again – perhaps connected with the growth of transformative agreements.
- The relative citation impact of UCL papers has had a corresponding increase, though with some year-to-year variation.
- UCL’s open access papers are cited around twice as much, on average, as non-open-access papers.
- UCL is consistently the second-largest producer of open access papers in the world, behind Harvard University.
- UCL has the highest level of open access papers among a reference group of approximately 80 large universities, at around 83% over the last five years.
Overview and definitions
Publications data is taken from the InCites database. As such, the data is primarily drawn from InCites papers attributed to UCL, filtered down to only articles, reviews, conference proceedings, and letters. It is based on published affiliations to avoid retroactive overcounting in past years: existing papers authored by new starters at UCL are excluded.
The definition of “open access” provided by InCites is all open access material – gold, green, and “bronze”, a catch-all category for material that is free-to-read but does not meet the formal definition of green or gold. This will thus tend to be a few percentage points higher than the numbers used for, for example, UCL’s REF open access compliance statistics.
Data is shown up to 2021; this avoids any complications with green open access papers which are still under an embargo period – a common restriction imposed by publishers when pursuing this route – in the most recent year.
1. UCL’s change in percentage of open access publications over time
(InCites all-OA count)
The first metric is the share of total papers recorded as open access. This has grown steadily over time over the last decade, from under 50% in 2011 to almost 90% in 2021, with only a slight plateau around 2017-19 interrupting progress.
2. Citation impact of UCL papers over time
(InCites all-OA count, Category Normalised Citation Impact)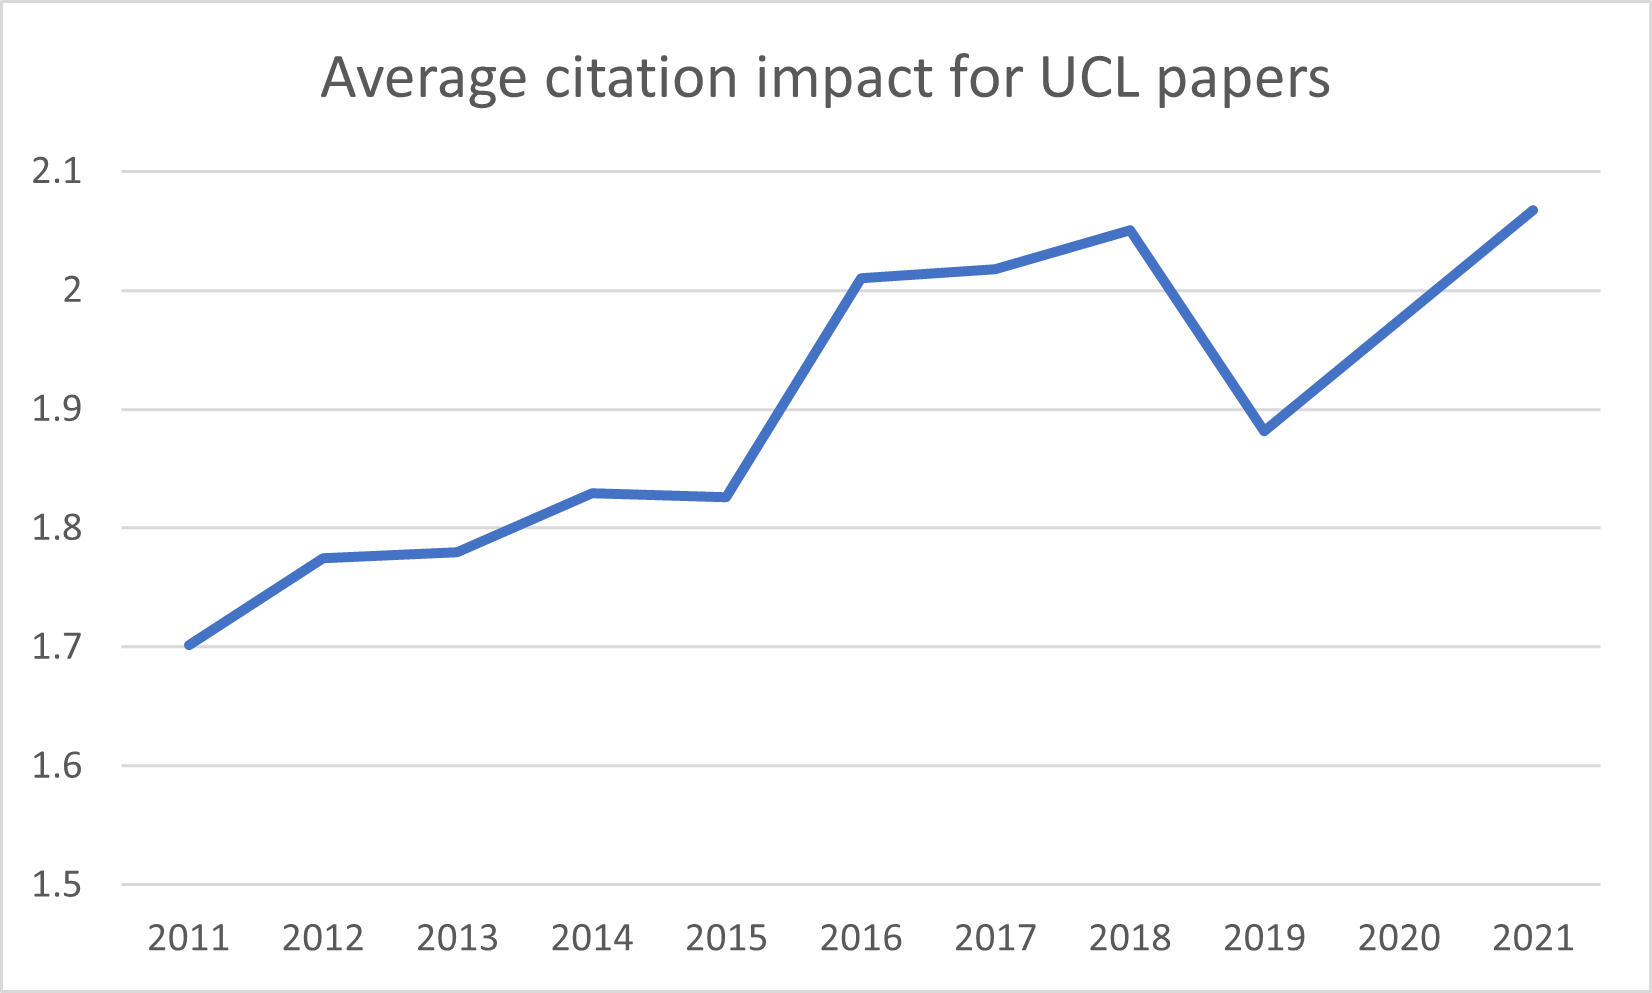
The second metric is the citation impact for UCL papers. These are significantly higher than average: the most recent figure is above 2 (which means that UCL papers receive over twice as many citations as the world average; the UK university average is ~1.45) and continue a general trend of growing over time, with some occasional variation. Higher variation in recent years is to some degree expected, as it takes time for citations to accrue and stabilise.
3. Relative citation impact of UCL’s closed and Open Access papers over time
(InCites all-OA count, Category Normalised Citation Impact)
The third metric is the relative citation rates compared between open access and non-open access (“closed”) papers. Open access papers have a higher overall citation rate than closed papers: the average open access paper from 2017-21 has received around twice as many citations as the average closed paper.
4. World leading universities by number of Open Access publications
(InCites all-OA metric)
Compared to other universities, UCL produces the second-highest absolute number of open access papers in the world, climbing above 15,000 in 2021, and has consistently been the second largest publisher of open access papers since circa 2015.
The only university to publish more OA papers is Harvard. Harvard typically publishes about twice as many papers as UCL annually, but for OA papers this gap is reduced to about 1.5 times more papers than UCL.
5. World leading universities by percentage of Open Access publications
(5-year rolling average; minimum 8000 publications in 2021; InCites %all-OA metric)
UCL’s percentage of open access papers is consistently among the world’s highest. The most recent data from InCites shows UCL as having the world’s highest level of OA papers (82.9%) among institutions with more than 8,000 papers published in 2021, having steadily risen through the global ranks in previous years.
Conclusion
The key findings of this research are very good news for UCL, indicating a strong commitment by authors and by the university to making work available openly. Furthermore, whilst high levels of open access necessarily lead to benefits relating to REF and funder compliance, the analysis also indicates that making research outputs open access leads, on average, to a greater number citations, providing further justification for this support, as being crucial to communicating and sharing research outcomes as part of the UCL 2034 strategy.
Get involved!
![]() The UCL Office for Open Science and Scholarship invites you to contribute to the open science and scholarship movement. Stay connected for updates, events, and opportunities. Follow us on X, formerly Twitter, LinkedIn, and join our mailing list to be part of the conversation!
The UCL Office for Open Science and Scholarship invites you to contribute to the open science and scholarship movement. Stay connected for updates, events, and opportunities. Follow us on X, formerly Twitter, LinkedIn, and join our mailing list to be part of the conversation!
