Data Sharing Highlights
By Kirsty, on 17 February 2022
At UCL there is a recognition that there is more to publishing research than simply books and papers in print and PDF format.
One of the ways this is supported is through the UCL Research Data Repository. Our institutional publishing platform can be accessed here: https://rdr.ucl.ac.uk/
The RDR can be used to publish all kinds of data, in a raw or visual format. All items are given a DOI and can be referenced to the same standard as a journal article or book. Many published items are supporting data for other publications, but a large number are also standalone items.
Visual Archaeological Data
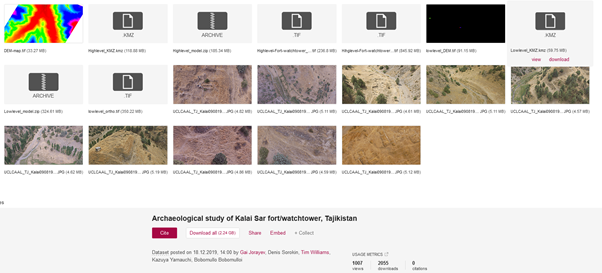
A great example of using the RDR to present and share visual information is this archaeological data record: https://doi.org/10.5522/04/11385852.v1
This record is part of a project to document and catalogue archaeological sites across Central Asia. The record includes photographs of the site, height map data, 3D models along with some descriptive information about the site itself and co-ordinates which specify the location. The 3D models are also hosted live on the Sketchfab website, but including them in this data record provides an extra level of preservation. While the Sketchfab website might become defunct, this data record becomes part of the UCL permanent collection and will retained. The files could be used to reconstruct the 3D models if needed.
Sharing Research Methods
Sharing data is important, but sharing research methodology can be a really powerful way to improve reproducibility and transparency. The UCL RDR can also be used to share methods and designs used in research. It’s worth highlighting that although the RDR has “data” in the name it is very flexible in terms of what can be shared. Questionnaires, study designs, posters and presentations are all accepted.
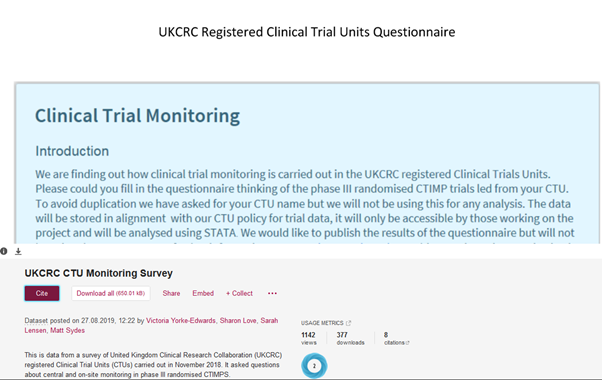
As an example of sharing research methods this Survey of Clinical Trial units published with the repository contains not only an anonymised set of survey responses but also the exact survey document used. This means there is a clear record of the exact questions used to generate the data that could be easily used to recreate a similar survey at later date, for example, to see how trends have shifted over time.

Access this record here: https://doi.org/10.5522/04/7992998.v1
Beyond the RDR: Publishing data from the Natsal Surveys
The UCL RDR is just one platform for sharing data, and is not always the most appropriate for a particular project. A great example of presenting data in a way that makes it available to explore for a general audience is an online interactive that’s been developed using data from the last Natsal survey.
The British National Surveys of Sexual Attitudes and Lifestyles (or ‘Natsal’ for short) are a project led by UCL. So far three versions of the survey have been completed approximately every decade, the first in 1990, and since then over 45000 people have been interviewed, each one randomly-selected from across the country so that the data can be considered as broadly representative of the British population. First carried out in response to the HIV and AIDS epidemic, the Natsal surveys have become the leading source of reliable information about sex in Britain. Each of the surveys provides a snapshot of the nation’s sexual behaviour, experiences, and attitudes, and together they paint a comprehensive picture of how the nation’s sex lives change over time. Interviews for the next and fourth Natsal are due to start this summer.
The Natsal research team have been sharing their data through the UK Data Service for many years, providing a useful resource for other researchers. Data released from the last survey goes one step further to make sure the data are accessible beyond professional researchers and statisticians. Anyone will be able to explore the latest Natsal data using a freely, visually engaging interactive explorer, developed as a collaboration between UCL and the Open University, which also includes a taster animation and interactive activity ‘No sex please, we’re British!’ which allows anyone to see how their own views correspond to the survey’s findings for the population as a whole.
 Close
Close


