X Close

Digital Education team blog

Home

Ideas and reflections from UCL's Digital Education team

Menu

TechQual+ Survey at UCL

By Moira Wright, on 13 October 2017

In early 2016, ISD (Information Services Division) carried out the first Staff and Student IT Survey using TechQual+. Over 1,000 of you completed the survey, and over the past 16 months we have been working hard to improve our services in response to your comments.

Below are just a few examples of changes that have been made as a result of the feedback received from the TechQual+ survey run in 2016:

Wi-Fi                        Three speech bubbles

A substantial investment in replacing and upgrading our Wi-Fi technology infrastructure

Service Desk

We’ve invested in staffing, tools and training to speed up response times and improve quality.

We’ve partnered with an external organisation and altered shift patterns to provide additional out of hours’ support.

Printing                 

We’ve rolled out 170+ additional printers over the past 18 months, targeting the busiest areas. This takes the current total to 660 printers. In areas of high usage, we’ve introduced new high capacity printers.

Infrastructure

We have invested in storage and now all staff and students can store 100GB for free.

Computers

We are continuing to invest in additional cluster PCs, and loan laptops where there isn’t space for desktops. We added a further 550 desktops and 60 laptops by September 2017.
We operate one of the largest laptop loan services across UK universities – 266 laptops across 12 locations – and this year a further 60 laptops were added.

Training

We delivered 221 courses last academic year, that’s nearly 1000 hours of training with about 3000 people attending.  We are working hard to publicise the courses we offer.

Audio Visual

In 2016 ISD invested £2.5m into improving the technology in teaching facilities. Approximately 70 centrally bookable spaces had their facilities updated; this included bringing 43 spaces in 20 Bedford Way up to the standard spec including installation of Lecturecast in approx. 30 spaces.  Lecturecast was also installed at 22 Gordon Street and Canary Wharf (3 spaces each).  We also refreshed the Lecturecast hardware in 12 rooms.


Drawing of a tablet with 5 stars

Based on the findings of focus groups at participating institutions, the TechQual+ project has articulated a set of generalised IT service outcomes that are expected of IT organizations by faculty, students, and staff within higher education. The TechQual+ core survey contains 13 items designed to measure the performance of the following three core commitments: 1) Connectivity and Access, 2)Technology and Collaboration Services, and 3) Support and Training.

The TechQual+ survey will be run again at UCL in December 2017 and we’ll be asking for your help to advertise it to your students, encouraging them (and you!) to complete it. All respondents will be entered into a prize draw with a chance to win some great prizes!

We’ll be providing more information and communications about the survey closer to the opening date.


What is the cost of developing e-learning? Try our calculator

By Matt Jenner, on 22 July 2015

Q: What is the cost of developing e-learning?

A: It depends

Arghthis answer is not good enough. 

E-Learning is a big industry, so why does the cost of making ‘some’ feel so mysterious? Increasingly the question of ‘how much will this cost?’ is cropping up. This is a perfectly valid question and one that really demands a better answer than the one above. For too long the response of ‘it depends’ comes up, or something about a piece of string. This isn’t cutting it so after some research (there isn’t much out there) we created an E-Learning Costing Calculator so you can start putting in some numbers and start to see some cold, hard, financials. Hurray?

Go – play with what we’ve created

Access E-Learning Costing Calculator on Google Sheets 

Warning: multiple users will obviously see one another’s calculations but I couldn’t find a better way of doing this while also retaining Alpha status for testing. Ideas welcome in the comments below…

Images / captures (of the above sheet)

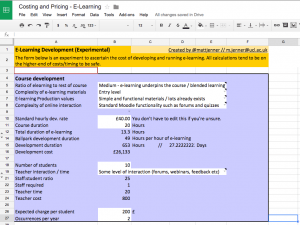
Main tool, questions and numbers input:

E-Learning Costing Calculator

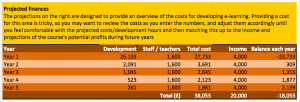
Cost and recovery

E-Learning Costing Calculator - financials

Charts for the boss

Charts for the boss


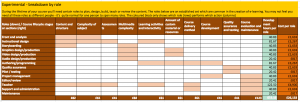
Breakdown by role

Breakdown by role

Approximations!

If you spend any time in the sheet you’ll notice there are some approximations going on in there (quite a few). It doesn’t produce an exact answer (because it really does depend). I think we’ve been asking the wrong question. We still need to ask – what data do we have to suggest how much e-learning might cost? How can we generalise and remain detailed enough to find ballparks? How close can we get to accuracy? and finally, What are we missing to increase accuracy?

Disclaimer: so far all the work on this comes from smaller, shorter courses (CPD, continuing education). Moocs and fully accredited courses are slightly different. The biggest problem is to add in some economy of scale (more on this in Maths).

Seeking improvement

Firstly – I want people to roadtest this spreadsheet. So please contact me and we can collaborate in Google Sheets (for now). I’m confident we could get a little closer to understanding why and it involves maths, early solutions and more questions.

Maths

Bryan Chapman, Chief Learning Strategist for Chapman Alliance asked in 2010 how long does it take to create e-learning:

[slideshare id=5198860&doc=howlong-100914094357-phpapp02]

Bryan surveyed 4000 learning development professionals and obtained data (US-based) on CPD and short courses. He created a series of development hour timeframes based on teaching approaches of f2f and three-level e-learning (basic, intermediate and advanced). For each approach he discovered the number of development hours required to create one hour of ‘e-learning’ (vague as it depends on your teaching approach). These numbers were the primary driver to start calculating an idea of costing, and the questions to ask.

This is the only data found. There’s corporations offering consultancy, and sure they have their ROI models (of course, it’s business). There’s bloggers and co. with their ideas and comments – but nothing with much evidence, especially when compared to Bryan’s work.

Economy of scale / new vs old

One problem with all this is that all costs tend to follow the rules of economies of scale. Producing one of anything tends to be proportionally more expensive than 10, then 100, and so on. Logically one hour of e-learning would cost a fair whack – say £15k. But the second should be cheaper, say £10k. Then from here you should see some sliding scales of efficiency. This isn’t so easy to build, so I omitted it in the sheet (for now). Idea welcome on this part.

New content is probably not the same cost as reusing old. Converting old content vs producing new content both come with different costs. To try and not complicate things it’s best to avoid this question for now, but see a sliding scale could help here – but I don’t know how to calculate the cost of conversion and comparing it to the cost of creation – so it’s lumped in together (for now).

Solutions

Running a few generalisations – the data from the Chapman Alliance can be used to start calculating the cost of courses. By taking some known courses, and their approximate costs, we simulated with some UCL courses how much they cost. During a project (UCLeXtend) we had provided some seeding resource to prime the new platform and provide examples to the wider community of what’s possible. Due to the transparency of these courses we could also see how much they all cost, and whether any calculations made were accurate. Sometimes the numbers hurt (never making a profit in this corner…) they also looked kinda accurate.

This motivated the creation of an E-Learning Costing Calculator – which we’re now crowdsourcing people’s opinions on to improve.

Questions

Armed with one data source (dangerous, I know) I looked to break it back down and discover if it could be reverse-engineered to build a calculator for everyday use. The idea was to ask broad questions within the calculation to then align with the data from the Chapman Alliance’s research. I think there are more questions to ask, but how to also generalise for calculating answers?

See also

UCL recently become friends with the IOE. A tool they have is the Course Resource Appraisal Modeller  -it’s much more detailed than this and I think it goes a long way to answering some of the questions I have posed. It also takes a fair amount of time and information to complete it. I can see the validity of both, or (better) one feeding into the other / merging. What do you think? Have you used CRAM? 

An Example Module in the IOE CRAM tool

http://web.lkldev.ioe.ac.uk/bernard/cram/launch.html


What’s next?

Please comment on this, in the sheet or in this post (or Twitter). I feel a bit stuck on this now, so feedback is essential to move forward.


Augmenting our realities and working together

By Rod Digges, on 24 February 2015

Last year I had the opportunity to contribute to BASC2001 an interdisciplinary course looking at the world of objects, the stories they hold and how they are researched and represented.
Updating the materials for my contribution this year, part of which involves the different ways objects can be represented digitally, I came across a number of online tools that I thought it would be worth writting about, they demonstrate how much easier it’s becoming for those with no great technical expertise to create 3D models, Augmented Reality scenarios and also to collaborate in website design.

 The model above, a small maquette, made by a student at the Slade in the 1950’s was captured by simply taking a series of 25 photos and uploading these to http://apps.123dapp.com/catch/ a free cloud service that converts pictures into 3D models. The service provides an embed code that allows models to be placed in a web page but doesn’t allow annotation, https://sketchfab.com/ does, so the model files were re-uploaded there to provide the model shown above.

The creation of models like this is now a fairly simple task and once created newer online tools provide even more opportunities for the ways in which they can be represented; http://www.metaio.com/ has a downloadable Augmented Reality (AR) application (free for basic use) that allows models to be animated and viewed using ‘real world’ triggers like QR codes, images, or even locations.
By downloading an AR browser (from http://www.junaio.com/) to an Android or Apple mobile device these augmented realities can be viewed. If you’re interested in seeing for yourself, load the junaio browser onto your smartphone or tablet, scan the QR code below and then point it at the picture of the model below.

junaio_channel_378275_qrCode     Boy's head


As well as looking at ways of representing objects, students of BASC2001 have, in groups, to create a virtual exhibition of their allocated objects. While researching services that might help students with this task I came across https://cacoo.com – an online tool that allows users to simultaneously edit things like wireframe outlines for web sites – wireframing is a way laying out the essential structure of a website prior to ‘meat being put on the bones’, it’s an important step allowing teams to layout and discuss design decisions prior to committing to the work involved in realising a particular site.
One of the great features of the cacoo service is multiple editors can work simultaneously on the same page and view in realtime all the change that are being suggested. Another feature is that collaborators don’t need high level web design skills in order to contribute – an important consideration for students coming from a range of disciplines and having very different levels of digital literacy.
The ability to edit can be controlled by invitation only but, for the brave, layouts can set to be world editable like this one – https://cacoo.com/diagrams/Ubzjolw5T8HBAtTw


Chronogogy – Time-led learning design examples

By Matt Jenner, on 15 November 2013

I recently blogged about a concept called chronogogy; a time-led principle of learning design the importance of which I’m trying to fathom. My approach is to keep blogging about it & wait until someone picks me up on it. Worst case, I put some ideas out in the public domain with associated keywords etc. Please forgive me.

An example of chronogogically misinformed learning design

A blended learning programme makes good use of f2f seminars. Knowing the seminar takes at least an hour to get really interesting, the teacher prefers to use online discussion forums to seed the initial discussions and weed out any quick misgivings. Using a set reading list, before the seminar they have the intention of students to read before the session, be provoked to think about the topics raised and address preliminary points in an online discussion. The f2f seminars are on Tuesdays & student have week to go online and contribute. This schedule is repeated a few times during the twelve week module.

The problem is, only a handful of students ever post online and others complain that there’s “not enough time” to do the task each week. The teacher has considered making them fortnightly, but this isn’t really ideal either, as some may slip behind, especially when this exercise is repeated during the module.

The argument in my previous post was that if the planning of the activity doesn’t correlate well with activity of website users then it may increase the chance of disengagement.

Example learner 1


Tues Wed Thurs Fri Sat Sun Mon Tues

Learner1

Task set Reading start Reading finish Contributes to forum Attends seminar


If a reading is set on Tuesday completed by Sunday, the learner may only start considering their discussion points on Sunday or Monday night. This will complete the task before Tuesday’s session, but does it make good use of the task?

Example learner 2


Tues Wed Thurs Fri Sat Sun Mon Tues

Learner1

Task set Reading start Reading finish Contributes to forum Visitsforum Contributes to forum Attends seminar

The reading is set on Tuesday, completed by Friday, the learner even posts to the forum on Saturday. By Sunday the come back to the forum, there’s not much there. They come back on Monday and can contribute towards Learner 1’s points, but it could be too late to really fire up a discussion. The seminar is the next day, Tuesday which could increase the chance of discussion points being saved for that instead, as the online discussion may not be worth adding to.

These are two simplistic example, but they provide further questions:

  • Q: Can these two students ever have a valuable forum discussion?
  • Q: Is this was scaled up would the night before the seminar provide enough time for a useful online discussion?
  • Q: If Learner3 had read the material immediately and posted on the Wednesday what would’ve been the outcome?

Any students posting earlier in the seven-day period may be faced with the silence of others still reading. Postings coming in too late may be marred by the signs that fewer visitors will log on during the weekend. Therefore, unless people are active immediately after the seminar (i.e. read and post in the first day or two) then any online discussions takes place on Monday – the day before the seminar.

In this example a lot of assumptions are made, obviously, but it could happen.

Development/expansion

If this example were true, and it helps if you can believe it is for a moment, then what steps could be taken to encourage the discussion to start earlier?

One thought could be to move the seminar to later in the week, say Thursday or Friday. By observing learners behaviour ‘out of class’ (offline and online) it could give insight into the planning of sessions and activities. In the classic school sense, students are given a piece of homework and they fit it in whenever suits them. However, if that work is collaborative, i.e. working in a group or contributing towards a shared discussions, then the timing of their activity needs to align with the group, and known timings that are most effective.

Time-informed planning

Muffins got tired waiting for fellow students to reply to his post.

Muffins got tired waiting for fellow students to reply to his post.

Knowing study habits, and preferences, for off and on-line study could make a difference here. If the teacher had given the students a different time over the week it might have altered contributions to the task. Data in the previous post indicates that learners access educational environments more in the week than the weekend. An activity given on Friday and expected for Monday seems unfair on two levels; a weekend is an important time for a break and weekends are not as busy as weekdays for online activity.

If the week shows a pattern of access for online, then an online task could be created around the understanding of access patterns. If online tasks are planned around this, then it may affect the outcome.

Does time-informed learning design make a difference?

There’s only one way to know, really, and that’s to perform an experiment around a hypothesis. The examples above were based on a group/cohort discussion & it made a lot of assumptions but it provides a basis of which I wanted to conduct some further research.

Time-based instruction and learning. Is activity design overlooked?

In the examples, the teacher is making an assumption that their students will ‘find the time’. This is perfectly acceptable, but students may better perform ‘time-finding’ when they are also wrapped into a strong schedule, or structure for their studies. Traditionally this is bound to the restrictions of the timetabling/room access, teacher’s duties and the learners’ schedules (plus any other factors). But with online learning (or blended) the timetabling or time-planning duty is displaced into a new environment. This online space is marketed as open, personalised, in-your-own-time – all of which is very positive. However, it’s also coming with the negative aspect of self-organisation and could, possible, be a little too loosely defined. Perhaps especially so when it’s no longer personal, but group or cohort based.

There’s no intention here of mandating when learners should be online – that’s certainly not the point. In the first instance it’s about being aware of when they might be online, and better planning around that. In this first instance, the intention is to see if this is even ‘a thing to factor in’.

Chronology is the study of time. Time online is a stranger concept than time in f2f. For face to face the timing of a session is roughly an hour, or two. Online it could be the same, but not in one chunk. Fragmentation, openness and flexibility are all key components – learners can come and go whenever they like, and our logs showing how many UK connections are made to UCL Moodle at 3-5AM show this quite clearly.

Chronogogy is just a little branding for the foundation of the idea that instructional design, i.e. the planning and building of activities for online learning, may need to factor time into the design process. This isn’t to say ‘time is important’ but that by understanding more about access patterns for users, especially (but not necessarily only) online educational environments, could influence the timing and design of timing for online activities. This impact could directly impact the student and teacher experiences. This naturally could come back into f2f sessions too, where the chronogogy has been considered to ensure that the blended components are properly supporting the rest of the course.

Time-led instructional design, or chronogogically informed learning design could potentially become ever more important if considering fully online courses that rely heavily on user to user-interaction as a foundation to the student experience. For example the Open University who rely heavily on discussion forums or MOOCs where learner to learner interaction is the only viable form.

Most online courses would state that student interaction is on the critical path to success. From credit-bearing courses to MOOCs – it’s likely that if adding chronogogy into the course structure, then consideration can inform design decisions early in the development process. This would be important when considering:

  • Planned discussions
  • Release of new materials
  • Synchronous activities
  • Engagement prompts*

In another example, MOOCs (in 2013) seem to attract a range of learners. Some are fully engaged, participate in all the activities, review all the resources and earn completion certificates. Others do less than this, lurking in the shadows as some may say, but remain to have a perfectly satisfactory experience. Research is being performed into these engagement patterns and much talk of increasing retention has sparked within educational and political circles, for MOOCs and Distance Learning engagement/attrition.

One factor to consider here is how you encourage activity in a large and disparate group. The fourth point above, engagement prompts, is a way of enticing learners back to the online environment. Something needs to bring them back and this may be something simple like an email from the course lead.  Data may suggest that sending this on a Saturday could have a very different result than on a Tuesday.

Engagement prompts as the carrot, or stick?

Among many areas till to explore is that if learners were less active over the weekends, for example, then would promoting them to action – i.e. via an engagement prompt, provide a positive or negative return? This could be addressed via an experiment.

Concluding thoughts

I seem interested in this field, but I wonder of its true value. I’d be keen to hear you thoughts. Some things for me to consider are:

  • If there’s peaks and troughs in access – what would happen if this could be levelled out?
  • How could further research be conducted (live or archive data sets).
  • Have I missed something in the theory of learning design that is based on time-led instruction?
  • I wonder what learners would think of this, canvas for their opinions.
  • Could I make a small modification to Moodle to record data to show engagement/forum posting to create a more focused data set?
  • Am I mad?


Chronogogy – time-led learning design for online education

By Matt Jenner, on 13 November 2013

If analytic data suggests there is a ‘heartbeat’ of online activity should this inform learning design?

Background

Planning for f2f teaching is largely led by institutional limitations and personal habits. Rooms are booked in 1-hour slots and sessions can only be so-many-hours long. As people can’t stand and talk for hours plus few would sit there and listen for the same period. There’s also only so much time in the day, especially ‘core working hours’. Time for education gets murkier when considering flexible learning, say clinicians who must be in practice between certain times or evening-study students.

Chrono-based design is as old as time itself

Chrono-based design is as old as time itself

In all walks of education, from homework to dissertations, teachers set activities to be completed in student’s own time. Time planning for f2f education is often based on teaching time, set in rooms, schedules, people, slots. Time for learning has to fit into this schedule and is otherwise completed out of these normal hours. Students are expected to complete a substantial amount of personal learning hours – often tied to readings or assessment activities.

Programmes at higher education institutions are increasingly moving into online environments, many of which are still taught in traditional ways. There remains a large focus on face to face teaching and learning activities such as lecture, seminar, lab & essay led teaching. An increasing number are using online learning environments to provide some supportive or supplementary educational value. Some are ‘blended learning’ where elements of the course must be completed online by the learners. Contact time is altered where some is face to face and an amount is also online.  A smaller number are fully online, where the online environment is driving the course, delivering a structured programme of study via resources and activities.

Building for these environments is often a process which involves a significant amount of investment for the teachers and learners.

Teachers

  • Often going alone, designing what works best for their teaching style, their students and making best use of their knowledge of the available tools .
  • Sometimes they may ask for support or advice on best practices, examples, tips and tricks and other approaches improve their original ideas.
  • Some invest additional resource to make larger changes.
  • Courses will always be refreshed over the years, often this comes with a partnership of moving more content online and reworking the existing online content to improve it.

Learners

  • Need to adapt to different approaches of teaching. One part of their course may be very traditional, others may be more online.
  • Method of delivery may influence enrolment decisions.
  • Work/life/study balance & looking for flexibility built into courses.
  • Increasingly using online environments in their daily life.
  • There’s a digital divide between some individuals, some generations and their digital literacies.

Through the techtonic [sic] shifts in education the definition of ‘how people learn’ and ‘good teaching’ remains quite similar to that of 50 or 2000 years ago, and yet still quite hard to define. Many have tried, such as Bloom, Dewey, Paiget, Vygotsky, etc & we should embrace their work. However, it remain somewhat marred by the findings and the reality that most teachers are significantly impacted in how they were taught, and would still reflect this back in their own teaching. (Which is an opportunity for the expansion of innovation, if good teachers influence more good teachers.)

Technology in education has looked at converting the ‘sage on the stage’ to the ‘guide on the side’ for some time. If a good educational experience is about providing agency for individuals to become the best learners they can be, then we need to also reflect that in the design for learning.

Interaction and engagement are often driving factors

The design of online teaching and e-learning is often reserved for academic developers, educational technologists and teachers. Designs often cover what will be taught, intended learning outcomes, design of activities, overall structure & any resources required. Design is often overlooked, and many go directly past the planning phase in favour of the building/development phase. This is perfectly acceptable, especially if on a path over a number of years, increasingly using the affordances of e-learning tools to complement their teaching and learning.

Often skipped, or under-resourced are the steps within the planning phase for a blended or fully online course. This may have more substantial repercussions as skipping design can lead to greater issues later on, which may need to be revisited. Luckily, cyclic design methodologies (whether intentional, or not) are no bad thing. It’s a little chicken & egg and the lack of planning is often due to lack of time across the sector/universe.

Designing a good structure for the course is often one of the first tasks needed. The rest of the course should hang off the back of a good structure:

  • The structure will, particularly with a fully online course, define what needs doing, and when.
  • This is the guide for the students, the stick, the planner, the measure of success and the motivator to stay on track.
  • When thinking of how much time students will spend on tasks, and when they do the task may have been overlooked.
  • A course overview/week-by-week structure is often where the planning of the chronology of the course starts, stops and the rhythm within.

Learning design to incorporate time as a critical factor?

Not factoring in when a learner will engage in an online environment could increasingly become a bigger issue. In an attempt to identify the importance of this issue, this blog post was written.

Chrono-what?

  • Chrono – time
  • Gogy – lead
  • Pedagogy – to lead the child
  • Chronogogy /  chronogogical – to lead by the time, time-led

I felt that this might have significance, and anything of that nature would require promotion within the relevant fields for others to rip it apar, to build retaliating endurance into the concept. After looking for time-influenced learning design in conference proceedings, journals and blogs I found nothing on the subject of time-based instructional/learning design or impact. I had to put a term down to then build upon. Sorry if you don’t like it.

Using captured analytic data to measure ‘visit’ hits & drawing crazy ideas off the back of it

Learning analytics is an emerging field within education where data is used to inform the success, design and evaluation of online learning. In a simplistic model used here, we have taken Google analytics visitor data for one month to attempt and identify if we can see any trends with correlation to learning design. It’s a crude example, but the whole post is based on answering my ‘is this a thing?’ question (it’s bothered me for around six months).

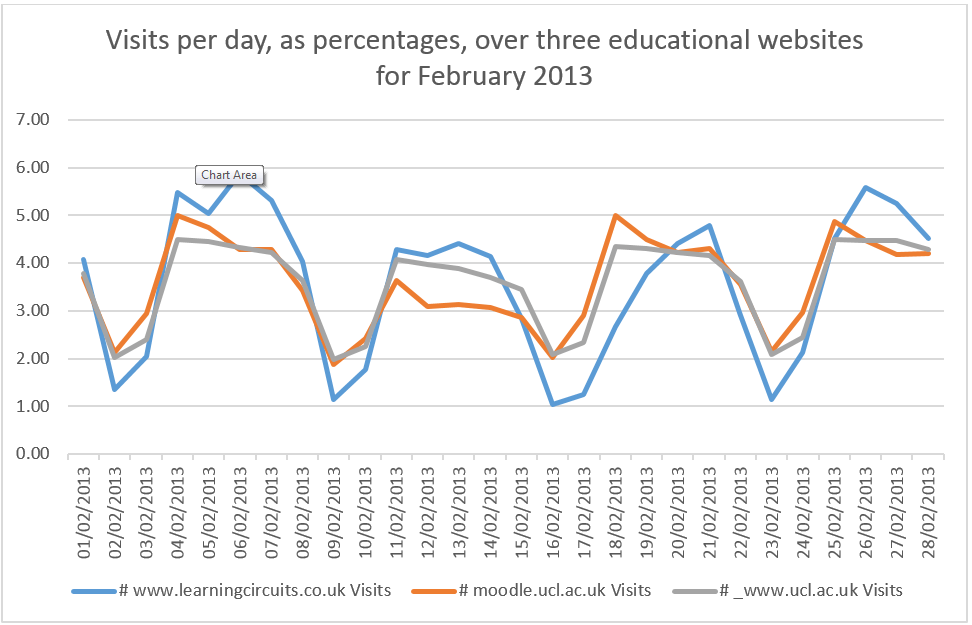
Visits per day, as percentages, over three educatioal websites for February 2013
  • Website 1 – Learning Circuits – an interactive educational resource for 8-10 year old children (I made this a decade ago, still going)
  • Website 2 – UCL Moodle – an institutional online teaching and learning environment
  • Website 3 – UCL.ac.uk – the main UCL website, hosting information about the university.

These data show a regular path of activity for the number of visits to websites across the February time period. The websites are all of an educational nature, but differ in their intended target audiences. Y-axis shows the percentage of the monthly number of visits for that day. X-axis shows the day of the month. The chart clearly shows a rhythm in visits, going up and down in a pattern.

The websites were selected for two reasons

  1. This is an educational observation (but it may be of interest to others if it rung true on other domains)
  2. These websites were the ones the author had access to for analytical information
We can study these data and make several observations across all three domains:
  • There is a distinct shape in visits.

    M-shape of activity

    M-shape of activity

  • There is a regular drop in the weekend, both days seeing less than half of the weekday visits
  • Saturday is the lowest point every week. Sunday is rarely much higher.
  • There is a slight drop on Wednesdays.
  • This month shows a heartbeat shape to the number of visits.
  • There is a slight shaping of an M over the weeks, where single websites, or all together, still create this rough M-shape (shown best in blue)
    • Sunday is the beginning point
    • Monday/Tuesday is the first highest
    • Wednesday shows some drop
    • Thursday marks the second peak
    • Friday is often slightly lower that a Monday or Tuesday counter-part, but still holds up the M-shape
    • Saturday is the lowest point of the week.

Repeating in other months?

February was chosen as a month in the year as it showed steady visits across three educational, but different sites. Each site has a different busy period, as shown below:

Overview of the number of users for UCL Moodle and activity over the year.

Overview of the number of users for UCL Moodle and activity over the year

Overview of the number of users for UCL Moodle and activity over the year

Overview of the number of users for Learning Circuits and activity over the year

Overview of the number of users for Learning Circuits and activity over the year

Overview of the number of users for Learning Circuits and activity over the year

 (Sorry no raw data for UCL.ac.uk)
Note: the M-shape persists across these charts. 

Sticking with February we looked at the same month for the past five years:
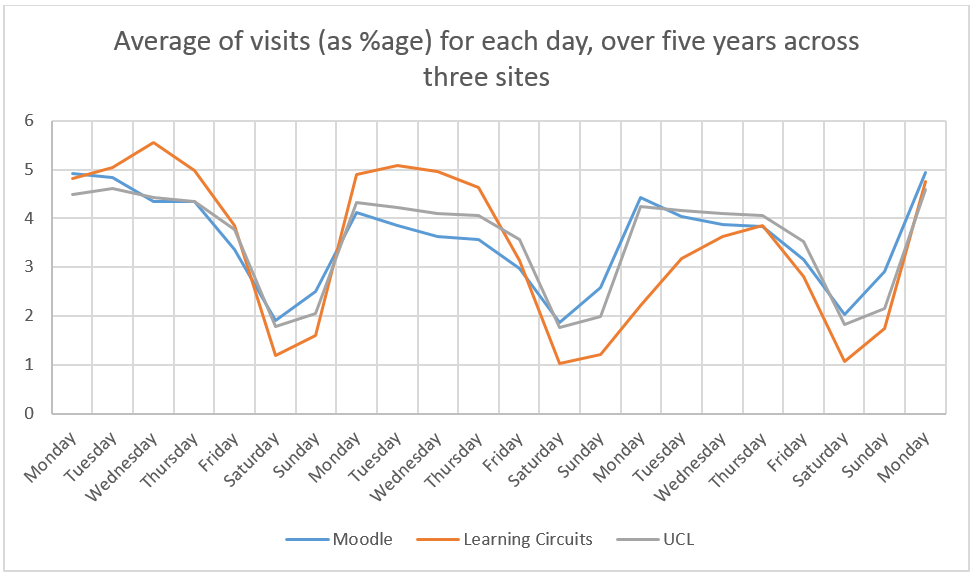
Average of visits, as a percentage, for each day, over five years across three sites

Average of visits, as a percentage, for each day, over five years across three sites

This chart shows the percentage of the visits per day of the week, for three websites, over a five year period. The purpose of this chart is to see if the data shown in the first chart, for February 2013, would be repeated over a longer period. The chart is done by day, and not date & the chart runs over fewer days as the first Monday of February would fall on different days, thus shortening the timeframe to evaluate.  The chart shows Saturday having the lowest number of visits over the week, with Sunday resulting in a similar number. The M-shape is less common with Wednesday gaining more visits over a longer time period. The heartbeat over the week, with peaks around Monday/Tuesday and Thursday/Friday remain to show the highest number of visits, especially when compared to weekends.

Out of Winter, across the year

Look across a whole year, in this example 2012, we can see if the data is true across all months and not just February.
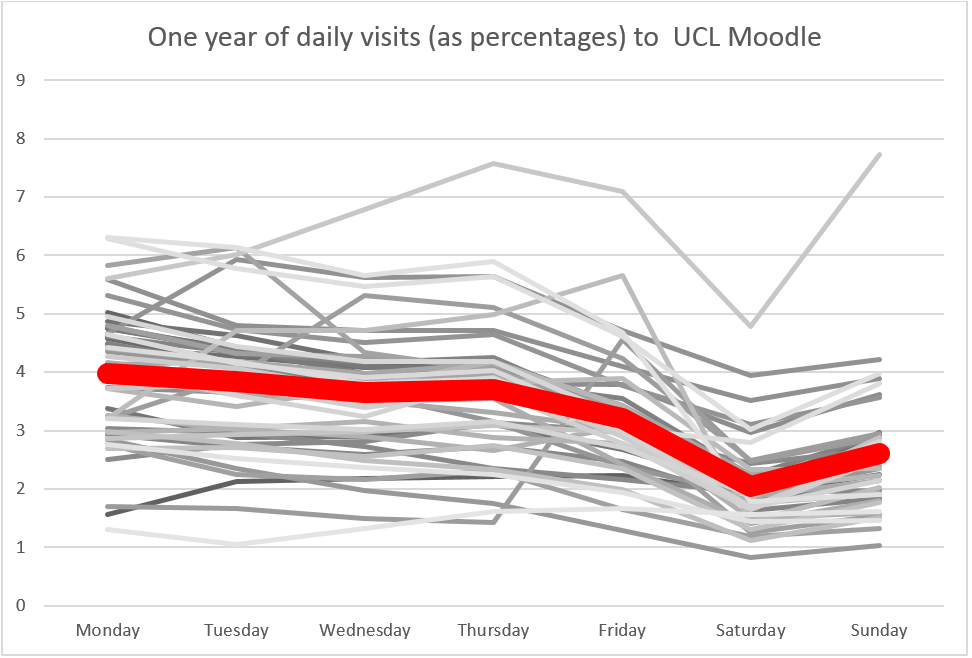
One year of daily visits, as percentages, to UCL Moodle

One year of daily visits, as percentages, to UCL Moodle

And for Learning Circuits
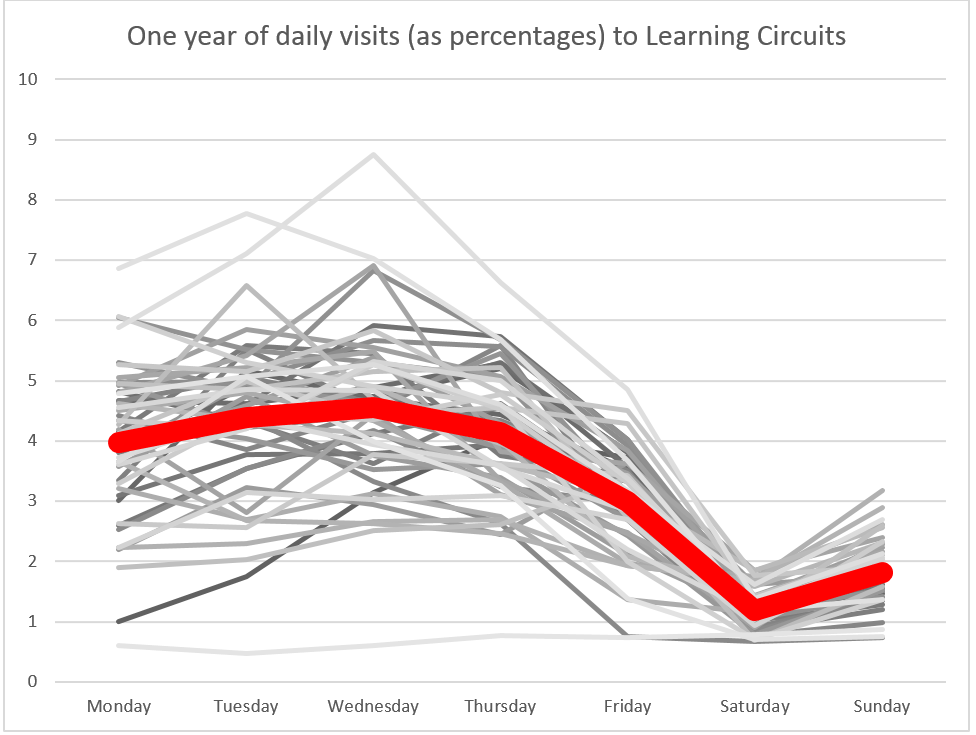
One year of daily visits, as percentages, to Learning Circuits

One year of daily visits, as percentages, to Learning Circuits

These two charts show the average (as red) of the percentage of visits over the week. There is no longer an M-shape but do continue to show Saturday and Sunday as the lowest number of visits during the week. Wednesday becomes an increasingly common day over the year for number of visits and for Learning Circuits becomes the most popular day. (This might not have been helped by using Mean numbers and a handful of disproportional and high plots in around week 40 in the year.) UCL Moodle has a similar pattern, with one result much higher above than all others – this is the first week of term in September where the average for the month is very low initially, so on comparison that week is substantially higher. No chart exists for UCL.ac.uk – sorry.

Each of these two charts show the number of visits across two of the sites over a one year period (2012). The intention here is to primarily show that the ‘heartbeat’ of online activity is regular across the year. There are low and high points, but when matched up to the charts above, showing each week’s average, they show that the data analysis, in particular Saturday and Sunday being quiet days, remains true across the year for both domains.

Quantitative vs qualitative

I wonder how long you’ve been thinking ‘he’s not measuring this data very well’. Firstly, I accept all contributions to this. Secondly, this is a desk-based observation, not a research proposal. Any next step would be to review a longitudinal study with an online course, proper data analysis and a real methodology. This is just an idea-incubated post I’m afraid.

Discussion point

Much like the National Grid boost up the power networks when an advertisement break is coming in the nation’s favourite soap operas, could the same be said for a course designer planning their online learning? Perhaps not providing a boost, but instead being aware, and planning for, peaks of online activity?

IF, for example, I were planning an asynchronous activity for my learners would I want to set it for Friday and hope it’s completed by Monday? When would be the best time to plan this?

Most at the moment just set up a week-based activity and hope learners can manage their time effectively around this. However, if the data above can be read into, then more people will be online during the week rather than the weekend. Therefore, it would be best planned over the week, but does this depend on the type of task? What about synchronous activities?

I appreciate this is half-baked but I wanted to share a few simply observations:

  1. Activity online is clearly displayed in analytical review of web access logs
  2. This activity seems to indicate a pattern of peaks and troughs, of a ‘heartbeat’ of online visitor activity (measured in days)
  3. Has time-led instructional design (I like the terms chronogogy of learning design, chronogogical instructional design or chronogogically informed teaching and learning) been undervalued/overlooked in past learning design models for online education?
  4. Does this have a wider impact for online education, including distance learning and MOOCs?

Next steps

I’ve got a few ideas:

  • Talk to fellow educators, technical and less so, ask them if this really has an impact
  • Review course design, basic principles, feed into them the idea of time-based / chronogogical learning design
  • Expand upon this. We have a ‘Moodle archive’ – find a course with an activity like discussion forums and try to match up stored data with analytics information. Does anything correlate? 
  • Build it into a platform and measure the data points over a period of time, for a selection of courses
  • Fester in a basement for six years completing a part-time research project and slowly lose my mind over a somewhat trivial matter.

Closing

If analytic data suggests there is a ‘heartbeat’ of online activity should this inform learning design? I’d like to hear your feedback, as I think should. I’m going to keep looking into it, I just wanted to share some early thoughts with the internet and its people.

edit: sorry, a grammatically-correct friend provided me some advice on lead vs led. People are reading at least!

The future of Moodle is well within our grasp

By Matt Jenner, on 17 September 2012

Moodle is open source software and is used by millions of people around the world. Open source allows anyone to tinker with the code; adding new things, changing existing & ultimately deciding which direction their Moodle heads in. Many of these changes are shared within the Moodle community for others to freely use – this leads to the core software being developed, extended and reformed in many directions. Keeping a steer on this is Moodle HQ, a group of 20 ‘core’ developers and, tightly connected, many global developers, testers, documentation writers, really helpfulers (people who help the community on Moodle.org with problems) and many others. What’s sometimes lacking with Moodle is the input, or link to education research including academics, learners, administrators, developers, testers, researchers and everyone else.

1st Moodle Research Conference

Blogging from Crete – Greece, this post attempts to summarise two days of the 1st Moodle Research Conference. The conference was the first iteration of an event unlike other established Moodle, or educational meet-ups. Sold as “a unique event dedicated to the research and development (R&D) on learning and teaching carried out with Moodle”. What that actually meant evolved right though the two days as the conference delegates shared, talked and discovered the direction Moodle is heading in.

The international conference had around 70 delegates from 22 countries. There were 23 presentations showcasing developments, case studies, new tools, learning designs, learning analytics and addressing challenging issues and introducing new ideas; all for Moodle. Additionally there were seven posters, three meals, one panel discussion and one keynote – from Martin Dougiamas, the man who invented Moodle. If that wasn’t enough, we were also in the Creta Maris – a somewhat splendid and slightly distracting conference venue with the Mediterranean Sea lapping at our feet, the sun beating down and wild cats meowing for scraps of lunch.

The aim of the conference, at least from my perspective, was to see how educational research was influencing Moodle development. After all, we have this tool which is designed around teaching and learning but it also continual evolves. To ensure it changes along with established understanding of how people learn and what affordances technologies can offer, we must ensure a cyclic loop exists, with each feeding in the other. Or, at least that’s the idea.

User-centred design

Often is the case that developers say they wish to just get on with developing and that theorists are too theoretical (with their heads in the clouds). The crux of the issue seems to be that established and ratified theory must influence design, design must influence development and developers must do the same.

User centred design (SAP, 2012)

One argument against Moodle is that it’s not intuitive, this may be most strongly felt by academics as they mutter that Moodle doesn’t quite map onto teaching, takes too much time and isn’t always an environment which encourages alternative approaches to learning and teaching. Instead, and this is something I’m happy to agree with, Moodle is technology, this is akin to something ‘that doesn’t work yet’. If Moodle ‘worked’ we wouldn’t need so many people helping with it, it’d just ‘work’. To keep things simple, I don’t remember the last time I explained how a chair works, which was once a technology itself.

Moodle is over 10 years old now, and along the way many innovative additions have come to the software. But, also over the years sometimes developments have not always been linked to the research and, unfortunately the emergent disconnect between designers, practitioners, theorists and everyone in the middle appears. This has resulted in both innovation and disruption. Moodle development is the output of highly skilled and passionate people all contributing towards something they want to improve. What’s being addressed here is slightly more complex, with so many developments it’s often hard to see where the edges are. Further, developments are not necessarily tied together, and we end up being back outside the cyclic process shown above.

While there is plenty of time to disseminate the talks in the conference, I felt this blog post was better positioned to give a higher level view into what’s happening with Moodle. The simple fact is the web is evolving very quickly, start-ups can build, destroy and rebuild with minimal fear of reprise. This could be because they promote agility in their staff and in their product, or because they are nowhere near as established as something like Moodle where agility can have a negative impact for a large community of users.

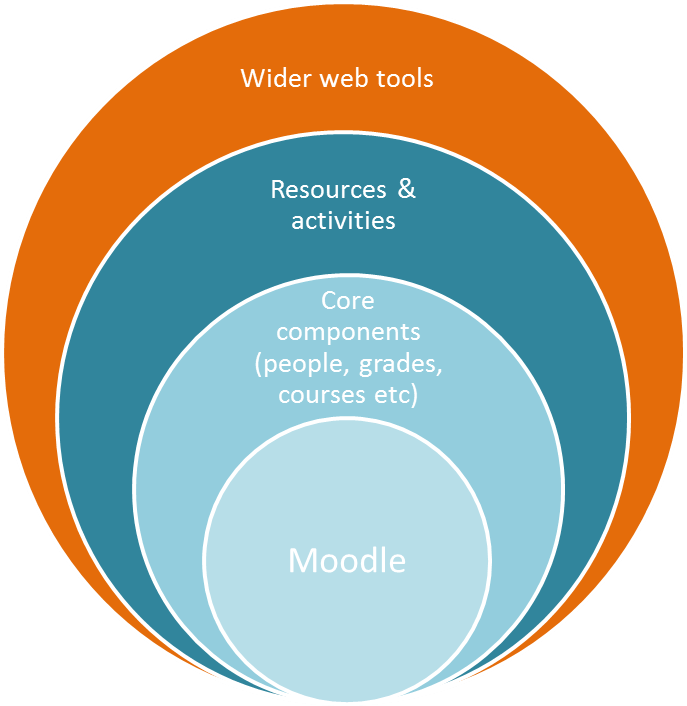
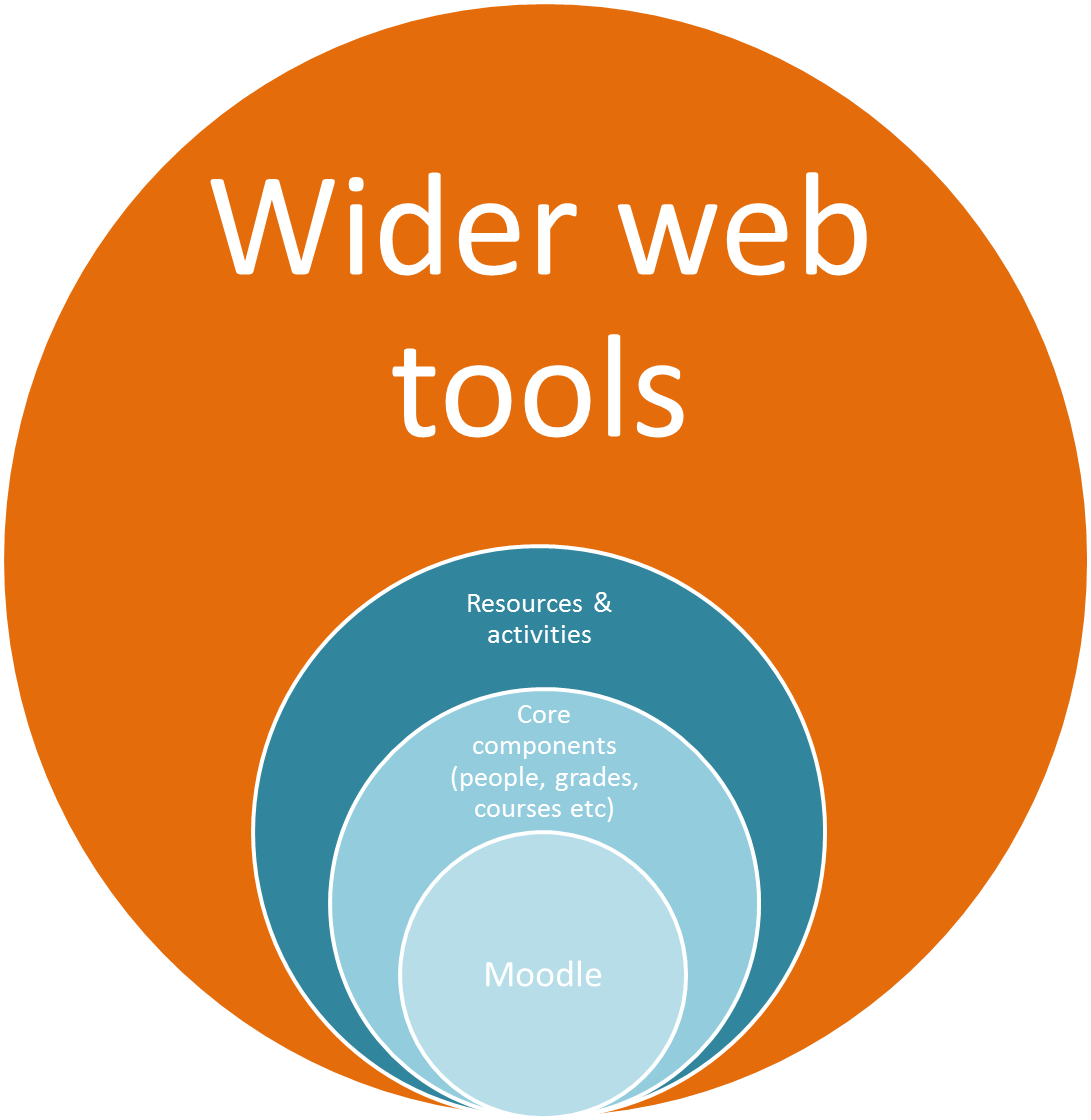
What is Moodle now

Essentially a lot of Moodle is internally facing, tools are developed to be a part of the ecosystem of Moodle.

What will Moodle become?

This is harder to describe, but the value of tools external to Moodle are immensely useful. Linking intelligently to these is important, and focusing on strengthening the internal tools make sense, rather than necessarily diversifying them by adding many more. This is just one view, the route is still to be defined. The important thing is to consider Moodle as the base, the developments focus around educational developments and the wider tools linked in, rather than reinvented.

The next direction?

What’s most important is that the developments are fed back from users; that’s all types identified. The next few years are going to be important for Moodle, for UCL and the wider community. At some point will come the dreaded system review, comparison and evaluation. It will have to stand up against the changing landscape of tools and environments for online learning and teaching. By concentrating its developments around the best understanding of relevant pedagogical research, it’ll hopefully retain Moodle’s strength, improve the system for everyone and keep Moodle aligned as one of the world’s best learning management systems.

Well, that’s the current plan. 

References

SAP (2012).  Principles of UI Development, SAP Community Network. Last accessed 17th September 2012 from http://wiki.sdn.sap.com/wiki/display/BBA/Principles+of+UI+Development