X Close

Centre for Education Policy and Equalising Opportunities (CEPEO)

Home

We create research to improve the education system and equalise opportunities for all.

Menu

Archive for the 'CEPEO' Category

Why greater investment in early years should be a no-brainer for the Chancellor

By Blog Editor, on 14 March 2023

Claire Crawford & Laura Outhwaite

With the Budget just around the corner, the calls for the Chancellor to tackle soaring childcare costs are growing into a clamour. A recent survey estimated the average cost of a full-time childcare place for a 2-year-old in England at nearly £15k per year – an eye watering 45% of the median annual salary of a full-time employee in the UK. For a parent – unfortunately still usually the mother – considering whether to work following the birth of their child, knowing that such a large chunk of their take-home pay is likely be swallowed by childcare costs will inevitably give them pause. This has implications for the economy in the short-term, potentially drawing valuable labour out of the workforce at a time of high labour demand and skills shortages. It also has implications for inequalities in school readiness and beyond, as those from lower socio-economic backgrounds are less likely to access high quality early years education, which benefits children’s development.

Public opinion seems to be pointing clearly in the direction of greater support for early years. But does the evidence support this position? And how generous would the Chancellor have to be on Wednesday lunchtime to make a material difference to these challenges?

Our new briefing note reviews the evidence on the effects of offering free or highly subsidised childcare for parents and children. It also compares what the evidence suggests might be the optimal policy to what is currently available in England, to highlight what additional investment might be required.

There are two main takeaways:

  • First, there is a strong evidence-based case for significant additional government investment in early childhood education and care (ECEC). The evidence suggests that offering additional free or highly subsidised childcare for parents of 0-2-year-olds could encourage more mothers to work (more) and also benefit children’s development. Part-time provision (e.g., 15 hours per week during term-time) might be sufficient to deliver the benefits for children, but would be unlikely to increase mothers’ labour supply very much; greater investment (offering full-time provision, ideally across the full year rather than term-time only) would be required to achieve this.
  • Second, quality is key. This is vital to maximise the benefits for children’s development, but its importance goes beyond this. Parents will be more likely to use the provision available – especially for younger children – if they are happy with the quality of care their child is receiving, making it crucial for labour supply decisions. Moreover, evidence suggests that a child attending a low-quality setting can have negative effects on the wellbeing of both parents and children. For all of these reasons, it is essential that providers are paid sufficiently for the care they deliver.

What does this mean the Chancellor should do on Wednesday lunchtime? Our reading of the evidence leads us to make two primary recommendations:

  • The funding rate paid by the government to cover the free early education entitlements for 3-4-year-olds and disadvantaged 2-year-olds in England should be increased. This would help to cover cost rises that are largely out of providers’ hands (e.g., energy price rises, increases to the National Living Wage) and reduce the incentive for providers to charge more for privately paid-for hours of care to compensate for the lower rate paid by the government. This would enable providers to reduce fees and/or invest more in raising the quality of care they provide.
  • A more generous childcare subsidy should be introduced for families of 0-2-year-olds, to reduce the financial barriers to work, particularly for mothers, and support children’s development. The subsidy should be progressive – higher (potentially 100%) for families with lower income – to minimise the risk of such reforms widening inequalities. As discussed in more detail in our submission to the Education Select Committee’s Inquiry on Support for Childcare and Early Years, it would be more transparent for such a subsidy to be delivered via something like the tax-free childcare system than by offering more free hours of care during term-time only, whose benefits are less than the headline amount for families who need childcare throughout the year.

It has been widely reported in the media that the Chancellor will announce the cap on childcare costs that can be claimed by Universal Credit recipients will be raised, and that families will be able to claim childcare costs upfront rather than in arrears. While this will undoubtedly be good news for families for whom these restrictions would otherwise prevent them from using childcare or moving into work, if that is the limit of the financial support for childcare announced on Wednesday lunchtime, then the Chancellor will have disappointed many – and gone against the evidence outlined in our briefing note.

What could arguably be described as ‘tinkering around the edges’ is not going to generate the kind of sizeable reduction in childcare costs that is needed to make a material difference to families’ budgets, parents’ labour supply decisions or children’s development. It is also crucial that any actions taken to reduce childcare costs for families are not delivered at the expense of reducing the quality of care on offer. For both reasons, as we highlighted in another recent briefing note reviewing the evidence on the links between childcare ratios and children’s outcomes, relaxing childcare ratios is unlikely to be a good solution to the current childcare conundrum either.

The evidence suggests that investing in high quality ECEC is likely to provide a triple whammy of benefits – improving children’s development, increasing family income and boosting productivity – and that the long-run benefits are highly likely to outweigh the short-term costs. We can only hope that current labour demands are sufficient to provide the short-term incentive needed for the Chancellor to look beyond the gloomy fiscal position and make the kind of long-term investment needed to deliver these benefits.

Are Ofsted inspections helpful for choosing secondary schools?

By Blog Editor, on 1 March 2023

By Sam Sims.

Each year, the parents and carers of around half a million pupils submit applications to attend their preferred secondary schools. This decision usually determines the quality of the education that their child receives between age 11 and 16, when they take their GCSEs.

A 2017 YouGov poll found that just under half of parents looked at Ofsted reports to inform their choice. Besides proximity to home, Ofsted inspection judgments were cited as the most important influence on their choices.

Parents put enough weight on these judgements that Rightmove displays the inspection judgements of nearby schools for each of the properties listed on their website. Indeed, research shows that when schools’ Ofsted ratings increase, the price of nearby houses also increase as parents move into the ‘catchment area’.

Ofsted also argue that inspections support school choice: “Inspection provides important information to parents… [who] should be able to make informed choices based on the information published in inspection reports.”

However, one reason to doubt whether Ofsted can inform school choice is that many schools haven’t been inspected for several years. Consider a parent who was choosing a school in October 2013. They might be reading a report from an inspection that was conducted in 2011, and their child wouldn’t start at the school until September 2014. Of course, parents are really interested in how good the school will be in the five years after that (2014 to 2019).

So are Ofsted inspections really helpful for informing secondary school choice? To find out, John Jerrim, Christian Bokhove, and I analysed all inspections of mainstream secondary schools conducted between 2005 and 2015. We focused on inspections from this period – under the old inspection framework – so that we could look up what really happened to the pupils who subsequently attended these schools.

For our hypothetical parent, we found that the most recent inspection report across our 2,538 secondary schools was on average 1,040 days (almost 3 years) old by the time their child would begin at the school. Reports were even older in many schools rated ‘Good’ or ‘Outstanding’, which are inspected less frequently (Figure 1). These long lags mean that half of the headteachers in place when the most recent inspection was conducted were no longer in post when the child would have started at the school.

Figure 1: lags between last inspection and school entry

But perhaps old inspection grades are still informative? To tests this, we looked at whether the most recent inspection judgement predicted pupil outcomes during the period in which our hypothetical child would have actually attended the school – between  2014 and 2018.

Figure 2 shows the results when we rank schools based on average pupil GCSE attainment across 8 subjects. Schools on the far left have the lowest average attainment in the country and those on the far right have the highest. It is clear from the graph that pupils who attend a school with higher Ofsted grades at the time of application go on to attain higher.

Figure 2: School average Attainment 8 ranking by Ofsted judgement, unconditional

However, Figure 2 may simply reflect a self-fulfilling prophecy in which rich parents of high achieving children buy houses near ‘Outstanding’ schools. In Figure 3, we therefore control for pupil prior attainment, admission type, and pupil deprivation. The difference in school rankings across the four Ofsted judgements now collapses – the ranking of schools is very similar across Ofsted judgements.

Indeed, once we control for the school exam results that were available to our hypothetical parents at the time they made their choice, there is no longer any detectable difference between schools rated ‘Good’, ‘Requires Improvement’, or ‘Inadequate’. Only an ‘Outstanding’ judgement was associated with a (0.1 standard deviation) increase in pupil results.

Figure 3: School average Attainment 8 ranking by Ofsted judgement, conditional

But perhaps it’s misplaced to expect inspection judgements to add value to predicting exam results? It might be argued that inspections inform parents primarily by gathering evidence of what it is really like ‘on the ground’ in a school, which may not be adequately captured by exam results?

We tested this by looking at a range of quality metrics that would be easier for inspectors to observe than for parents. We found small differences on pupil absence rates, no differences in parental satisfaction, and (again) no detectable difference between the bottom three judgments in terms of parent reported behaviour standards.

By and large, inspection reports are not particularly useful for parents choosing secondary schools. The same could be achieved by simple applying intuitive labels like ‘Good’ or ‘Requires Improvement’ to schools based on their Progress 8 scores. The one exception to this is the ‘Outstanding’ judgement, which is informative. However, we recommend that parents think twice before paying more money for a house because it is near a ‘Good’ school.

Is there any way that inspections could better inform school choice? We found that there is a stronger relationship between Ofsted judgements and pupil progress if inspections were less than two years old. However, given that 88% of schools are currently inspected only once every five years, moving to inspect every school biennially would be a costly reform.

Young people’s physical health during the COVID-19 pandemic

By Blog Editor, on 30 January 2023

Jake Anders is Principal Investigator of the COVID Social Mobility & Opportunities study (COSMO), and an Associate Professor and Deputy Director at UCL Centre for Education Policy & Equalising Opportunities.

Although young people were among those least likely to be directly affected by severe effects of COVID-19, they were not immune from its immediate effects on health. We are better able to understand implications of this using data from the COVID Social Mobility & Opportunities study (COSMO). The study includes a representative sample of over 13,000 young people across England, who were aged 14–15 at the onset of the pandemic, and 16–17 during the academic year 2020/21 when our first data were collected.

COSMO’s purpose is also wider than the direct health impacts of COVID-19. As such, this blog post — drawing on our latest COSMO briefing published today — also takes a wider look at young people’s health behaviours during this period.

Young people’s experiences of COVID-19

When first taking part in COSMO (between October 2021 and March 2022) almost half of the cohort reported having had COVID-19 (of whom 28% had had this confirmed by a test, likely with many having been affected before widespread testing was available).

Many of these young people will have experienced relative mild — or at least, transient — symptoms. But this was not the case for all. 1 in 5 of young people who reported having had COVID-19 (just under 10% of the cohort as a whole) reported that they continued to experience symptoms more than 4 weeks after first catching the virus: the accepted definition of Long COVID. Among this group, a quarter described their case of Long COVID as limiting their ability to carry out daily activities a lot.

Figure 1: Proportion reporting a case of severe long COVID by deprivation quintile group

Furthermore, there were inequalities in young people’s chances of experiencing long COVID. Among those who reported having caught COVID-19, those from less socio-economically advantaged backgrounds were more likely to report that this had persisted into a case of long COVID. This is despite no difference in reporting having contracted COVID-19 between these groups. What, then, explains differences in this persistence? Reasons for these inequalities are rather uncertain. One hypothesis is that getting sufficient rest is important for COVID-19 recovery, and this may be easier to achieve for some groups than others. Another is that pre-existing differences in overall health levels associated with socio-economic status pre-infection explain risk of prolonged disease.

Educational consequences of physical health during the pandemic

Young people who reported having experienced severe Long COVID received lower teacher-assessed GCSEs than their peers who had never had COVID-19. Given the differences discussed above between young people who experienced severe Long COVID, we wanted to ensure that this was not simply an artefact of these differences. After adjusting statistically for differences in demographics, socio-economic status, and prior attainment, it was still the case that young people who had experienced severe long COVID performed worse than comparable peers. The size of this difference is very roughly equivalent to two months of learning.

Figure 2: Differences in GCSE teacher assessed grades by shielding status and severe long COVID

Notes: Differences reported have been standardised. Severe long COVID analysis is compared to those who reported not having had COVID at all.

Those who were asked to shield during the pandemic — because pre-existing medical conditions meant that they were at the highest risk of severe illness if they caught COVID-19 — also received lower grades in their teacher assessed GCSEs than their peers. 8% of the COSMO cohort reported being asked to shield and — after adjusting for demographics, socio-economic status, and prior attainment — had lower GCSE grades very roughly equivalent to four months of learning.

Young people’s wider health

COSMO also allows us to shine a light more broadly on the health of this generation of young people.

Continuing a trend seen across successive cohorts, this cohort of 16–17 year olds are less likely to drink alcohol than those who came before them. 63% say they have ever done so, compared to 85% of a comparable group of 16–17 year olds in 2007. Across various measures, pupils from advantaged backgrounds (such as those attending private schools, or in state schools with more advantaged intakes) are more likely to report ever having drunk alcohol, and reported drinking more frequently.

This group of young people are more likely to have ever used an e-cigarette (33%) than to have ever smoked a cigarette (23%). However, regular e-cigarette use is much lower than this might imply. Just 6% report using e-cigarettes once a day or more. In contrast to alcohol use, those from less advantaged backgrounds are more likely to use e-cigarettes than their more advantaged peers.

Just under 1 in 6 of this cohort of young people report having ever tried any illegal drugs. Among those who have, almost all had tried cannabis. Just 4% of the sample reported having tried any other illegal substance. And similar to the patterning seen with alcohol, those in more advantaged circumstances were more likely to have taken an illegal drug. Those identifying as White or Mixed ethnic background are far more likely to report having tried illegal drugs than any other ethnic groups.

Conclusions

With attention on issues around COVID-19 fading, we should not forget its continuing effect on those for whom it was a particularly debilitating illness to experience. Some continue to suffer from long COVID. Even those who have recovered have seen implications for their wider lives and life chances, such as lower academic attainment scores for those who experienced severe long COVID. These impacts also seem to have reinforced existing health and socioeconomic inequalities.

COSMO also helps us shine a wider light on the experiences of this cohort of young people, and quite how much this has changed compared to earlier generations. Substantially reduced drinking of alcohol compared to earlier generations, low rates of drug use, and the emergence of e-cigarette use all raise questions about implications for future health, too.

There is more detail on these findings, as well as a wider range of health impacts and behaviour of the COSMO cohort, in our latest briefing note. You can also find our earlier briefing notes on the study website.

Do contextual admissions hold back productivity?

By Blog Editor, on 20 December 2022

By Gill Wyness, Lindsey Macmillan, Claire Crawford and Richard Murphy.

There are substantial financial gains to attending university, and gains are especially high for the most selective institutions, from which many of the highest paying professions recruit. Recognising this, many parents send their children to independent schools, believing that this will dramatically increase their chances of gaining a place at a highly competitive institution. But a recent investigation by The Telegraph suggests the independent school stranglehold on Oxbridge is under threat, with the likelihood of their pupils receiving an offer dropping dramatically over the last five years. Commentators have blamed the practise of contextual admissions, which give pupils from state schools preferential entry – in some cases even when they have lower entry grades than those from private schools. Those against the practise argue it amounts to “class discrimination” and “social engineering”.

But the reality is that there is a clear economic rationale for contextual admissions. Students from disadvantaged backgrounds have typically received far less investment in their education than their more advantaged peers – including, but not limited to, the fact that they tend to attend lower quality schools. We would expect these disadvantages to translate into lower grades for a given level of underlying ‘ability’, reducing promising but disadvantaged students’ chances of gaining a place at a selective university. Grades are therefore contextualised for equity reasons, to “level the playing field” at this crucial life stage.

While there can be little doubt that contextual admissions improve equity, good economic policies should also be efficient. But many are concerned that contextual admissions may be inefficient. This would be the case if the lower attaining state school students who were given preferential entry to Oxbridge found themselves struggling academically, did poorly in their degrees and were less productive in the labour market. If their net gain from Oxbridge (versus how well they would have done at a lower quality institution) is lower than that which would have been experienced by the independent school students they displaced (taking account of how well the displaced student would have done at Oxbridge versus where they eventually ended up), this would constitute an efficiency loss. We should consider this equity-efficiency trade-off when we think about contextual admissions.

So, does it matter which students go to which universities? Are there higher returns for higher achieving students attending highly selective courses? Could the practice of contextual admissions be said to be damaging productivity or hampering economic growth?

One area of research we can look to, to inform this debate, is the area of student to university match. Research in this area considers the types of courses that students of different achievement levels attend, asking which is the most important for earnings: student achievement, course quality, or the interaction – or match – between the two. This helps address the question of whether students have better outcomes at universities to which they are better ‘matched’.

The evidence from this relatively small area of literature is mixed, however, with much of the evidence based on the effects of affirmative action bans in the United States. This has strong parallels with the use of contextualised admissions, in that it concerns the use of race (and other factors) to judge university applicants in order to improve the diversity of student populations, and is just as controversial in the US as it is here, with ongoing legal action currently being brought against two top universities – Harvard and University of North Carolina – which has now made its way to the Supreme Court.

One paper (Arcidiacono et al, 2016) examines the impact of the ban on affirmative action in California in 1998. After the ban, minority students no longer received preferential admissions to highly selective universities like Berkeley. This study argues that lower achieving minority students at top-ranked campuses would have higher science graduation rates had they attended lower-ranked campuses – in other words it was economically inefficient to send them to these universities.

However, a more recent paper studying the same affirmative action ban (Bleemer, 2022) found that it harmed underrepresented minority students by lowering their degree attainment and wages, as after the ban they were cascaded into lower quality universities. Indeed, the study suggested that that affirmative action’s net benefits for underrepresented minority applicants exceed its net costs for the white and Asian applicants at most risk of being displaced. The two papers use quite different approaches to study the question which may provide some explanation of why they find opposing results (with the former paper using a structural model, and the latter using nonexperimental methods). Other papers (Dillon and Smith, 2020; Light and Strayer, 2000) have found some evidence of student-university match effects, but have also found that these are far outweighed by course quality effects, suggesting students of all ability levels should try to get onto the best quality course they can to maximise their earnings. In other words, disadvantaged students are just as likely to benefit from going to a high quality course as those with higher attainment on entry, meaning contextual admissions are unlikely to harm them individually – while any efficiency losses are likely to be small.

A related strand of literature from the UK compares degree outcomes for students from different backgrounds or different schools with the same achievement on entry. These studies (e.g. Crawford, 2014a,b) find that students from private schools are, on average, more likely to drop-out, less likely to complete their degree and less likely to graduate with a 1st or 2:1 than state school students entering the same course with the same grades. This hints at the fact that achievement in school does not capture ‘ability’ or ‘potential to succeed’ in the same way for those from different school types, providing support for the rationale underlying contextual admissions.

Given the scarcity of evidence, and its mixed results, it is hard to argue that there are likely to be substantial efficiency losses to society from contextual admissions – while there are undoubtedly equity gains. There are still vast socio-economic disparities in entry rates to highly selective institutions in the UK. These disparities occur because those from lower socio-economic backgrounds typically achieve lower grades than those from richer backgrounds, who have had the benefit of a lifetime of high-quality education and parental input.

Contextualising admissions is one of the few tools we have at our disposal to help students with great potential to gain a place at a selective institution. We should not outlaw this practice without good evidence that it significantly harms productivity.

How can education and skills contribute to levelling up?

By Blog Editor, on 7 December 2022

Education and skills contribute to differences in earnings and opportunities across generations, both at the national level and between local authorities in England. Targeted policies can help to reduce the gaps between individuals and contribute to efforts to level up the UK economy.

The UK is very unequal, in terms of both outcomes and opportunities. Among developed nations, it has one of the highest rates of income inequality – unequal outcomes – and one of the lowest rates of intergenerational mobility (unequal opportunities).

This is illustrated in the Great Gatsby Curve, a coinage of the late, great economist and US presidential adviser Alan Krueger, based on work by Miles Corak, which highlights how greater inequality is associated with less mobility across generations (see Figure 1).

Figure 1: The Great Gatsby curve

Source: Corak, 2013

Based on this evidence, for the past few decades, successive governments have been focused on improving social mobility, equalising opportunities or, more recently, levelling up. But these things are notoriously hard to measure, not least because policies enacted today can take decades to come to fruition in terms of future changes in inequality.

Research looking at human capital emphasises the importance of education and skills in driving productivity, wages and economic growth. Those that invest in education and training are more likely to have higher skill levels and be more productive, which means that they can earn higher wages.

Education and skills have also been shown to play a direct role in inequality, contributing to differences in earnings and opportunities across generations, both at the national level and across local authorities in England.

Studies show that differences in skills can explain at least a third of the variation in earnings within countries. Further, education and skills can account for 60-80% of the transmission of income across generations – or unequal opportunities.

Trends in inequalities in education and skills can therefore give us some useful insight into future patterns of social mobility. For example, given the improvements in the educational performance of pupils in London seen over the last two decades, it is little surprise that the capital now appears to be one of the most mobile areas in the country in terms of labour market outcomes.

What do recent trends in educational inequalities tell us about progress with levelling up?

The recent evidence on levelling up doesn’t look good. Trends in educational attainment across regions show that educational inequalities are widening across places. London continued to pull away from other regions across primary school, GCSE and A-levelachievement in 2022 compared with 2019, before the Covid-19 pandemic.

While attainment fell everywhere due to the impact of the pandemic and learning losses, key stage 2 results fell by six percentage points (ppts) in London compared with eight in the North West. Similarly, 65% of London pupils achieved the expected standard in reading, writing and maths in 2022, compared with 57% in the North West, and 56% in Yorkshire and Humber, and the East (Figure 2).

Figure 2: Map of England by key stage 2 attainment

Source: Department for Education, 2022

At key stage 4, 32.6% of GCSE entries were awarded grade seven or above in London in 2022. In the North East, the figure was 22.4%, a difference of 10.2 ppts. In 2019, the corresponding gap was 9.3 ppts.

Similarly, at A-level, the percentage of pupils achieving an A grade was 39% in London, compared with 30.8% in the North East, a gap of 8.2 ppts in 2022, relative to 3.9 ppts in 2019.

There are two points to make about this. First, the fact that attainment fell everywhere is really bad news for future productivity. If pupils are progressing with less knowledge than they had previously, they have fewer of the building blocks needed for their next stages of learning – a less solid foundation to build on moving forward. This could have very serious consequences for future labour market productivity – estimates on the cost of this ‘learning loss’ range from billions to trillions of pounds. Second, the widening of these gaps is the opposite of what we want to be seeing if we are to level up or minimise the differences between regions of the UK. These widening educational inequalities are likely to translate, in part, into widening labour market earnings and incomes unless action is taken to address the disparities.

Is there scope for this to improve?

The government has committed to a range of policiesto level up the economy, including 55 new educational investment areas (EIAs), provision of high-quality online curriculum through Oak National Academy and setting the target of 90% of primary school children achieving expected standards in reading, writing and maths by 2030. There is also talk of an overhaul of funding and governance in colleges, a skills audit, and local skill improvement plans to target specific regional needs.

Yet looking forward, it is hard to see how this picture will improve against a backdrop of increasingly squeezed school budgets. Even before the pandemic, work by the Institute for Fiscal Studies (IFS) showed that the gap in funding between state and private schools has grown steadily since 2010 (see Figure 3).

Figure 3: State school spending per pupil vs average private school fees over time (2021–22 prices)

Source: IFS

Indeed, spending per pupil in state schools declined by 9% in real terms between 2019 and 2020. This has disproportionately hit schools serving more deprived pupils and further education colleges.

Alongside the pressure of learning losses from the pandemic, the cost of living crisis and rising teachers’ wages to be paid out of existing budgets, it is hard to see how the education sector will be able to offer the support needed, particularly for the most deprived pupils.

Where can I find out more?

This post first appeared on Economics Observatory on 7 December 2022.

How has Covid-19 affected inequalities between state and private schools?

By Blog Editor, on 5 December 2022

By Jake Anders

Covid-19 caused significant and widespread disruption to young people’s education. But the effects were not the same for everyone. Many pre-existing inequalities have been exacerbated, including those between state schools and independent schools.

The pandemic has had a major effect on the education and wider lives of children and young people, ranging from access to early years provision, learning losses among school age pupils, and broader effects on mental health and wellbeing (Farmer, 2020). But the impact has not been the same for everyone.

It has become clear that school closures and online learning due to the pandemic have exacerbated existing inequalities in education. Those from disadvantaged backgrounds and pupils with additional needs (including special educational needs and disabilities) have been especially badly affected by the disruption. In this article, we focus particularly on inequalities that emerged through differences in the responses of state and private schools.

Less than 10% of young people in England attend a private school during their education. Nevertheless, these institutions have an outsized influence on the persistence of educational advantage. They are highly socially selective, with the vast majority of those attending private schools coming from families in the top 10% of the income distribution (Anders et al., 2020; Henseke et al., 2021).

Further, the gap in resources between state and private schools is large (Green et al, 2017). It has grown larger over the past decade: from £3,100 per pupil per year in 2010/11 to £6,500 by 2020/21 (Sibieta, 2021).

Based on a combination of these factors, people who have attended private schools are disproportionately likely to be employed in high-status jobs later in life (Sullivan et al., 2016). Privately educated graduates are a third more likely to enter a high-status occupation than state-educated peers from similar families and neighbourhoods (Macmillan et al., 2015).

Early on in the pandemic, there were many anecdotes about differences in school responses, emphasising some schools’ rapid move to live online lessons. But much of the data available to test these narratives only covered state schools (a notable exception is Andrew et al., 2020).

Things have changed with new data from the COVID Social Mobility & Opportunities study (COSMO). This cohort study of young people in Year 10 at the pandemic’s onset provides high quality new data to explore the issue. Here, we consider some of the differences that emerged between state and private schools due to the large resource differences and why they matter.

Schooling in lockdown

When the first national lockdown began in the spring of 2020, schools played a vital role in responding to myriad challenges facing their pupils. With concerns about welfare and wellbeing, it was understandable that tasks such as free school meal voucher distribution, checking on how pupils’ families were coping in terms of mental health, welfare and food, and providing information on where they could obtain support distracted from efforts to organise online learning for pupils. This was particularly acute for schools with many pupils from disadvantaged backgrounds (Moss et al., 2020).

With more resources and fewer issues to solve, private schools were able to move quickly to set up alternatives to in-person classes. For example, 94% of private school participants who responded to the COSMO study received live online lessons during the first national lockdown.

This was 30 percentage points higher than the rate reported among those in comprehensive schools. The vast majority (84%) also reported receiving more than three online classes per school day during this period, compared with 41% in state grammar schools and 33% in state comprehensive schools.

Figure 1: Provision of live online lessons, by school characteristics, lockdown one (March-June 2020) and lockdown three (January-March 2021)

Source: COVID Social Mobility & Opportunities study (COSMO).
Notes: N=12,505, including 11,317 in state comprehensive group; analysis weighted to account for study design and young person non-response.

There were not national school closures during the second lockdown (in the autumn of 2020). By the third national lockdown in early 2021, state schools with the most advantaged intakes had largely caught up with private schools’ remote learning provision.

Pupils in these schools were now similarly likely to be offered remote lessons (around 95% in state grammar and state comprehensive schools with the least disadvantaged intakes). But they were still not providing as many per day, with 82% of those in state grammars and 71% in the least deprived state comprehensives reporting receiving more than three online classes per day, compared with 93% in private schools.

On the other hand, state schools with more disadvantaged intakes had made less progress on both fronts – 80% of pupils in these schools reported receiving any online lessons and 53% more than three per day – remaining behind in terms of online lesson provision.

Pupils at independent schools were also more likely to have regular contact with a teacher outside class during lockdowns. Here, state schools caught up slightly in the third lockdown.

But state comprehensive pupils were more than twice as likely to report difficulties in accessing support from teachers than pupils at private schools (17% compared with 8% in the third lockdown).

Pupils at private schools also reported spending more time on schoolwork during lockdowns than their state school peers. This added up to more than one extra working day per week of time spent on schoolwork in both the first and third lockdowns.

Many of these differences are not down to the schools directly. Rather, they are due to challenges faced depending on pupils’ circumstances.

For example, almost a quarter of pupils attending state comprehensives with the most deprived intakes did not have access to a suitable device for joining remote classes in the first lockdown. This figure was under 2% for pupils at independent schools.

Similarly, 13% of those at state comprehensive schools reported issues due to having to share devices needed to take part in online learning. Only 4% at independent schools faced the same issue.

Catch up

Given these inequalities, it is unsurprising that young people at state schools were more likely to think that their progress has suffered because of the Covid-19 disruption. In state schools, 81% of pupils reported this, compared with 72% at private schools. To address this, a much larger effort to support young people in state schools to catch up is needed.

This is especially important as the gap in disruption to learning did not stop with the resumption of in-person schooling. For example, teacher absence has taken a larger toll on state schools in the post-restrictions period of the pandemic.

Staff absence rates due to Covid-19 infections in state schools have been higher than private schools. In a snapshot survey in early 2022, 20% of state school teachers reported that at least one in ten staff in their school were absent. Only 12% of private school staff reported the same (Sutton Trust, 2022).

What have we learned about differences in catch-up activities between state and private schools? Evidence from the COSMO study finds that 53% of young people took part in at least one type of catch-up activity.

This figure was 54% for young people in state comprehensive schools, and slightly lower at 51% for those in independent schools. So, there is some evidence of differential catch up weighted towards the state sector, but it is not large. The definition of catch-up activities is wide, from extra online classes to one-to-one tuition. The latter of these is most likely to have had significant catch-up benefits (Burgess, 2020).

Focusing on the offer of tutoring, this was more likely for young people at independent schools (52% compared with 41% in state comprehensive schools). This is despite the government’s flagship National Tutoring Programme (NTP).

The NTP was meant to target this sort of provision to pupils who needed it most. Unfortunately, its reach was narrower than hoped, with an official evaluation report highlighting that ‘only around a half of school leads and staff felt that all or most of the pupils selected were disadvantaged’ (Lord et al., 2022).

That said, pupils in independent schools were less likely to have taken part in tutoring than those in state schools. Among independent school pupils, 23% said they had taken up this offer, compared with 27% in comprehensive schools. This seems to reflect pupils in private schools being less likely to feel that they needed this help, even if it was being offered. An equally important aspect of pupils’ ability to re-engage fully in their education is their mental health. Pupils attending private schools were more than twice as likely to report that their school mental health support was very good (26%) than state school pupils (10%) (Holt-White et al., 2022)

Figure 2: Whether participant agreed they had caught up with lost learning during the pandemic, by gender and school type

Source: COSMO Notes: N=12,149; analysis is weighted for survey design and young person non-response.

Despite catch-up efforts, pupils at state comprehensive schools were the least likely to think they had been able to catch up (34%). This compared with 58% of pupils at independent schools who felt this way. Almost half (46%) of pupils at comprehensive schools said they had not been able to catch up, while just over a quarter (27%) at independent schools felt the same.

Assessment during Covid-19

Because of the disruption to schooling, the government decided to replace GCSE and A-level exams with teacher assessed grades in 2020 (and centre assessed grades in 2021). Some adaptation was unavoidable, given the Covid-19 restrictions. But many highlighted the importance of retaining externally set and marked assessment (Anders et al., 2021).

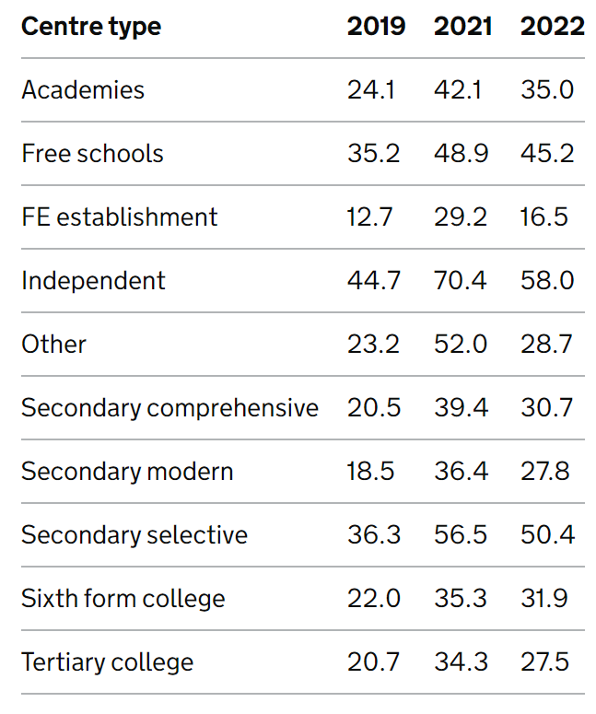
Indeed, there is evidence of biases in teacher assessed grades that affect ethnic minority groups, those from lower income backgrounds, boys and those with special educational needs (Burgess and Greaves, 2013; Campbell, 2015). Top grades awarded in the two years in which teacher or centre assessed grades were used jumped up compared with the years before.

But the increase was most prevalent in private schools (Anders and Macmillan, 2022). The proportion of A grades awarded at A-level rose from 44.7% in 2019 to 70.4% in private schools in 2021 (compared with a rise from 24.1% to 42.1% in state academy schools).

Some of this could have been due to the differences in provision highlighted above. Yet, the particularly dramatic fall in grades for private schools in 2022 – a cohort that had more of their education disrupted – casts doubt on this.

We can also use findings from the COSMO study to understand differences in assessment practices between the sectors. Pupils in this cohort received teacher assessed grades for their GCSEs in 2021.

Private school pupils were more likely to say that their teacher assessed grades were better than expected than state school pupils. Likewise, they were much less likely to report that they did worse than expected. As with the changes in grades over time, this suggests a more generous approach to teacher assessed grades in private schools.

Whatever the exact mechanisms, these results represent a significant widening of the qualifications gap between state and private school pupils. This will have had – and will continue to have – significant implications for pupils’ future educational and employment trajectories.

Conclusion

Taken together, we can see that there are a range of ways in which disruption as a result of the pandemic has laid the groundwork for increased inequalities between pupils who attended state and private schools throughout their lives.

Existing gaps have been reinforced by differences in schools’ capacity to implement quick and effective responses at the outbreak of the pandemic.

It seems unlikely that these inequalities have been fully addressed with the fairly small differences in catch-up offerings – pupils themselves reinforce this view. And the use of teacher assessment in the place of usual exams appears to have baked in the results.

We will not know the full extent of the implications of this disruption for years to come. The COSMO study is designed to try to help us to do exactly that.

Some of the differences may unwind. For example, if some pupils’ grades were flattered more by teacher assessment than others, we would not expect this in itself to result in long-term productivity gains and hence to affect individuals’ wages (Wyness et al., 2021). Nevertheless, the knock-on effects (for example, access to university) may still reinforce the educational gap.

Ultimately, the early signs are not promising for inequalities in life chances between state and privately educated pupils as a result of the pandemic. We must not forget about the young people who have been disproportionately affected during this time.

As the pandemic subsides, it is easy to focus on ‘getting back to normal’, but in reality, extraordinary efforts are still needed to try to address these inequalities.

While important in itself, ensuring everyone is given the opportunity to achieve their potential in life is vital to the country’s productivity and, hence, everyone’s future economic prosperity.

This article was first published on the Economics Observatory on 5 December 2022.

How might teacher shortages be reduced?

By Blog Editor, on 1 December 2022

By Asma Benhenda

Shortages of school teachers – caused by a long-term decline in the competitiveness of their pay as well as challenging working conditions – are a global concern. Effective policy interventions could include targeted pay supplements and encouraging more supportive leadership practices in education.

Teacher shortages are one of the main challenges faced by education systems in most developed countries, including the UK. They stem from a combination of recruitment and retention issues. Specifically, there are not enough teaching candidates and many trained teachers leave the profession.

Policy-makers can increase the attractiveness of the profession by addressing the root causes of staff shortages: low pay and challenging working conditions. These factors are even more critical today, particularly in the context of high inflation rates and pandemic-induced learning losses among school-age children.

How does England compare to other countries?

Teacher shortage is a major issue affecting many developed countries. On average, more than a quarter of pupils across OECD countries are enrolled in schools whose leaders have reported that learning is hindered by a lack of teaching staff. In England, this figure is slightly above the OECD average, at 28.1% (OECD, 2018a).

The lack of teachers is also affecting ratios of staff to pupils. In England, pupil numbers in 2019 were more or less the same as in 2007, but teacher numbers had fallen by 7%, according to the Education Policy Institute (EPI).

This trend has emerged as a result of difficulties in both recruiting and retaining teachers. First, there are not enough teaching candidates. In England, the government regularly misses its recruitment targets, especially at secondary school level, and in sciences and languages.

Subjects that did not meet recruitment targets in 2020/21 included physics (only 45% of the target was reached), modern foreign languages (72%), design and technology (75%), chemistry (80%) and maths (84%) (Department for Education, DfE, 2022).

Second, many teachers are leaving the profession. England also suffers from high teacher attrition rates: 22% of teachers aged 50 or younger want to leave teaching within the next five years. This is above the OECD average of 15% (OECD, 2018a).

Teacher attrition in England is getting worse over time. Nearly three-quarters (74%) of teachers who qualified in 2010 were still teaching four years later. This has declined to about 70% among those who qualified in 2014.

Further, teachers are also much more likely to leave the profession in their first few years of teaching. According to the EPI, a fifth of teachers exit after their first two years, while 40% leave after five years (EPI, 2020).

Teacher attrition and turnover are particularly problematic in schools in more disadvantaged areas, which have a harder time both recruiting and retaining teachers. In England, 22% of schools in the most affluent areas report vacancies or temporarily filled positions. This increases to around 29% of schools in the most disadvantaged areas outside London and 46% in the most disadvantaged areas within London (EPI, 2020).

Similarly, the share of experienced teachers is seven percentage points lower in socio-economically disadvantaged schools than in advantaged schools. This gap is more than twice the OECD average (OECD, 2018b). The unequal exposure to experienced teaching staff contributes further to persistent educational inequalities (Gershenson, 2021).

How has Covid-19 affected teacher shortages?

Teacher applications in the UK increased temporarily during the pandemic. Compared with 2019, postgraduate initial teacher training applications were 17% higher in 2020 and 11% higher in 2021.

This allowed the DfE to reach its recruitment target in secondary schools for the first time since 2011/12, although recruitment targets were still missed in maths and sciences (National Foundation for Educational Research, NFER, 2022).

As a largely public sector job, teaching was relatively sheltered from the economic shock of the pandemic and therefore temporarily more attractive (Benhenda, 2020).

But the pandemic boost in teacher recruitment was short-lived and is unlikely to compensate for years of under-recruitment (House of Commons, 2021). Indeed, teacher recruitment is now below pre-pandemic levels, as the wider labour market rebounds.

Teacher applications are expected to be 15% lower in 2022 than in 2019 (Worth, 2022). This trend is likely to persist. Teachers are experiencing, on average, real terms salary cuts of 5% as the government’s proposals for teacher pay in 2022 and 2023 are likely to deliver salary rises well below expected inflation (Sibieta, 2022).

Even more worrying are the early signs of a post-pandemic rise in teacher attrition. Teachers’ intentions to leave the profession have increased because they feel that their working conditions have deteriorated considerably (EPI, 2021).

We do not have conclusive data on this trend in England yet, but evidence from the United States shows a 20% increase in attrition rates post-pandemic (Goldhaber and Theobald, 2022).

What policies might be effective at reducing teacher shortages?

Teacher shortages will remain a major policy challenge while the root causes – the long-run decline in pay competitiveness and difficult working conditions – are not properly addressed (Garcia and Weiss, 2020).

Teacher pay

Teachers are paid less than their non-teacher university-educated counterparts. They face this pay penalty in most developed countries.

For example, in the United States, the average weekly wages of teachers are 32.9% lower than those of other college graduates. After adjusting for age, formal education level, marital status, race/ethnicity and state of residence, the teacher wage penalty is estimated to be 23.5%. This has been on a worsening trajectory since the mid-1990s when it was only 6.1% (Allegretto, 2022).

In England, the teacher pay penalty is lower but still significant. Teachers in England are paid, on average, around 10% lower than the average tertiary (university or college) educated worker (OECD, 2021).

These averages hide large differences by teaching subject. Most of the teacher wage penalty is borne by maths and science graduates as some non-science graduates – such as art graduates – benefit from a pay premium when they choose a career in teaching (Allen et al, 2018).

This is correlated with higher attrition rates among maths and science teachers. The odds of newly qualified teachers leaving the profession are 20% higher for science teachers than for non-science teachers (Allen and Sims, 2017).

The government has put in place teacher retention payments for maths and physics teachers to address this issue. In 2019 and 2020, early-career maths and physics teachers in disadvantaged areas in England received an 8% wage bonus.

Research shows that eligible teachers are 23% less likely to leave teaching in state-funded schools in years when they were eligible for this payment. A 1% increase in teacher pay reduces the risk of them leaving the profession by 3% (what is known as a pay elasticity of exit of -3).

This is similar to results from evaluations of comparable policies in the United States. It suggests that persistent shortages of maths and science teachers can be reduced through targeted pay supplement policies (Sims and Benhenda, 2022).

Teachers’ working conditions

Teachers in England report one of the lowest levels of job satisfaction among OECD countries. These levels have been declining over time. For example, in 2018, fewer lower-secondary teachers in England believed that the advantages of being a teacher outweigh the disadvantages compared with five years previously: 83% versus 72%, respectively.

Similarly, the proportion reporting that they would still choose to work as a teacher if they were to make their career choice again is also declining (80% in 2013 versus 69% in 2018) (Jerrim, 2019).

Figure 1: Changes in job satisfaction among lower-secondary school teachers in England

Source: Jerrim, 2019
Note: Bars refer to the percentage of teachers who agree or strongly agree with each statement.

Job satisfaction among teachers hit a new low during the pandemic because of increasingly challenging working conditions (DfE, 2022). These were partly due to the impact of school closures on pupils’ learning and development, especially in disadvantaged schools (Blanden et al, 2021).

Evidence on the effects of these non-financial dimensions of teaching on retention is less developed than evidence on financial incentives.

Nevertheless, research suggests that one important influence on teachers’ decisions to leave the profession is the quality of working conditions in their school. More specifically, supportive leadership is one of the factors that is most strongly associated with teacher retention (Sims and Jerrim, 2020).

Teachers identify the quality of administrative support as a key factor in decisions to leave a school. In addition, they point to the importance of school culture and collegial relationships, time for collaboration and decision-making input. These are all areas in which head-teachers play a central role (Trickle et al, 2011).

More evidence is needed on what makes a good head-teacher and how to improve head-teacher quality, as well as selection and training policies. Further research is also needed on retention policies as England suffers from a long-term trend of head-teachers leaving the profession because of the pressures of their job (Zuccollo, 2022).

Conclusion

Low pay and challenging working conditions are the root causes of teacher shortages in England, as well as in many other developed countries. The pandemic and lack of public investment in education have exacerbated this problem over the last few years.

Recent evidence shows that persistent shortages can be reduced through targeted pay supplement policies, as teacher retention is very sensitive to pay. Supportive leadership is another factor strongly associated with teacher retention. More evidence is needed on what makes a good head-teacher and how to improve head-teacher quality, as well as selection and training policies.

This article was first published on the Economics Observatory on 30 November 2022.

Understanding young people’s unequal experience of the pandemic: now and into the future

By Blog Editor, on 13 October 2022

Jake Anders is the Principal Investigator of the COVID Social Mobility & Opportunities study (COSMO), and Associate Professor and Deputy Director of the UCL Centre for Education Policy & Equalising Opportunities (CEPEO)

Today marks an important landmark in the COVID Social Mobility & Opportunities study (COSMO) and, with it, our understanding of the unequal impacts of the COVID-19 pandemic on young people’s life chances. After more than 18 months of development and fieldwork, we are releasing initial findings and data from the first wave of this planned cohort study.

Unlike much other research from the pandemic, COSMO comes as close as possible to recruiting a representative group of young people from across the country. This is because it is based on invitations to a random sample of all young people in schools across England, rather than a convenient sample collected for some other purpose who are not, therefore, necessarily similar to the population of young people as a whole. Why does this matter? Having a representative sample gives us increased confidence that our findings paint an accurate picture of the extent and variation in the experiences of this group.

As a result, we are extremely grateful to the more than 13,000 young people across England who responded to our invitation to take part in this study, providing us with details of their experiences to help us build up a picture of the lives of this generation and how it has been disrupted. Through this, COSMO is providing vital new evidence on the effects of the pandemic on the lives of young people, with strong signs that it has severely widened existing educational inequalities: 80% of participants told us their academic progress suffered because of the pandemic’s disruption — a figure that is even higher among those from less advantaged backgrounds. Moreover, there are worrying signs that initial impacts have not been fully addressed by the policy response in this country: only about a third of young people told us they have been able to catch up with their lost learning.

Participants’ views on whether their academic progress has suffered

We are documenting aspects of young people’s experiences during and beyond the pandemic in a series of briefing notes authored by members of the COSMO research team, with the first three of these on ‘lockdown learning’, ‘education recovery and catch up’, and ‘future plans and aspirations’ released today and more to come. These shine a light on important details of young people’s experiences.

Changes to educational plans by COVID-19 status

They highlight, for example, that well over half of young people report some change to their education and career plans because of the pandemic, and that this is particularly the case among those who report more acute direct experiences of COVID-19 itself, raising important questions about the consequences of such shifts if they are realised in the years to come.

They also increase our understanding of barriers to learning in lockdown, helping us to break down the factors that seemed to limit home learning, notably the lack of suitable electronic devices to engage in remote lessons or other online educational activities — this is particularly concerning given that over half of those who lacked such a suitable device told us this need had still not been met at the end of the second period of national school closures.

The extremely rich data from COSMO covering the circumstances and experiences of this representative sample of young people, are now available for other researchers to use to address other vital research questions. COSMO is not just a standalone effort to set out the findings as we see them, but also a resource to support others carrying out research to understand this generation.

But, importantly, COSMO’s ability to tell us about these short-term effects is just the start. COSMO is designed as a cohort study, which means that we aim to continue following the lives of its members over the coming years. Just as we are publishing findings from our first survey, we are just getting started in the process of inviting members of the cohort to take part in the first follow-up. Establishing this link through time will be vital to understanding whether conditions during the pandemic have lasting consequences for decisions that young people make about their wellbeing, education, careers and more. Cohort studies for previous generations, such as the British Cohort Study that continues to follow a group of people born in 1970, have been vital to illuminating our understanding of social mobility in society – extending such understanding to the current generation with their unique experiences completing their education will only become more vital.

Whether or not we think of the pandemic as over, its effects will continue to cast a long shadow, and COSMO will continue to help us to understand this in the years to come.

Turbulence on the glide path: A-level results 2022

By Blog Editor, on 18 August 2022

Jake Anders and Lindsey Macmillan

This year sees A-level (or equivalent) results for the cohort of pupils who were on the cusp of sitting their GCSEs in 2020 when exams were first cancelled due to the Covid-19 pandemic. Now exams are back, much to the dismay of many who believe that teacher-assessed grades should become the new norm. Here at CEPEO, we’ve regularly made the case for externally set and externally marked exams, based on academic evidence that teacher assessment leads to biases against certain groups. But what has the return of exams meant for results?

The implementation of a “glide path” has been successful – generally speaking, the results are pretty much halfway between those from 2019 and 2021. While the headlines are all focused on grades being down on last year, they are, if anything, slightly more generous than might have been predicted given the intention to deal with half of the grade inflation from teacher assessment seen in 2020 and 2021. This will be driven by the fact that these weren’t strictly exams in the 2019 sense – leniency in marking was encouraged and pupils had extra information in advance of exams, which may also have had other consequences that we’ll come back to shortly.

They don’t mean that learning loss for these students is no longer a problem – since the overall level of grades was decided by that “glide path”. As such, we do not know if this group of students would have achieved as good grades as their peers in 2019 despite the disruption. This is particularly the case given some remaining incomparability with 2019 around leniency in marking and advance notice of exam content. Ongoing concerns about learning loss, its consequences, and support for catching up need to be informed by other evidence, not allayed by these results.

Regional differences present a worrying picture for inequalities – the gap in the proportion of pupils achieving A or above at A level has increased between regions, from 7.3ppts in 2019 to 8.2ppts in 2022. So, London and the South East are continuing to pull away from other areas while the North East and Yorkshire and the Humber are particularly being left behind. This trend of Southern regions pulling ahead was also evident in the Key Stage 2 data released last month, and will provide a big headache for a government that has put ‘levelling up’ at the heart of what they plan to achieve.

Distribution of grades in 2019 and 2022 by English region

Source: JCQ

A mixed picture across centre type – FE colleges and independent schools have seen the biggest absolute declines in the proportion of A-levels awarded A or above. For independent schools, this is not altogether surprising given their huge grade inflation from 2019 to 2021, which saw a massive 25.7ppt increase in the proportion of pupils achieving A or above over the period, and over 70% of all private school pupils awarded an A or above in 2021. This number has returned to a more ‘reasonable’ 58% for 2022. Two points to make here: First, this highlights the extent of grade inflation in this type of centre during the period of teacher assessment. Second, this is still an extremely high proportion of pupils achieving a grade A or above, which could be indicative of private school pupils being better placed to make use of the additional information on exam content made available in advance this year, as well as the advantages that private school pupils had in terms of relative learning loss during the pandemic.

FE colleges are far more puzzling – they have seen a similar absolute decline in the proportion achieving A or above, but from a much lower base. They saw a 16.5ppt rise in pupils achieving A or above from 2019 to 2021, only 29.2% reached this level of achievement by 2021. This has fallen back down to 16.5% in 2022. Somewhat speculatively, it seems plausible that students in FE colleges were, in contrast to those at independent schools, particularly badly affected by the disruption wrought by COVID-19.

Percentage of A-levels awarded A*/A by centre type in 2019, 2021 and 2022

Source: https://www.gov.uk/government/news/guide-to-as-and-a-level-results-in-england-summer-2022

Grammar schools, on the other hand, have found themselves performing at a level that is almost comparable with that seen in 2021, despite the different type of assessment, and 14.1ppts higher than 2019. One explanation for this could be, like private schools, that grammar school teachers and pupils were better placed to use the additional information released in advance of exams this year, focusing on a far narrower set of curricula. Additionally, this may be the first indication (through exam results at least) that pupils from more advantaged backgrounds were less constrained by learning loss during the pandemic.

In many ways, these results have not told us much we did not already know – it was already pretty clear that independent school grades, especially, were artificially inflated by teacher assessment, although the percentage coming back down now challenges those who told a tale of Covid learning loss advantages last year. We already knew that the impacts of COVID-19 disruption were likely to be unequal. And we already knew that this was going to be an extremely tough transition for those young people in the middle of it, rightly proud of what they have achieved through difficult circumstances, but unsure of what it all means compared to their peers one year above or below them.

Skills are crucial to boosting productivity – but they cannot do the job alone

By Blog Editor, on 25 May 2022

Arun Advani and Claire Crawford

Today marks the launch of the Department for Education’s new Unit for Future Skills (UFS). Its remit is to use existing data – and champion the creation of new data – to better understand the skills businesses want and whether the education and training system is delivering them.

A focus of the UFS is to improve understanding of ‘skills mismatches’ – the gaps between the demand for and supply of different skills. The idea is that by learning more about skills mismatches and, crucially, their sources, we can design more effective policies to close these gaps, and hence raise productivity.

The UFS was the brainchild of the current Secretary of State for Education, Nadhim Zahawi. Its origins, though, lie at least in part in the Skills and Productivity Board (SPB), set up by the former Secretary of State for Education, Gavin Williamson, to investigate both skills mismatches and how skills contribute to productivity. The SPB comes to an end as the UFS launches.

This apparent change in remit between the UFS and its predecessor is an important one. While the focus of the new unit on collating and sharing data is undoubtedly welcome, the loss of the explicit link to productivity risks losing the ‘bigger picture’ rationale for such a unit.

Part of our work on the SPB – on which we sat alongside four other academic experts – was to provide some initial insights into the skills which seemed to have significant mismatches between demand and supply, or for which demand was likely to grow over time.

Unfortunately, the data at our disposal were not well suited to identifying skills mismatches, and we made a series of recommendations to the Secretary of State about the ways in which the UFS could improve upon this. For example, information about the demand for skills is collected either using relatively small-scale national surveys or in different ways across different local areas, for example as part of the new Local Skills Information Plans, making granular information that is comparable across areas difficult to obtain. Instead, we had to infer the demand for skills by combining information on the number of jobs in different occupations in the economy with the importance of each skill in those occupations.

The difficulties in identifying the supply of skills were even greater: while the Longitudinal Education Outcomes (LEO) data provides excellent information about the qualifications of younger cohorts in England, there is no straightforward way of identifying which skills – rather than knowledge – different qualifications develop, and no way to reflect the skills that workers acquire – or indeed lose – through on-the-job training rather than in formal education.

Despite these challenges, our analysis highlighted some skills which seemed to be particularly important and potentially worthy of further investment by the government:

  • We identified a set of ‘core transferable skills’ that are important across a large number of jobs in the economy now, and are expected to remain so in future. These skills included communication skills, people skills and ‘information skills’ – including decision-making, problem solving and critical thinking. Ensuring people have these skills means they should be equipped to perform a range of jobs well, and should also help them to transfer between jobs as needed.
  • We also identified a set of skills that, despite being important for only a small number of jobs, seem to be in shortage now, and are valuable in occupations that contribute disproportionately to productivity. These include Science, Technology, Engineering and Maths (STEM) knowledge and the application of this knowledge, including scientific and mathematical reasoning.

The appropriate policy responses to these findings are not straightforward. While encouraging more people to study STEM subjects may be sensible for many reasons, it may not help fill STEM job vacancies: not if the main challenge is that these occupations pay a lot less – or have other less attractive job characteristics – than occupations in which those skills can be equally effectively applied and are rewarded more highly.

In bringing together richer skills and labour market data, the work of the UFS should enable us to better understand these issues and support the development of policies to eliminate these gaps. But an important question is how far eliminating skills mismatches – and indeed increasing skills more generally – can get us in terms of boosting productivity, especially in ‘left behind’ areas.

One potential risk of relying heavily on skills investments as a route to ‘levelling up’ is that higher skilled or more educated individuals may move away, meaning the areas in which the investments are made do not benefit fully from those investments. We already know this is the case for many graduates.

But our work suggests that, unlike graduates, those with lower level qualifications are highly likely to remain in or close to the areas in which they grew up. While around half of both graduates and non-graduates have moved at least locally by age 27, only one in six non-graduates moves to a different commuting area, compared to a one in three graduates. Amongst those who move, a majority of non-graduates move less than 5km, compared to more than 20km for graduates. This suggests that poorer performing areas would benefit from investments in skills, at least up to degree level.

Our work also suggests that while a substantial proportion (two-thirds) of the difference in wages (a proxy for productivity) across areas can be explained by the qualifications and skills of the individuals living in those areas, a significant minority (one-third) cannot. This highlights that investments in human capital (skills) on their own will not be enough to ‘level up’. Such investments will need to be supplemented with investments in other types of capital – the type and extent of which will differ from place to place – to ensure that the benefits of investments in education and skills can be fully realised.

Better data will help shed light on the extent of and reasons for skills mismatches, and hopefully lead to policies aimed at addressing these mismatches. However, reducing mismatches alone is unlikely to be sufficient to deliver the necessary boost to productivity if we are to eliminate differences across areas, or between the UK and its international competitors.

Without greater demand for skills, particularly in poorer performing areas of the country, we risk levelling down rather than levelling up. It is crucial that the UFS works closely with colleagues across government and in local areas to ensure that they support the ‘productivity’ as well as the ‘skills’ part of the board they are replacing.