By IOE Editor, on 2 February 2020

Welcome to the UCL Centre for Education Policy and Equalising Opportunities (CEPEO) blog. This blog is a forum for CEPEO members, affiliates, alumni and guests to write about research on our four research themes.
Our Research Themes
CEPEO concentrates on four research themes, each underpinned by the aim to improve the education system and equalise opportunities for all. These are:
We also recently published our evidence-based Policy Priorities, and have been blogging about each of these. You can see all of the posts about this topic here.
By Blog Editor, on 4 December 2025
John Jerrim
When researchers finally gain access to a new dataset, the temptation is always the same: dive straight in. Who wants to spend hours wading through technical documentation when you could be plotting trends, running regressions, or uncovering surprising patterns? But sometimes, hidden in the fine print, lies a small detail that can upend the entire analysis.
This blog tells the story of exactly such a detail.
In a recent CEPEO working paper I discuss a subtle change in wording to one of the survey questions in PISA.
This one little change made in just one cycle, in just a subset of countries, has big implications for anyone using PISA to understand unexcused absences from school.
And it’s a reminder of the oldest rule in data analysis: always read the documentation carefully!
The question that quietly changed
PISA asks 15-year-olds a set of background questions, including one that seems straightforward:
“In the last two full weeks of school, how often: I skipped a whole school day.”
But in 2015, some countries quietly changed one word. Students in England, Wales, Northern Ireland, the United States and a few others were instead asked:
“… I missed a whole school day.”
The operative word in these statements are clearly very important.
“Skipped” implies truancy—an unexcused, intentional absence. “Missed” can include any absence—dentist appointment, illness, family reasons.
This is a crucial difference. Yet the international PISA documentation states that the wording was identical across all countries and cycles. The change only appears in the national questionnaires, which many researchers never check.
How one word reshaped a trend
Consider the United States and Australia, shown in Figure 1. Australia shows a clear post-pandemic jump in truancy in PISA 2022. The U.S., however, shows a zig-zag: a rise in 2015, a fall in 2018, then another rise in 2022.
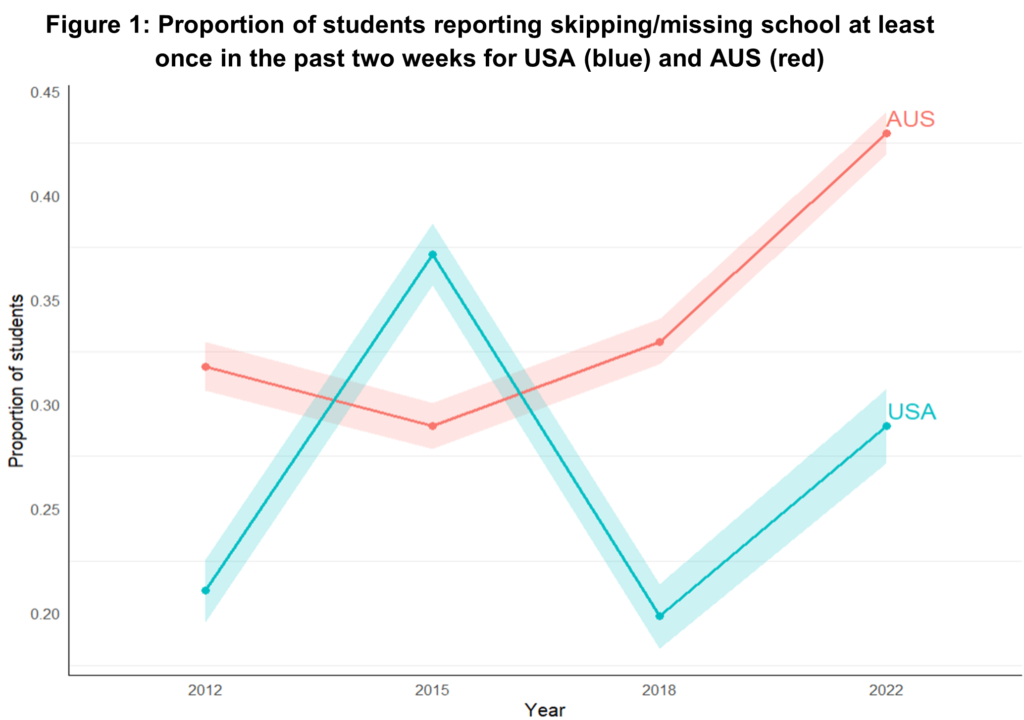
If taken at face value, the unexcused absence rate in the USA in 2022 doesn’t look particularly unusual— it’s actually somewhat below the rate in 2015.
But what is behind that spike in 2015? Rather than being a genuine pattern, it’s an artifact of the survey question wording switching from skipped to missed.
Once the 2015 data are removed, the U.S. shows a large, clear increase in truancy after the pandemic—larger than Canada’s. The wording change hides what is actually a worrying post-pandemic increase in unexcused absences.
The same pattern appears in England, Wales and Northern Ireland. In every affected country, the 2015 numbers look artificially high, making real increases appear modest.
Another graph, same story
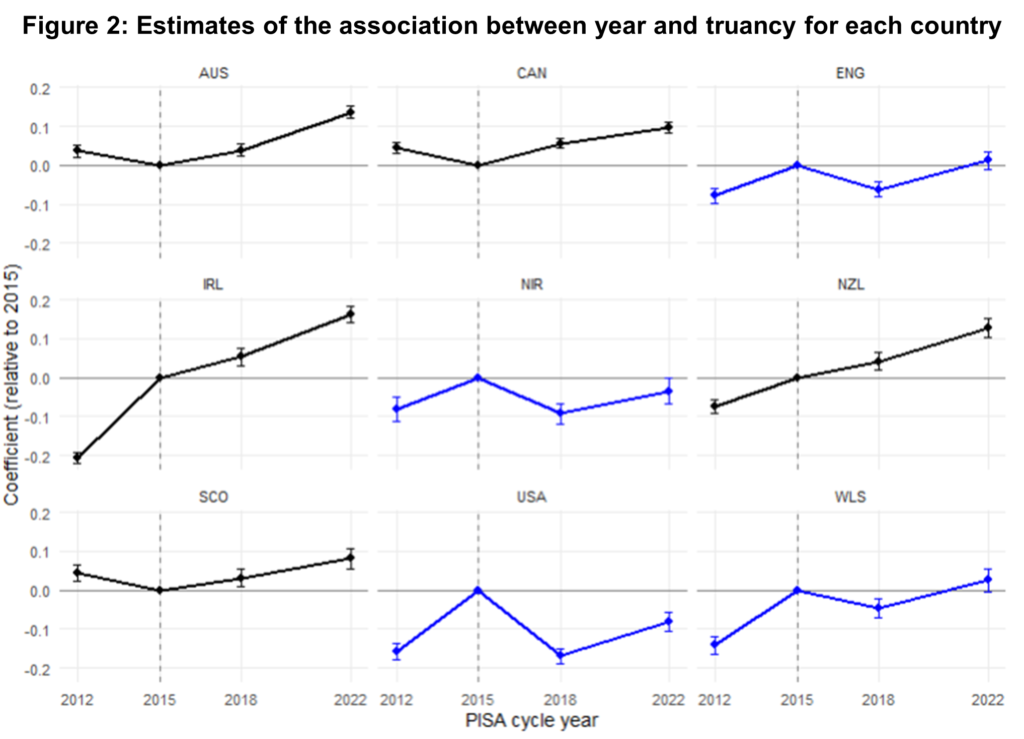
Figure 2 shows year-to-year changes with 2015 as the reference point. Countries shown in blue experienced the wording change; those in black did not.
In blue countries, 2015 is a major outlier—with numbers clearly inflated. In black countries, the time trend is smooth.
Again, the conclusion is unmistakable: 2015 breaks the series.
Could AI have caught the problem?
Given how subtle this issue is, could an AI assistant like ChatGPT help identify it?
Even when we used ChatGPT’s Deep Research model – and asked it explicitly about comparability issues in the truancy question – we were repeatedly reassured that:
“Each cycle asks exactly the same question… responses are directly comparable.”
And that:
“The wording and response scale have been unchanged.”
The advice from the AI was very clearly – and very overconfidently – incorrect.
Only after highly specific prompting did the AI vaguely suggest checking national questionnaires. But without already suspecting an issue, a researcher would not have been led to the key discovery.
This demonstrates an important point about AI in research: it can be helpful, but it cannot replace careful reading, expert knowledge and – crucially – gut instincts that something isn’t quite right.
Documentation matters
This blog has highlighted how a surprisingly big problem was caused by a surprisingly small change. One word shifted the meaning of a core variable and materially altered conclusions drawn from the PISA data.
And even the OECD’s own published reports appear to have missed the issue.
For those using and interpreting data, the lesson is clear:
- Always check data documentation carefully.
- AI is a tool to aid us – it does not speak with authority.
- Always interpret any strange blips or outlying data points with care.
As for PISA. Well, in my view, the OECD has big questions to answer as to why such strange changes were made, how on earth this got through their quality assurance processes, and whether similar gremlins could be lurking elsewhere in the PISA data.
This post originally appeared on the FFT Education Datalab blog.
By Blog Editor, on 2 December 2025
Laura Outhwaite
SEND system in crisis
The special educational needs and disabilities (SEND) system in England is in crisis.
Over 1.7 million children are identified as having SEND, a figure which continues to rise year-on-year. This poses significant challenges for educational outcomes and opportunities, as children with SEND have the largest attainment gap with their peers, compared to other pupil characteristics, such as eligibility for free school meals (FSM) and English as an Additional Language (EAL). Government budgets have also not kept pace with the rise in SEND identification, nor the costs associated with delivering support. This means that funding is being stretched across more children with additional needs.
Effective screening measures are a key component to solving this SEND crisis, as they can efficiently identify which children may need additional follow-up assessments, interventions and support. Research shows that early SEND support can improve outcomes for children and reduce longer term spending pressures. However, few studies have evaluated existing screening measures on a national scale.
The SEEN Study
Our new ESRC-funded study, SEEN: Screening Early for Educational Needs, will be the first national-scale evaluation of two universal screening measures that are widely used in early childhood, including for identifying later SEND. The two measures are:
1) The Early Years Foundation Stage Profile (EYFS-P), which is a statutory observational assessment completed by teachers with all 4-5-year-olds in England at the end of Reception.
2) An adapted version of the Vineland Adaptive Behaviour Scale, which is a questionnaire completed by parents when children are 3 years old in ‘Understanding Society’, a nationally representative dataset. This measure is conceptually similar to the Ages and Stages questionnaire completed by parents as part of the 2-2.5-year-old check implemented by health visitors.
The SEEN study will use data from two administrative datasets – the National Pupil Database (NPD) and E-CHILD, which links the NPD to health records – and survey data from Understanding Society to address two objectives.
Evaluate the early screening measures for identifying later SEND
First, our study will evaluate the extent to which children’s performance on these two early screening measures can predict later SEND, including for children from different ethnic, socio-economic status (SES), and EAL groups.
We will also be able to directly compare the validity of both screening measures and make recommendations for practitioners and policymakers about whether children’s SEND needs can (or cannot) be identified from an early age and, if so, how best to use them for this purpose.
Estimate future SEND demand
Next, we will estimate, of the children who recently started school, what proportion are at a heightened risk of later SEND based on their performance on these early screeners, existing chronic health conditions, and other demographic and health factors.
Using DfE guidance documents, complemented by interviews with school and LA leaders, our study will also estimate how much funding may be required to support these children as they progress through their educational careers, and how this compares to existing SEND budgets.
Benefits for children, families, practitioners and policymakers
The SEEN study will run until September 2027, led by Dr. Laura Outhwaite with Prof. Claire Crawford and Prof. Jo Van Herwegen. Over this time, we aim to generate evidence that not only informs policy but also empowers those working directly with children.
At its heart, the SEEN study is about creating a fairer start for disadvantaged children. It’s about ensuring that children’s needs are spotted early, support is in place when it matters most, and every child has the opportunity to reach their potential.
By Blog editor, on 26 November 2025
By Dr Claire Tyler, Prof Lindsey Macmillan & Padmini Iyer
In our latest blog, we’re delighted to be joined by Dr Padmini Iyer, Head of Research and Advocacy at social mobility charity Making The Leap to explore the similarities in the findings from our recent research on where inequalities arise in UK graduate recruitment processes.
Our recent UCL research about inequalities in access to professional jobs and Making The Leap’s recent research about what UK employers are doing to advance social mobility paint a consistent picture of employers prioritising outreach work over removing barriers for underrepresented groups during recruitment processes. Here we discuss our key findings and share some practical recommendations to support employers on their social mobility journey.
Still in first gear?
Access to good-quality employment is essential to achieving the financial security and job stability that supports social mobility. Making The Leap’s recent report ‘Still in First Gear?’ shows there is a good level of commitment to advancing social mobility among employers, in spite of challenges to diversity, equity and inclusion (DEI) in the UK in 2025. By investing in data, strategy and leadership, employers are increasingly building strong foundations for their social mobility work. However, Making The Leap’s findings indicate that employers’ social mobility work may still be in ‘first gear’, with most efforts focused on outreach and much less action to recruit individuals from less advantaged socio-economic backgrounds (LSEBs).
The research shows that 94% of employers’ social mobility work focuses on outreach, compared to only 53% on recruitment. What does this mean in practice? Employers’ outreach work aims to inform and inspire people from LSEBs to consider pathways they have not previously considered. Activities therefore include targeted work experience programmes, events to raise awareness about career pathways, and initiatives to develop young people’s employability skills. These are all valuable interventions – but they do not directly lead to young people from LSEBs getting jobs.
This where social mobility-focused recruitment activities come in: fair and inclusive recruitment processes, high-quality apprenticeships linked to permanent employment, and targeted employment programmes for LSEB individuals. However, with only 53% of employers taking action in these areas, there is clearly a disconnect between informing LSEB individuals about career opportunities, and actually hiring them. Moreover, as discussed below, many employers’ recruitment processes are more likely to reinforce socio-economic inequalities than to resolve them.
Adverse impact during recruitment process is a key barrier to equalising career opportunities
UCL’s recent research about ‘Inequalities in Access to Professional Occupations’ report, funded by the Nuffield Foundation, shows the potential consequence of a greater focus on outreach and a lesser focus on adverse impact during the recruitment process. The data shows that students from LSEBs and ethnic minorities are well represented in application pools for graduate roles, but are significantly less likely to receive job offers. For example, working class applicants are 32% less likely to receive a job offer than applicants from professional backgrounds. The penalty for Black applicants is 45% and for Asian applicants is 30%. Even when adjusting the findings to compare applicants who ‘look the same on paper’, including having similar educational credentials, large inequalities remain. This suggests that even if greater investment in outreach is effective for diversifying applicant pools, it is unlikely to solve persistent inequalities in who receives job offers. Efforts to ensure both a diverse applicant pool and hiring pool are required.
UCL findings (Figures 1 and 2) further show that while overall working-class inequalities occur relatively evenly across screening/testing and face to face stages of recruitment, the inequalities by ethnicity are much more pronounced at the screening/test stage, especially for applicants from Black, mixed and other ethnic backgrounds. For example, Black applicants face a 46% penalty at screening/testing and an 8% penalty at face to face stages compared to white applicants. A small proportion of these disadvantages can be explained by other demographic, educational and application characteristics. However, even when we compare candidates who ‘look the same on paper’, Black applicants still face an unexplained 37% penalty at screening/testing and a 5% penalty at face to face stages compared to otherwise similar white applicants. In comparison, working class applicants face an 18% penalty at screening/testing and a 14% penalty at face to face stages compared to applicants from a professional background – again, some of this can be explained by other demographic, educational and application characteristics, however an unexplained 9% penalty remains at each stage relative to otherwise similar applicants from a professional background.
Figure 1: Relative likelihood of passing (1) screening/testing stage and (2) face to face stages for the graduate programmes, conditional on observable differences across applicants, by parental occupation

Figure 2: Relative likelihood of passing (1) screening/testing stage and (2) face to face stages for the graduate programmes, conditional on observable differences across applicants, by ethnicity

How can employers move to ‘second gear’?
Making The Leap and UCL’s research identifies several areas of best practice to improve recruitment processes which will help employers move into second gear (and beyond!), including:
- Collect applicants’ demographic data during recruitment, including socio-economic background data. This will allow you to identify trends and understand whether specific groups are being adversely impacted at each of your assessment and recruitment stages, and in turn, to target your efforts to ensure fairer recruitment processes.
- Broaden the focus of diversity monitoring to include the screening and online testing stages of recruitment, in addition to any existing focus on face-to-face assessments. If testing is outsourced, employers can challenge external providers of recruitment assessments to provide data on success rates of candidates from under-represented groups for each type of test conducted.
- Consider introducing contextualised recruitment. This means that those making hiring decisions can evaluate a candidate’s potential and achievements by considering the personal, social, and educational circumstances in which they were gained. This data might include demographic data alongside other information such as type of school and university attended.
- Offer pre-assessment coaching and support. Anonymised, skills- or task-based assessments may be preferable to using minimum grade/qualification requirements during recruitment. However, as UCL’s research highlights, assessments can still disadvantage ethnic minority and LSEB candidates, so it is important to pilot and evaluate the diversity impact of any new assessments you introduce. You can then offer targeted, pre-assessment support to candidates from less advantaged backgrounds, as they may be less familiar and less confident with assessment tasks compared to their more advantaged peers. You can also work with universities’ and schools’ careers teams to share insights about which under-represented groups may need additional information or guidance to be prepared for online assessments.
What next, and how to get involved?
At Making The Leap, we are looking forward to two forthcoming publications. In January 2026, we will publish The Social Mobility List – a comprehensive overview of individuals, charities, and companies making significant strides to advance social mobility in the UK. And in spring 2026, we will publish a set of in-depth case studies exploring social mobility best practice among UK employers and educators. We are always open to partnerships to support employers’ social mobility journeys, from direct delivery with young people to research and advocacy work. Please do contact us (research@mtl.org.uk) for more details.
At UCL, we are launching a new project funded by the Nuffield Foundation aiming to shine a light on adverse impact during different stages of recruitment processes. We have built an ‘early careers data hub’ containing detailed anonymised data on over 2.5 million applicants (and growing!) to entry-level roles in over 20 large UK employers over several years – the largest research resource of its kind. Using this previously ‘untapped’ data, we will continue our investigation of the role of employers in the career outcomes of young people, specifically now focussing on the barriers faced by underrepresented groups in each type of assessment and selection method. This will provide an evidence base for employers, careers services and universities to drive change and target interventions and support more effectively. Please get in touch (c.tyler.14@ucl.ac.uk) if you would like to hear more about how to participate in our research collaborations. Projects are anonymous, free of charge and full of insights for participating employers.
By Blog editor, on 20 October 2025
By Dr Paul Martin
Starting in January, I will be leading a new research project funded by the Nuffield Foundation which will seek to understand the consequences of undertaking paid employment as a full-time student.
Alongside my colleague Professor Claire Crawford, we will investigate this issue by making use of the Department for Education’s Longitudinal Education Outcomes (LEO) dataset, which links together the education and employment records of millions of individuals in England. By using LEO we can paint the most comprehensive picture so far of student employment, supplementing the many survey-based research studies in this area.
There are several reasons why we might be concerned about the relationship between full-time study and paid employment (or perhaps the lack thereof). I will set the scene here by considering the three issues of too much employment, too little employment and employment as a driver of intergenerational inequalities.
- Are students undertaking too much paid employment?
In recent years, students have found themselves in the middle of a perfect storm when it comes to their personal finances. High levels of inflation have pushed up the cost of living, and levels of student financial support have not kept pace. Between 2022 and 2024, students in England had to contend with a 10% real terms cut in the value of maintenance loans, which tend to be one of their main sources of income. Alongside this, parental income thresholds which determine the level of support that students receive through their loans have remained frozen ever since the 2007/08 academic year – one of the most egregious of all examples of fiscal drag. Meanwhile, the ‘bank of Mum and Dad’ may not have been doling out cash with quite the same enthusiasm as in years gone by, as parents and carers themselves grapple with cost-of-living challenges.
This cocktail of different financial pressures has led to an increase in the amount of paid employment that students are undertaking. A recent survey of approximately 2,000 students found that around half of students say that they have financial difficulties and 30% of respondents said that they were increasing their working hours as a result of the rising cost of living. Similarly, recent polling has found that many students are prioritising paid work over lectures and seminars and, of those who say they plan to drop out of university, 82% say that this is either partly or entirely due to financial difficulties.
Whilst the timeframe of the data we will use in the project predates the recent cost of living crisis, we will establish in principle the extent to which certain patterns of paid employment may be associated with different negative outcomes for students, paving the way for similar analyses to be repeated with more recent cohorts of data as they become available.
- Are some students actually undertaking too little paid employment?
Whilst excessive work among students is clearly a concern, we will also seek to explore through this research what the optimal level of employment for students could be. There is every possibility that it may not be zero. Understanding what is optimal will go beyond consideration of just the quantity of employment to also consider the type (such as sector of work) and timing of employment during the year.
Even the most assiduous of undergraduate students, who diligently completes 100 hours of study for every 10 credit module that they take during their course, ought still to have a fair bit of spare time on their hands over the course of a full calendar year. A typical student’s 1,200 hour annual study workload still falls well short of the typical 1,700 hour annual workload which would be experienced by a full-time worker who takes off bank holidays plus an additional five weeks of annual leave. As well as additional income, suitable part-time employment can provide students with the opportunity to further develop their soft skills, build their CVs and feel a sense of purpose which supports with their mental wellbeing. Existing survey data suggests that over 40% of undergraduate students undertake no paid employment whatsoever, even outside of term time. Given that our current HE system has several lengthy periods of inactivity baked into students’ annual schedules by default, we should consider how we might best support students to make the most of their time across the whole calendar year.
- Do student employment inequalities hold back social mobility?
Ultimately, we hope that we can learn more in this project about the potential link between student employment behaviour and intergenerational inequalities. The link between socioeconomic background and the likelihood of accessing certain prestigious occupations is unquestionable, as illustrated by recent research showing the continued dominance of former private school students in the top professions. To what extent could this be driven partially by differential access to work experience opportunities during study? We will seek to identify particular career pathways where entry on to that pathway after graduation appears to be contingent upon gaining employment experience in that field whilst at university. For example, how many graduates working in fields such as finance, the law and the media have gained paid work experience in that field during their university years? Or to put it another way, just how difficult is it for a graduate to find a role in one of these competitive fields in the absence of any work experience?
Investigating the relationship between employment activity during study and access to competitive sectors after graduation is crucial if we want to better understand how to support more young people from disadvantaged backgrounds to use employment during study as a stepping stone to future career opportunities. We should also pay particular attention to the groups of students who appear to be consigned to long summers working in hospitality and retail positions in order to make ends meet, depriving them of the opportunity to get valuable experience (which may be unpaid) in their preferred industry.
By Blog Editor, on 9 October 2025
Laura Outhwaite and Claire Crawford
Early years is high on the policy agenda. The government has pledged that 75% of 4- to 5-year-olds will be “school ready” by 2028, and in July 2025 set out its strategy for giving children the best start in life, which the Education Select Committee is currently reviewing. But what does being “school ready” mean? How close are we to reaching that goal? And what action is needed to get there?
Measuring school readiness
School readiness is measured using the Early Years Foundation Stage Profile (EYFS-P). This is a statutory assessment of children’s development and learning completed by teachers at the end of the Reception year – typically the first year of school for most children – at age 4-5 years. A child is considered to have a good level of development if they meet or exceed expectations in all three of the prime areas of learning: “Personal, social and emotional development”, “Communication and language” and “Physical development”, as well as the two specific areas: “Literacy” and “Mathematics”.
National trends mask regional inequalities
In the latest data (2023-24), 67.7% of children reached a good level of development. This is a steady improvement from 65.2% in 2021-22 when the revised EYFS-P was introduced. But there is still a long way to go. According to the Department for Education’s (DfE) estimates, reaching the 75% target would mean raising the school readiness outcomes of an additional 40,000 to 45,000 children.
Behind the headline figures, there are stark geographic inequalities across the 153 local authorities (LAs) in England. The proportion of children reaching a good level of development ranges from 59.6% in Manchester to 84.2% in the City of London. Only four LAs currently exceed the 75% target: City of London, Isles of Scilly (both of which are the smallest LAs in terms of size and population), Richmond Upon Thames and Wokingham (both of which are among the least deprived LAs in England). Meanwhile, 34 LAs are 10 or more percentage points away from meeting the 75% target[1]; many of which are ranked amongst the most deprived LAs in England. Looking across all LAs, there is a strong relationship between the average Income Deprivation Affecting Children Index (IDACI) score in a LA – a measure of the proportion of families with children in an area who are claiming income support related benefits – and the percentage of children reaching a good level of development. On average, for every one-point increase in deprivation, the proportion of children achieving a good level of development in a LA fell by around 0.4 percentage points.
What action is needed to reach the school readiness goal?
So, what could and should the government do to increase the proportion of children who are school ready, particularly in disadvantaged areas?
Previous research has highlighted the importance of access to and participation in early education, particularly high-quality early education , and support for families as important drivers of children’s early outcomes. We therefore examined whether these factors were associated with area-level differences in the proportion of children reaching a good level of development, focusing particularly on the experiences of children aged 3-4, as it is children who are currently in this age group who will contribute to meeting the government’s school readiness target in 2028.
The quality of early years provision matters
The factor that came through most strongly in our analysis was the quality of early years provision. Our results showed that LAs with a higher proportion of children taking their 15-hour early education entitlement in a setting rated as Outstanding by Ofsted when they were 3-4 years old had significantly higher school readiness outcomes. This holds true over and above the deprivation level of the area. So, it is not just that more advantaged areas have more high-quality provision and more children who are likely to be school ready. This highlights the importance of quality in early education provision.
By contrast, greater childcare availability and higher take-up of the early education entitlements amongst 3–4-year-olds were not found to positively predict school readiness. This suggests that without access to high-quality provision, expanding access and encouraging take-up alone may not raise children’s outcomes sufficiently.
The number of Family Hubs in a local area was also not associated with higher school readiness. Although with most LAs having four or fewer hubs, and the focus in the period up to the 2023-24 EYFS-P assessments being on 0-19-olds, not 0-5-year-olds, as will be the case going forward, coverage for 3-4-year-olds may currently be too limited to make a detectable difference to outcomes at scale.
An explicit focus on Literacy, Mathematics and Communication and language
Alongside improving the overall quality of early years provision, there must also be an explicit focus on the domains where children are most likely to fall behind: Literacy, Mathematics, and Communication and language.
A good level of development requires children to meet expectations across all five areas of learning, yet outcomes vary considerably between domains. More than three‑quarters of children achieve the early learning goals in Personal, social and emotional development (82.8%), Communication and language (79.3%), Physical development (84.7%) and Mathematics (77.1%). Literacy stands out as the weakest area, with only 70% of children meeting expectations, and only 13 LAs in which more than 75% of children achieve the literacy-related early learning goals. The fact that these figures are all higher than the overall proportion of children reaching a good level of development (67.7%) – in some cases considerably so – suggests that some children are likely to be missing out on the good level of development benchmark by falling short in just one or two domains rather than across all domains, highlighting the importance of concentrated action in particular domains.
These findings suggest that achieving the government’s 75% school readiness target will require targeted national and local strategies that prioritise Literacy in particular, as well as Mathematics, and Communication and language. Directing resources, interventions, and support towards these domains, particularly in deprived areas, will be essential to ensure more children reach a good level of development.
Conclusion
Ensuring that 75% of children are school ready by 2028 is an ambitious but important goal. While national outcomes are improving, progress is uneven, and large gaps remain across areas in England. To close these early learning gaps, more targeted support is needed for children from economically disadvantaged backgrounds and in local areas with high levels of child-related deprivation. Our findings also highlight the importance of ensuring access to high-quality early education in a way that is not confined to already affluent areas, as well as ensuring an explicit focus on the domains where children are most likely to fall behind: Literacy, Mathematics, and Communication and language. Overall, closing the school readiness gap will demand more than incremental progress. It requires a deliberate focus on equity, quality, and targeted support where it is needed most.
[1] These LAs include Manchester, Salford, Halton, Middlesbrough, Bradford, Sandwell, Luton, Tameside, Liverpool, Rochdale, Peterborough, Sefton, Wolverhampton, Dudley, Leicester, Knowsley, Blackpool, Coventry, Nottingham, Oldham, Bolton, Stoke-on-Trent, Wigan, Rotherham, Blackburn with Darwen, Kingston upon Hull, Sheffield, North Lincolnshire, Lancashire, Derby, Westmorland and Furness, Leeds, Birmingham and Bury.
By Blog Editor, on 22 July 2025
By Claire Crawford
Last week the Department for Education published the first comprehensive statistics on the take-up of the new early education entitlements for 0-2-year-olds in working families. As of January 2025, around 42% of children in this age group were using at least some hours of government-funded early education, with take-up lowest amongst 9-11-month-olds (20%) and highest amongst 2-year-olds (55%). This may be good for the lives of these children and their families, but the working families entitlement is arguably not reaching those most in need of support. For the government to achieve its Plan for Change target of 75% of children being ‘school ready’ by age 5 by 2028, it may need to provide more support to children in non-working or very low income working families who are not eligible for the working families entitlement.
One programme that does benefit these relatively more disadvantaged children is an entitlement to 15 hours of government-funded early education per week for disadvantaged 2-year-olds – now rebranded the ‘Families Receiving Additional Support’ (FRAS) entitlement. But one of the concerns raised by us and other experts was that children eligible for the FRAS entitlement might miss out as a result of the expansion entitlements for working families. This could happen via a number of routes. Families could be confused by the strong messaging around the working families entitlement and mistakenly believe that they are not eligible for any government-funded early education. Higher demand for childcare places from families eligible for the working families entitlement could also have crowded out these children, whose families may be less likely to pay for additional hours.
The statistics published last week showed a substantial drop in the percentage of eligible 2-year-olds taking up the FRAS entitlement, falling from 75% in 2024 to 65% in 2025. But – and it is a big but – the Department urged caution in comparing the figures across these two years, as some children eligible for the FRAS entitlement are also eligible for the working families entitlement. Despite the statutory guidance provided to local authorities (LAs) that any children eligible for both should be recorded as being entitled for the FRAS entitlement rather than the working families entitlement, the Department had reason to believe that not all LAs had done this consistently.
What are the consequences of this uncertainty? It means we basically don’t know whether the fall in take-up means that some disadvantaged children have missed out. We don’t know how much action might be needed to correct for any fall. And if the working families entitlement was even partially responsible for this fall, then we might be especially concerned about will happen over the coming year, given that any negative effects may worsen once 0-2-year-olds in working families are entitled to double the number of hours as they are now (rising to 30 hours per week, from 15) in September.
So, with thanks to my colleague Oliver Cassagneau-Francis for assistance, we set out to see if we could work out whether there had been a genuine fall in take-up, or whether the fall was all down to misclassification. Using figures from the Institute for Fiscal Studies, around 18% of 2-year-olds eligible for the FRAS entitlement are also likely to be eligible for the working families entitlement (see below for all the gory details).
Using the estimated number of children eligible for the FRAS entitlement shared by DfE last week (just under 146,000), this would mean that just under 27,000 children were eligible for both entitlements this year. The actual fall in the number of children taking up the FRAS entitlement between 2024 and 2025 was just under 21,000 children. We can chalk up about a third of this to declining eligibility (see below). Of the remaining 14,000 children, how many are still using early education and how many are potentially missing out? Given that 27,000 children are potentially eligible for both entitlements, if just over half of these 27,000 children had been mis-recorded, that would be enough to explain the entire decline in take-up.
Is this plausible? It’s hard to know based on what the Department has said, but it’s certainly possible. So, is this the end of the story? Not quite. One of the great things DfE does when publishing these kinds of statistics is share the data underlying the headlines, including data at local authority level. We’ve used this data to good effect in previous research, funded by the Nuffield Foundation, to identify LAs who were ‘out-performing’ the characteristics of their local populations and achieving higher take-up rates than expected amongst disadvantaged 2-year-olds, to try to characterise the ingredients of their success. Here, we wanted to see how much the decline in take-up differed across LAs. Was it spread fairly evenly across the country, or was there variation? Was the extent of the decline correlated with any other characteristics of these LAs that might suggest a genuine fall rather than misclassification?
Perhaps an even more compelling part of the story is the correlation between the magnitude of these declines in take-up and LA characteristics. LAs that have experienced larger falls in take-up relative to what might have been expected tend to have higher female employment rates and lower unemployment rates, and to have a higher proportion of validated codes for the working families entitlement, perhaps indicating greater demand from children in these families and hence more competition for places. Moreover, these relationships hold over and above the size of the LA, so are not just driven by what’s happening in big cities.
While not conclusive, this suggests to us that the decline in take-up of the FRAS entitlement may not be all about misclassification. Yes, it is possible that misclassification could be higher in areas with these other characteristics, but is there a good reason to expect it to be so? A more plausible reason, based on our findings, could be that some disadvantaged children may be being squeezed out by higher demand for formal early education created by the working families entitlement. Given that take-up of the FRAS entitlement has never been higher than 75% and that there were large variations in take-up across LAs well before this latest round of data, we certainly wouldn’t want the government to bank on misclassification as the sole reason for the drop in take-up of the FRAS entitlement, particularly as they have the Plan for Change target to think about. We would love to see action being taken now to remove barriers to take-up, including but not limited to those relating to the working families entitlement. This will help to ensure that all disadvantaged 2-year-olds have the opportunity to take advantage of government-funded early education and contribute to the success of the government’s Best Start in Life strategy.
All the gory methodological details
We started from an article from the Institute for Fiscal Studies which tried to estimate the extent of overlap in eligibility between the two entitlements. Their figures suggested that around 18% of 2-year-olds eligible for the FRAS entitlement might also be eligible for the working families entitlement.
(Their Figure 1 shows that 21% of the poorest quintile (fifth) of working families are eligible for both the working families and FRAS entitlements, in addition to 8% of the second poorest quintile and 2% of the middle-income quintile. Given that 85% of families with 2-year-olds are working, this means that just over 5% (((0.21*0.2)+(0.08*0.2)+(0.02*0.2))*0.85=0.0527) of the cohort are estimated to be eligible for both entitlements. Meanwhile, just under 11% (((0.49*0.2)+(0.11*0.2)+(0.03*0.2))*0.85=0.1071) of the cohort from working families are eligible for the FRAS entitlement only, as well as just under 13% (85% of the 15%=0.1275) of the cohort from non-working families. Altogether, this means that almost 30% of families of 2-year-olds (0.0527+0.1071+0.1275=.2873) are estimated to be eligible for the FRAS entitlement and 5% are estimated to be eligible for both the FRAS entitlement and the working families entitlement, meaning that around 18% (0.0527/0.2873 = 0.183) of those eligible for the FRAS entitlement are potentially eligible for the working families entitlement.)
Using the estimated number of children eligible for the FRAS entitlement provided by DfE last week (145,824) – and assuming that the degree of overlap, which was estimated on slightly older cohorts, is still approximately correct – this would mean that 26,686 (0.183*145,824) children were eligible for both entitlements this year.
The actual fall in the number of children taking up (registered for) the FRAS entitlement between 2024 and 2025 was 20,821 (115,852-95,031) children. Some of this decline would have happened anyway, both because the birth rate is declining, and hence the population of 2-year-olds is falling over time, and because the proportion of 2-year-olds who are eligible for the FRAS entitlement is also falling. The decline in eligibility between 2024 and 2025 – which reflects both these elements – was just under 6% ((154,957-145,824))/154,957=0.059). If take-up (registration) had fallen in line with this decline in eligibility, then we might have expected 6,835 (0.059*115,852, which is the number of 2-year-olds registered for the FRAS entitlement in 2024) fewer 2-year-olds to be using government funded early education in 2025 than 2024, even if nothing else had changed.
If we subtract 6,835 from the observed decline of 20,821 children, that leaves 13,986 children. The question is: how likely is it that these children were still using early education and had merely been incorrectly classified as taking up the working families entitlement rather than the FRAS entitlement, and how many were genuinely missing, i.e. not taking up government-funded early education at all?
By Blog Editor, on 3 July 2025
Robbie Maris
In 2014, the government introduced the English and maths resit policy, known formally as “the condition of funding requirement”. The policy requires students to continue studying English and maths during their 16 to 19 upper-secondary education if they had not achieved a standard pass (grade 4 or above) in their GCSEs. This was, and is, a wide-reaching and well justified policy aimed at improving the life chances of all young people:
“Gaining level 2 skills in maths and English helps students realise their potential, and gives them the opportunity to progress in life, learning and work.” DfE (2025)
Hundreds of thousands of students have and continue to retake English and maths as part of the resit policy. Around a third of all 16-year-olds need to resit English or maths and many of these students come from disadvantaged backgrounds (free school meal – FSM – eligible over the previous six years). This makes the resit policy especially pertinent for the aim of improving social mobility and reducing educational inequalities. This is often one of the last chances within the formal education system for young people, disproportionately from disadvantaged backgrounds, to obtain vital literacy and numeracy skills.
However, the policy has been the subject of much debate and attention since it was introduced. It is currently a focal point in the ongoing Curriculum and Assessment Review . Yet, despite the widespread nature of the policy and the importance of literacy and numeracy for life chances, there has been relatively little work examining the drivers of success of resits themselves.
To fill this gap, colleagues at the Education Policy Institute and I, with support from Pearson, examined inequalities in resit performance and the drivers of resit success, in our report “English and Maths Resits: Drivers of Success”. We used a combination of quantitative and qualitative research, drawing on education administrative data and the findings from an expert roundtable made up of representatives from high-performing institutions, policymaking and industry bodies.
Significant attainment gaps across demographic characteristics
We found large achievement gaps in resits across gender, ethnicity and disadvantaged status (Figure 1). Disadvantaged students fall behind by a fifth of a grade in English and one eighth of a grade in maths compared with non-disadvantaged students. In terms of gender, female students achieve higher grades in English, whilst male students achieve higher grades in maths. After controlling for prior attainment and other characteristics, students with Special Education Needs and Disabilities (SEND) achieve similar grades to other students.
Figure 1. Relationship between demographic characteristics and resit attainment

Note: These results are from statistical models of resit students’ performance, where students’ best resit grade is predicted using their prior attainment, individual and institutional characteristics. We are presenting results for the 2021/22 cohort of resit students (who finished their 16 to 19 educations in 2023 or 2024) but the results look similar using earlier cohorts. Grades are equivalised using DfE’s point scores for English and maths progress.
Figure 2 shows that White British students have some of the lowest progress levels, along with those from Gypsy/Roma backgrounds (in English) and White and Black Caribbean students (in maths). Black – African students make the most progress in English resits whilst Indian students make the most progress in maths.
Figure 2. Relationship between ethnicity and resit attainment

Note: See Figure 1 note for further details on the modelling approach.
Prior attainment strongly predicts resit performance
We show that prior attainment in the subject being resat strongly predict resit outcomes, but so does performance in other Key Stage 4 GCSE subjects (Figure 3). For English, prior attainment across all other subjects is actually more predictive of resit performance than prior attainment in English. Conversely, in maths, prior attainment in maths is more predictive than prior performance in other subjects.
Despite the importance of prior attainment, evidence from top-performing institutions suggests that streaming students by grade is logistically complicated and, in some cases, had negative impacts on student engagement. One provider representative told us:
“Streaming – it was an absolute palaver. And actually, we didn’t get any improved outcomes from that.
It [streaming] just didn’t make enough of a difference for all of the rest of the palaver it caused us with attitudes, behaviours, attendance and all that sort of thing”
Figure 3. Relationship between prior attainment in English and wider KS4 subjects and resit outcomes

Note: See Figure 1 note for further details on the modelling approach.
Motivation, engagement and attendance are critical to resit outcomes
We find that unauthorised absences in year 11 have large negative associations with subsequent resit attainment (Figure 4), suggesting that the underlying drivers of absences pre-16 continue to be an issue post-16, with continued impacts on attainment. This reflects our discussion with providers, who suggest that student engagement and motivation is the pre-cursor to many attendance problems that colleges frequently face. The discussion covered the importance of putting a strong focus on building positive relationships between students and staff at the beginning of the resit journey.
Figure 4. Relationship between absences in year 11 and resit attainment during 16 to 19 education.

Note: See Figure 1 note for further details on the modelling approach.
Enrolling on a GCSEs after the transition to post-16 education results in better overall resit performance than enrolling on the alternatives
The resit policy allows students to be enrolled on a GCSE, level 2 functional skills qualification (FSQ) or a stepping stone qualification (usually a level 1 or entry level FSQ). Students who achieve a grade 3 (closest grade to the passing threshold) must study a GCSE. We find that students who initially enrol on a GCSE achieve better progress over their 16 to 19 study than students on level 2 Functional Skills Qualifications (FSQs) or stepping stone qualifications, by almost half a grade (Figure 5 – this is conditional on prior attainment). Whilst this finding may be due to selection effects (those more likely to perform well are more likely to take the GCSE), this also reflects the experience of providers. Evidence from top-performing providers suggests that GCSEs were preferred for their ability to demonstrate progress to students, as opposed to the binary pass or fail nature of FSQs. GCSEs were also preferred over FSQs for their reputation in the sector and recognition by a wide range of stakeholders.
Figure 5. Relationship between GCSE resit subject enrolment and resit grades (conditional on prior attainment)

Note: See Figure 1 note for further details on the modelling approach.
Resit students often have negative experiences with English and maths
Our discussions with top-performing providers suggested that many students enter 16 to 19 education feeling demotivated and bring negative experiences with English or maths or both. Staff are often dealing with anxiety, fear of failure and low levels of confidence and self-efficacy that stem from experiences in earlier schooling. There were suggestions that more needs to be done in schools to get these students into a more positive mindset for their 16 to 19 education. This includes getting students into a progress mindset, as one provider representative outlined:
“We really value and try to celebrate progress, but a lot of the challenge is the language that comes from school… they come to us with the belief that that nothing except a Grade 4 is acceptable.”
“I just feel like I’m banging my head against a bit of a brick wall with that because it’s built into their educational beliefs, so they believe they are consistently failing, even though we’re banging the drum of progress.”
A selective approach to November resit delivers better overall attainment
Providers can choose to enter students into the November (Winter) exam series immediately after they start their 16 to 19 education (this is in addition to, or instead of, entering students for the typical Summer exam series). Our findings show that while November resits can be beneficial for the individual level (Figure 6), they appear to harm overall resit attainment when institutions use them more liberally e.g. when all students are entered. That is, a provider that enters a greater proportion of students onto November resits (given a set of student characteristics) ends up with a lower average progress score, or around a quarter of a GCSE grade.
Figure 6. Relationship between individual November resits (left) and provider-wide proportion of students on November resits (right) and attainment

Note: See Figure 1 note for further details on the modelling approach.
This finding reflects our discussions with top-performing institutions, who were all selective in their use of November resits. A key challenge that was identified with November resits is the large drop in student engagement following the November resit cycle (see the quote from a college representative below).
“We have actually lower results in the summer following failure at November resits because they switch off, they think they’ve done, we lose all of that teaching time, which is the bulk of our teaching time, and it’s just caused too many problems.”
The North-West is the strongest performing region
There is a cluster of top-performing institutions in the North-West of England (Figure 7). In maths, students in the North West make 0.10 more grades progress than the average, whilst in English they make 0.11 more grades. The lowest performing region in English is the South West (0.10 grades less than average), and in maths it is Yorkshire and the Humber (0.06 grades less progress). There is clearly more that could be learned from the North West, who are the best performing region in both English and maths.
Figure 7. Average institutional value-added by region for English and maths.

Note: See Figure 1 note for further details on the modelling approach.
Staff strongly value networks which allow for knowledge sharing, but need more CPD for English
Evidence from our discussion with top-performing providers suggested resit teachers are often highly motivated and have a strong desire to learn and support their students in making progress with English and maths. They also strongly value networks where they can share best practice, build relationships and share their experiences. This quote is from a provider representative from the North West, the top-performing region:
“In [the North West] we’ve built a network … we’re probably about 15 colleges strong now where we regularly, and it really is quite regularly now, meet and it has been the best CPD for myself [sic] with other managers, but also for the staff too. There’s so much engagement in that, and there’s such a buzz in it.”
However, roundtable participants also argued that there should be more evidence-based CPD on how to support learners with negative experiences of education. There is also a perceived need to increase the amount of CPD for English. While CPD for maths is very good and accessible, good CPD for English remains relatively scarce according to some providers.
Conclusion
Our young people deserve the best possible start to their adult life and the resit policy is designed with this goal in mind. Its potential benefits to secure fundamental numeracy and literacy skills are clear, but so is the potential damage to motivation for students who feel they are stuck on the resit treadmill. Our analysis shows that that there is plenty of room for improvement within the current policy, setting out recommendations for policymakers, providers and researchers.
We argue that there needs to be more focus on the widening attainment gaps in the 16 to 19 phase and reiterate calls for a 16 to 19 student premium to help those most disadvantaged. We also argue that there is a need for further investment in developing and expanding CPD and professional networks for English and maths resit teachers.
At the provider level, adopting selective approaches to November resits, entering students onto GCSEs, and focussing on early relationship building with students have the potential to improve results significantly. Our qualitative findings also suggested that embedding English and maths staff within subject area departments can be a highly effective approach for increasing engagement with English and maths across the institution.
Beyond these organisational factors, student engagement remains one of the biggest challenges for providers. Future research should consider the key drivers of student motivation and engagement for resits and test potential interventions.
Robbie Maris is a doctoral student supervised by Professors Gill Wyness and Jake Anders at UCL Centre for Education Policy & Equalising Opportunities, as part of a co-funded UBEL DTP Studentship with the Education Policy Institute, with whom he conducted this research.
By Blog editor, on 25 June 2025
By Professor Lindsey Macmillan, Dr Claire Tyler and Dr Catherine Dilnot
For the last decade we’ve been collecting and analysing recruitment data from over 20 of the UK largest graduate recruiters to highlight barriers to professional careers for underrepresented groups of young people. We have shown that young people from ethnic minority and/or working class backgrounds are well represented in the applicant pools for entry level professional careers but are less likely to be hired even when they look the same on paper. We have used our innovative ‘early careers recruitment data hub’ containing data on over 2.5million job applicants to document new evidence about why these barriers exist, highlighting the role of online testing, applying early, educational background and intersectional disadvantages.
But is this picture getting better or worse over time?
In this latest blog post we summarise new findings from our updated report, showing trends in inequalities in access to professional entry level careers over time. For our updated analysis we look over the period from 2022 to 2024 using a sample of over 350,281 applicants to graduate programmes, 73,525 applicants to internships, and 298,057 applicants to school leaver and apprenticeship programmes across a range of sectors (predominantly accountancy, law and public sector).
Worryingly, we find that the inequalities in access to professional careers that we highlighted in our original report have increased between 2023 and 2024, by socio-economic background (SEB), ethnicity and their intersections, across all entry routes.
Larger barriers for lower SEB applicants
For the graduate entry route, independent school applicants were 20% more likely to receive an offer relative to similar state school applicants in 2024, up from 7% in 2023 (Chart 1 – ‘full models’). By ‘similar’ we mean the applicants we compare are of the same gender and ethnicity, from the same UK region, attended the same type of university, studied a similar undergraduate subject, reported the same personal/professional networks and applied for the same role with the same employer in the same location.
This trend of increased inequalities is also consistent for working class applicants relative to professional background applicants. Comparing similar applicants, those from working class backgrounds were 21% less likely to get offers than similar professional background applicants in 2024, up 5 percentage points from the 16% penalty in 2023.

Larger barriers for ethnic minorities
We also found an increase in inequalities in offer rates by ethnicity, with Asian and Mixed and other ethnic groups being increasingly less likely to receive graduate offers in 2024 compared to White applicants, relative to 2023 (Chart 2 – ‘full models’).
By contrast, inequalities in graduate offer rates for Black applicants relative to White applicants reduced slightly from 38% in 2022 to 31% in 2024, leading to an equalisation of inequalities across minority ethnic groups. This suggests any gains from employers hiring more Black applicants has come at the expense of lower hiring rates for other ethnic minority groups rather than White applicants.
Chart 2: Offer rates to graduate programmes, conditional on observable differences across applicants over time, by ethnicity

Intersectionality increasingly matters
Our analysis highlighted a double disadvantage for state educated ethnic minority applicants to graduate entry level roles which has increased over time. We found a widening of the gap in offer rates for this group relative to White state educated applicants from 16% to 32% and a corresponding increase in the gap in offer rates for White independent school applicants from 9% to 21%. State educated ethnic minority applicants are therefore losing out on graduate offers relative to White independent school educated applicants with similar characteristics. (Chart 3 – ‘full models’).
Chart 3: Offer rates to graduate programmes, conditional on observable differences across applicants, by ethnicity and school type

School leavers, apprentices and interns
Inequalities in offer rates to internships and school leaver and apprenticeship programmes show a similar increase in inequalities by school type from 2023 to 2024. While state and independent school applicants had a similar chance of achieving an offer to an internship and school leaver or apprenticeship programme in 2022 and 2023, independent school applicants were 15% more likely to receive an offer to an internship programme in 2024 relative to state school applicants who were otherwise similar. They were also 10% more likely to receive an offer to the school leaver and apprenticeship programmes.
And while Black applicants were more likely to get an offer to an internship programme in 2023 relative to similar White applicants, this trend reversed in 2024 where they were 23% less likely to receive an offer relative to otherwise similar Black applicants. This coincided with some employers removing internship schemes with a specific focus on diversity.
Recommendations
Our findings suggest an important role for both employers and universities in tackling inequalities in access to professional careers (see the full list of ten recommendations in our report.)
This worsening picture for inequalities in access to professional careers we have outlined here has led to us include these specific recommendations for employers:
- Inequalities appear to have worsened over time as competition for places has increased to record high levels. It is therefore important to be particularly vigilant about diversity across the recruitment process when competition for places is higher. Employers should be more proactive in managing the adverse impact for underrepresented groups who are more likely to lose out as competition increase.
- Consider keeping existing / introducing new schemes that have specific focus on hiring diverse candidates. The existence of these schemes for internship positions saw increased diversity while the removal of them coincided with a significant decline in diversity.
- Consider how to contribute to building a robust evidence base of ‘what works’ to support your colleagues, your sector and policy makers to refocus diversity initiatives and policies more efficiently.
Notes:
‘Raw’ models in this blog contain employer fixed effects, gender, SEB, and ethnicity. ‘Full’ models adds controls for region of origin, visa status, university category, subject studied, networks, region of office, and job role applied to. Points represent % estimates while lines represent 95% confidence intervals.
By Blog Editor, on 10 June 2025

Dr Laura Outhwaite, UKRI Policy Fellow and Principal Research Fellow at UCL Centre for Education Policy and Equalising Opportunities
In 2024, I joined Ofsted’s Early Years and Social Care Research and Evaluation Team as a UKRI Policy Fellow. Policy fellows are academics seconded to a government department for 18 months to research a policy-relevant issue. They gain valuable insights into how research contributes to policymaking, while departments benefit from dedicated research capacity, access to the latest academic evidence and strengthened links with the research community.
My fellowship with Ofsted aimed to explore how we can better understand the barriers young children face in their early learning. As an academic at the UCL Centre for Education Policy and Equalising Opportunities, my research focuses on child development and early inequalities. My fellowship was an exciting chance to work at the intersection of research, policy and practice. Applications for the next UKRI fellowship roundare now open.
Ofsted’s interest in barriers to early learning reflects its wider, renewed commitment to inclusion as a strategic priority. This focus follows insights from the Big Listen and other research to better understand vulnerability and its complexities. My research contributes to this conversation, and to Ofsted’s continued commitment to ensuring that all children get the best start in life, by focusing specifically on how experiencing barriers to learning can affect children’s outcomes in the early years.
What I did
I analysed data from over 5,000 three-year-olds and their families, collected between 2012 and 2022 in the Understanding Society dataset. I explored how children’s family and environmental circumstances were related to their early outcomes. I focused on the prime areas of learning: communication and language, physical development, and personal, social and emotional development. Working closely with Ofsted colleagues, I co-designed my study to combine academic rigour with real-world policy relevance. The findings have been accepted for publicationin the British Journal of Developmental Psychology.
What I found
First, my study illustrated the importance of viewing barriers to learning as multidimensional. Child health, the home learning environment, turning 3 during Covid-19, child ethnicity, parent education, and financial strain in the home, all significantly predicted early outcomes at age 3.
Second, my study showed that barriers to learning can be cumulative. Children with three or more risk factors were five months behind their peers, even where individual factors had small effects on their own.
Finally, my study showed that current support systems may overlook important barriers to children’s learning. For example, eligibility for early years pupil premium (EYPP) (based on their parents receiving income-support benefits) did not significantly predict early outcomes. In contrast, children from families reporting financial strain were, on average, two months behind their peers. This evidence highlights that there may be a disconnect between how financial hardship is officially recognised and how it is experienced.
This mismatch may be because benefits eligibility criteria have been frozen in recent years, despite rising costs of living and inflation. As a result, the number of children qualifying for support has declined in real terms over time. In addition, not all families take up their early education entitlement and apply for EYPP funding. The annual EYPP funding rate has recently increased from £388 to £570 per child, but there are still significant practical challenges to claiming EYPP. For example, some eligible families do not apply for EYPP due to the bureaucracy involved and potential stigma associated with receiving government help. Early years providers also report finding the process of accessing the funding burdensome and challenging. These barriers can prevent some families from accessing this support. This means that EYPP eligibility may not fully capture all families facing financial difficulties.
What my findings mean for policymakers
Alongside Ofsted’s commitment to inclusion, the government has set a target to increase the proportion of young children who are school-ready by 2028, as part of the Opportunity Mission.
My research suggests three key considerations for policymakers to help achieve their goals:
- Recognise complexity: Barriers to learning in early childhood are rarely due to one factor. Education policies and systems need to reflect this complexity, so that more young children are seen and supported.
- Improve access to early support: Eligibility for targeted funding like the EYPP does not currently capture all families facing financial hardship. In the longer term, reviewing the salary threshold for eligibility could help to widen access to this support.
- Reduce challenges to claiming early support: Simplifying the EYPP application process – for example, by introducing auto-enrolment similar to what’s been proposed for free school meals in the Children’s Wellbeing and Schools Bill– could help increase uptake and improve the impact of early support.
Looking ahead
The 2025 UKRI Policy Fellowship programmeis now open. Ofsted is once again keen to host a fellow – this time with a focus on evaluating the impact of its proposals to improve education inspection. I’d strongly encourage other researchers to apply – it’s a rare chance to bring research into close conversation with policy and practice. There are also fantastic learning and networking opportunities within the cohort of other policy fellows.
Over the past 18 months, this fellowship has shown me the value of genuine collaboration between researchers and policymakers. I’m excited to continue my work in this area and contribute to evidence-informed actions that ensure all children get the best start in life.
Dr Laura Outhwaite is a UKRI Policy Fellow seconded to Ofsted. The views in this blog are her own and do not necessarily reflect Ofsted’s policy position.
By Blog Editor, on 16 May 2025
Jake Anders
This post originally appeared on Economics Observatory.
The social restrictions and disrupted educational experiences resulting from Covid-19 have had a negative impact on many young people’s mental health. The damage to wellbeing has been more persistent in certain groups, particularly among girls and those who identify as non-binary.
Young people’s mental health and wellbeing have attracted increasing concern over the past decade or more. There is evidence of long-term increases in the prevalence of mental distress among young adults that were already a cause for alarm before Covid-19. As such, the potential impact of the pandemic has provided an additional layer to an already worrying situation.
Concern was expressed from early in the pandemic that any negative effects it had on wellbeing would persist beyond the end of restrictions. Emerging evidence from the general population suggests that this forecast may be turning out to have been accurate.
Indeed, there is evidence that the pandemic did have a negative impact on young people’s wellbeingand mental health, but some research indicates an initial recovery in the latter phases of the pandemic.
While short-term impacts are, of course, important in their own right, we should be especially concerned if the effects of the pandemic are continuing to affect young people’s lives – including their subjective wellbeing – now that social restrictions have subsided and life is back to ‘normal’.
So what do we know about post-pandemic inequalities in young people’s wellbeing and the potential issues linked to lingering impacts of the pandemic?
In new work, drawing on data from the COVID Social Mobility and Opportunities study, we provide evidence on young people’s wellbeing in the aftermath of the pandemic and some of the factors associated with these levels using a large, representative sample of young people from across England. Understanding inequalities and potential lingering effects are important pre-requisites for targeting support effectively to begin to address these challenges.
There is longstanding evidence of gender differences in wellbeing, which others’ research finds to have been exacerbated by the pandemic. There is little evidence of this having closed since the pandemic among young people (although othershave found it to have narrowed among the general population).
Our work finds that girls and those who identify as non-binary or in another way report lower wellbeing scores (around 0.5 for girls and around 1.5 for non-binary+ young people on a scale from one to ten) than boys, even after adjusting for other demographic characteristics, self-reported levels of social support and experience of adverse life events.
These are substantial differences that are relevant to the higher rates of mental health challenges for individuals in these groups. In particular, the large differences associated with identifying as non-binary or in another way suggest a need for support targeted towards these groups.
Figure 1: Differences in wellbeing by gender
Source: COVID Social Mobility and Opportunities study
Notes: All models report differences at Wave 2 adjusting for wellbeing at Wave 1, so focusing on changes in wellbeing over the course of around a year. Model L1 does not adjust for young people’s other characteristics; L4 adjusts for socio-economic status and ethnicity; L6 also adjusts for social support; L8 also adjusts for experiences of adverse life events.
Although other work has documented a recovery in wellbeing for many since the pandemic, we think it is important to highlight young people’s own perceptions of the continuing impact of the pandemic on their wellbeing.
A third of young people were continuing to report such effects in late 2022 and early 2023, with the vast majority of them reporting these to be negative impacts. Our findings illustrate the importance of taking such reports seriously: those who indicate that the pandemic is still having a negative impact on their lives have substantially lower subjective wellbeing scores – more than one point on a one to ten scale – with similar differences across demographic groups.
An important part of why the pandemic may be having a continuing negative effect on young people’s wellbeing is the increased probability of experiencing a range of adverse life events that are known to affect wellbeing. Tracking young people’s experiences of such events – across domains relating to health, financial distress and relationship distress – throughout the pandemic period shows that 29% of pupils reported experiencing no such events at all, while 26% experienced three or more.
Figure 2: Differences in wellbeing by perceived continued negative impact of the pandemic, with and without controlling for adverse life events

Source: COVID Social Mobility and Opportunities study
Notes: Model P3 adjusts for demographic characteristics, socio-economic status and social support; E4 also adjusts for experience of adverse life events during the pandemic.
Experiencing more of these adverse life events during the pandemic predicts lower subjective wellbeing subsequently, even among those with similar demographic and socio-economic characteristics. Nevertheless, differences in experiences of adverse events explain only a small part of the lower scores that we see among those who perceive a continued impact of the pandemic on their mental wellbeing.
Contrary to our expectations, and in contrast with others’ findings, while social support predicts higher wellbeing scores, we do not find evidence that it mediates or buffers the impact of adverse life events among young people.
Our findings indicate that challenges posed by inequalities in young people’s wellbeing continue. This highlights the importance of long-term targeted support to overcome them.
The practicalities of providing such support at scale are now much harder for our specific cohort, as many of them have left education entirely. But many of the issues discussed will apply similarly to those young people still working their way through the education system, who could be reached through schools and colleges.
We should not ignore this issue. Above and beyond the negative implications for young people’s life experiences, there are potential implications for national economic performance, including via increased risks of mental health challenges for the young people still being affected.
Where can I find out more?
 Close
Close


