X Close

BRITS cell therapy project planning and valuation tool

Home

Menu

Archive for the 'Project Valuation & Planning Tool' Category

Worksheet 1: User Input & Project Specifications

By zceie01, on 1 June 2014

User input provided in worksheet 1 is used to produce a project risk profile and estimates for the duration of subsequent development stages. In addition, user input provided in worksheet 1 forms the basis for the cash flow statement, and NPV calculations produced in worksheet 2, as well as the scenario analyses produced in worksheet 3.

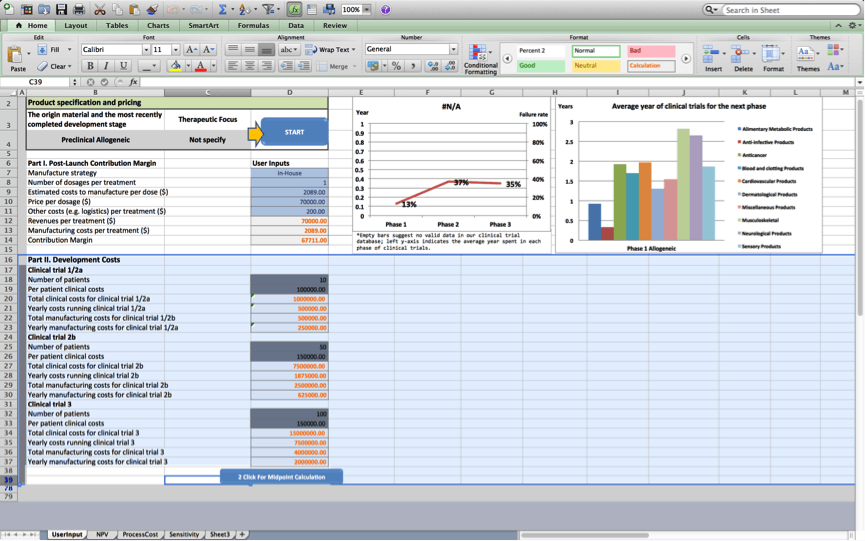
After the user presses the “start” button, users are asked to provide basic specifications of the product in box 1:

Box 1: Product specification and pricing

Box 1 prompts the user to provide a number of product specifications and information about the product’s pricing at launch.

1. Origin material and most recently completed development stage

toolmanual_ws1_box1:original material

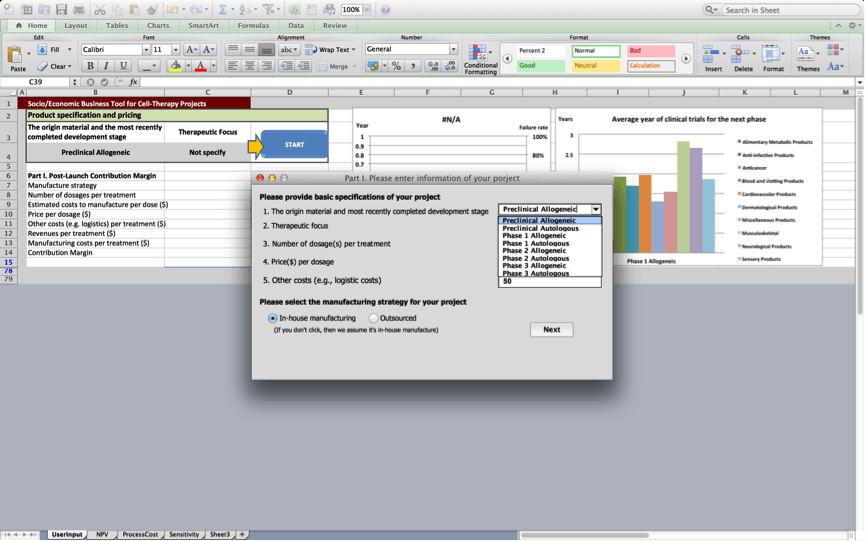
The user specifies whether the cell therapy is an allogeneic or autologous cell therapy product. In addition, the user should specify the latest stage of the development process the product is (about to) complete. These specifications will be used to assess the development times and risks associated with the cell therapy product and will for example inform the duration of the different development stages and the discount rates that are applied to cash flows in the cash flow statement.

The earliest development stage that users can indicate for their product is the pre-clinical stage. Thus, the tool is especially useful for business planning and valuation exercises for products that are entering one of the formal clinical trials stages. We suggest that users who are conducting business planning and valuation exercises for projects that are not yet ready for clinical trials use the tool to illustrate the valuation and development path for projects once these enter clinical trials.

2. Therapeutic focus

toolmanual_ws1_box1_therapeutic focus

The user should select the primary application area of the product. This information will be used to assess the development times and risks associated with the cell therapy product. If the user does not specify a specific therapeutic focus, the tool will use industry-level averages to assess the project’s risks and expected development times. Also, if the user specifies a specific therapeutic focus but the tool does not contain data on more than one project with a similar therapeutic focus (for example because the user is among the first to develop a cell therapy project in that area), cell therapy industry averages are used to calculate expected risk rates and development times associated with the project.

3. # dosage(s) per treatment

toolmanual_ws1_box1:dosage

The user should select the average number of dosages that patients will be prescribed as part of their treatment. This information will be used as a part of revenue calculations.

4. Price($) per dosage

The user should specify the price the user will charge payers per dosage. This information will be used in the calculation of revenue streams associated with the project.

5. Manufacturing

The user is asked whether the manufacturing strategy entails in-house or outsourced manufacturing.  If a user selects “outsourcing” as a manufacturing strategy, the total manufacturing costs will be 30% times higher than if the user selects “in-house manufacturing”. However, the user will not incur separate manufacturing set-up costs if the “outsourcing” option is selected.

Once the user presses ‘next’, figures 1 and 2  are updated based on the project’s characteristics. The line in Figure 1 presents a customised risk profile for the user’s cell therapy project, that highlights expected chances the project will fail at subsequent development stages based on data the BRITS team collected on similar projects (i.e. projects that use the same origin material and have a similar therapeutic focus). The bars in figure 1 present a customised overview of the expected development times for the project during subsequent stages based on data, the BRITS team collected on similar projects. No bars are shown if we have fewer than 2 observations for projects that are similar in terms of the used origin material and the therapeutic focus. Figure 2 displays average durations of the clinical trials stage the project will progress to next. The figure displays historical averages for projects using the same origin material and breaks these down by therapeutic application.

Failure rates displayed in figure 2 will be used to discount cash flows in worksheets 2 and 3; Development times displayed in figure 2 will be used to determine the duration of the various stages of development in the cash flow statements of worksheets 2 and 3.

By clicking ‘next’, at the bottom of box 1, the user also prompts box 2 to appear.

Box 2: Post-approval manufacturing costs

toolmanual_ws1_box2:post-approval manufacturing costs

In order to provide users with an estimate of manufacturing costs of the product once it is approved, the user is asked to provide the following information:

  1. The number of cells in a single dosage.
  2. The estimated number of dosages that users expect to manufacture per year after the product is approved.
  3. The estimated lot sizes used in the manufacturing process.

Based on the information provided by users, the tool calculates the expected manufacturing costs per dosage based on optimal manufacturing specifications. These expected manufacturing costs will be used to calculate post-launch manufacturing costs in the tool’s cash flow projections. If the user wishes to change the expected post-launch manufacturing costs, the user can override the manufacturing cost estimate and provide an alternative estimate at the bottom of box 2.

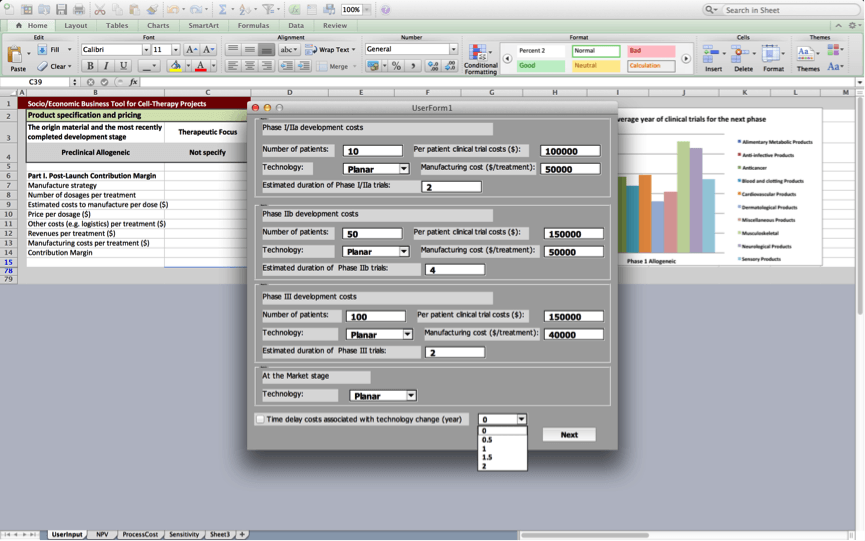
Box 3: Development costs

toolmanual_ws1_box3:development costs

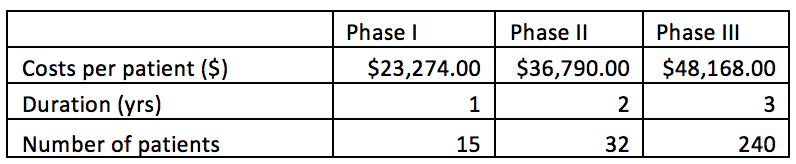
In order to calculate product development costs incurred for running clinical trials and for manufacturing the product used during trials, users are prompted to provide specifications for the clinical trials protocol, and manufacturing processes they plan to use. Estimates will be more precise if the user is able to provide more project-specific values in box 3. However, the BRITS team has collected data on ‘typical’ values for running clinical trails and manufacturing processes for allogeneic cell therapy projects. These values will be used as default values unless the user inserts project-specific ones.

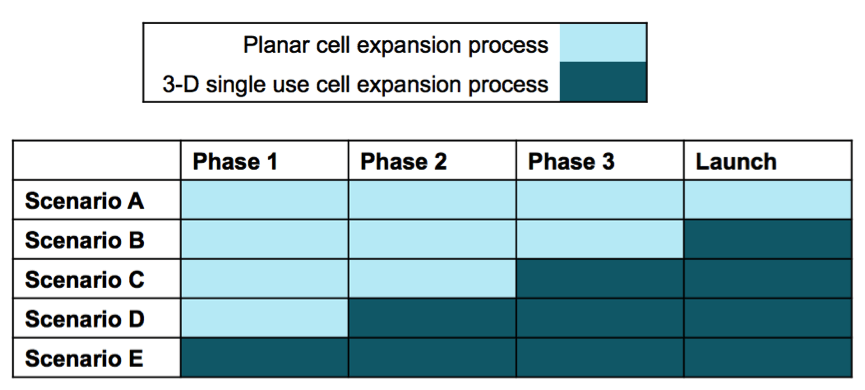
Users are asked to provide information on the number of patients that will be enrolled during each of the subsequent clinical trials, per patient costs of running these trials, manufacturing costs for a single treatment used in clinical trials, and the manufacturing process being used (Planar, MC-SUB, or other).

The BRITS tool estimates the duration of the different clinical trials stages based on information about the origin material and therapeutic focus of the project, which the user provides in Box 1: Product specification and pricing.  However, the user may override the durations for the different clinical trials stages that are based on average development times for similar projects that are provided by the tool by inserting alternative values here.

The user may click the box ‘Consider time delay costs if technology changes (mo)’, to account for time delays that are a result of changes to the manufacturing process.

toolmanual_ws1_box3:development costs:b

Box 3.1: Manufacturing set-up costs

toolmanual_ws1_box3.1:manufacturing set-up costs

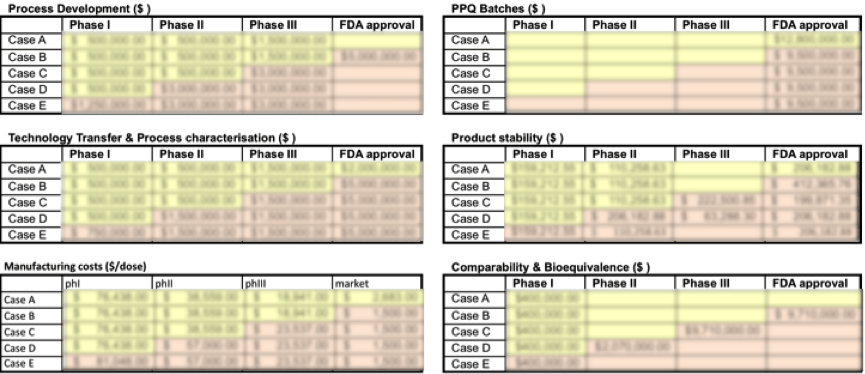
Manufacturing process costs constitute a substantial cost component of early-stage cell therapy projects. Box 3.1 helps users incorporate these costs in business planning and project valuation exercises. Estimates will be more precise if the user is able to provide more project-specific values. However, the BRITS team has collected data on ‘typical’ values for costs associated with (changes in) manufacturing processes for allogeneic cell therapy projects. These values can be found in Case Study 2, the Process Change Case. This case study provides ‘typical’ values for a range of manufacturing strategies that can be employed in the development of cell therapy projects.

Users can enter expected costs associated with the different clinical trial stages as well as the pre-market stage when firms set up manufacturing processes for the marketed product. Manufacturing process costs are divided up across the following categories:

  • Process development costs
  • Technology transfer & process characterisation costs
  • PPQ batches costs
  • Product stability costs
  • Comparability & bioequivalence costs
  • Clinical trial bridging study costs

Users are recommended to include clinical trial bridging study costs if they decide to change manufacturing technology from one clinical trials stage to the next. These costs are often estimated by multiplying the clinical costs for one patient enrolled in clinical trials during the preceding stage by fifteen.

Finally, by checking the box ‘time delay associated with technology change (years)’, the tool will incorporate this delay and add the time required to change the manufacturing technology. Delays will be reflected in longer development times in the cash flow statements of worksheets 2 and 3.

Once the user presses ‘next’, the tool consolidates the information provided into two categories, namely Part I. Post-Launch Product Contribution Margin , and Part II. Development Costs.

  • Part I provides an overview of the components that make up the contribution margin associated with the cell therapy product once the product is marketed.
  • Part II provides an overview of the components of the project’s development costs.

toolmanual_ws1_box3:development costs_part2

Box 4: Market penetration, staff costs, and other, fixed costs

Box 4 prompts the user to provide information about the expected market penetration at launch, the annual growth rate of the product’s market, staff costs, and other fixed costs associated with the project.

Market penetration

toolmanual_ws1_box4:market penetration

The user should provide estimates of the potential market size for various applications of the product (i.e. as a frontline treatment, as a second line treatment, or other). In addition, by clicking on the drop-down box the user can provide an estimate of the market penetration, measured as a proportion of the target market that is reached during the first year the cell therapy is on the market. The tool assumes that during each of the subsequent year this level of market penetration doubles until, 100% of the target market has been reached. Information on market penetration and growth is used to calculate the revenues generated by the commercialisation of the cell therapy that are displayed in worksheets 2 and 3.

Staff costs

toolmanual_ws1_box4:staffcosts

The user should provide estimates of numbers of employees that will be employed across different staff roles along the project’s development trajectory. Default values for salary levels associated with these roles have been obtained from a recent study on staff compensation levels at biotechnology firms published in Nature Biotechnology. The user can change these salary levels according to the specific circumstances of the project. Information on staffing will be used to calculate staff costs in worksheets 2 and 3.

Other, fixed costs – A third part of box 4 allows the user to insert information on other, fixed costs that are expected to be incurred along the various commercialisation stages of the cell therapy project. These costs will be incorporated into the project costs displayed in worksheets 2 and 3.

Once the user clicks on the ‘next’ button, the information provided in box 4 is automatically consolidated in a number of figures that break down various cost items.

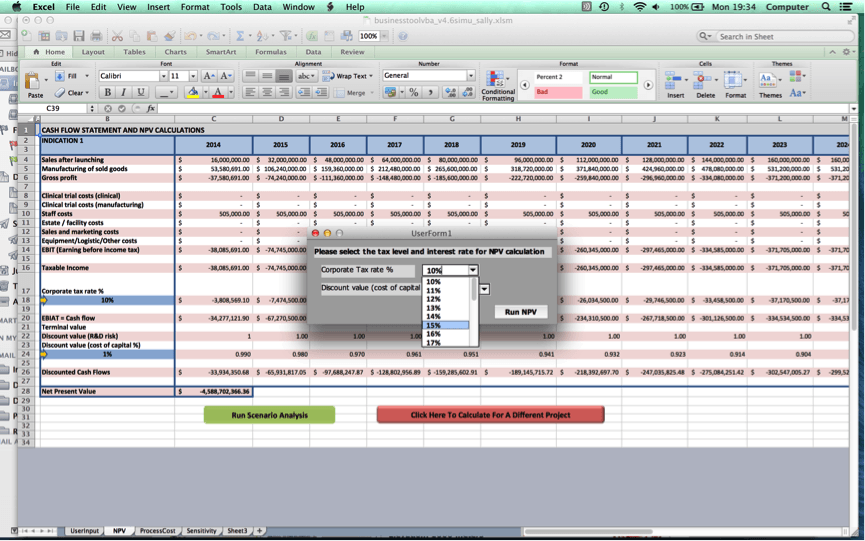
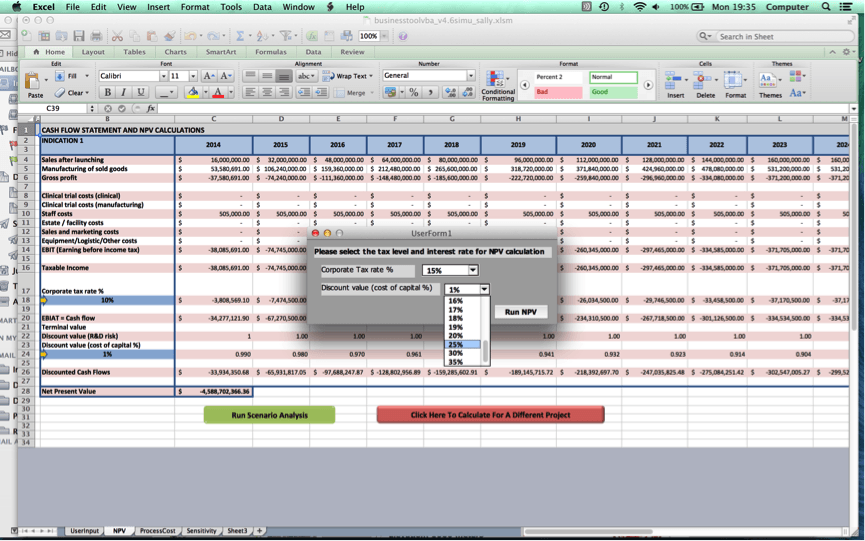
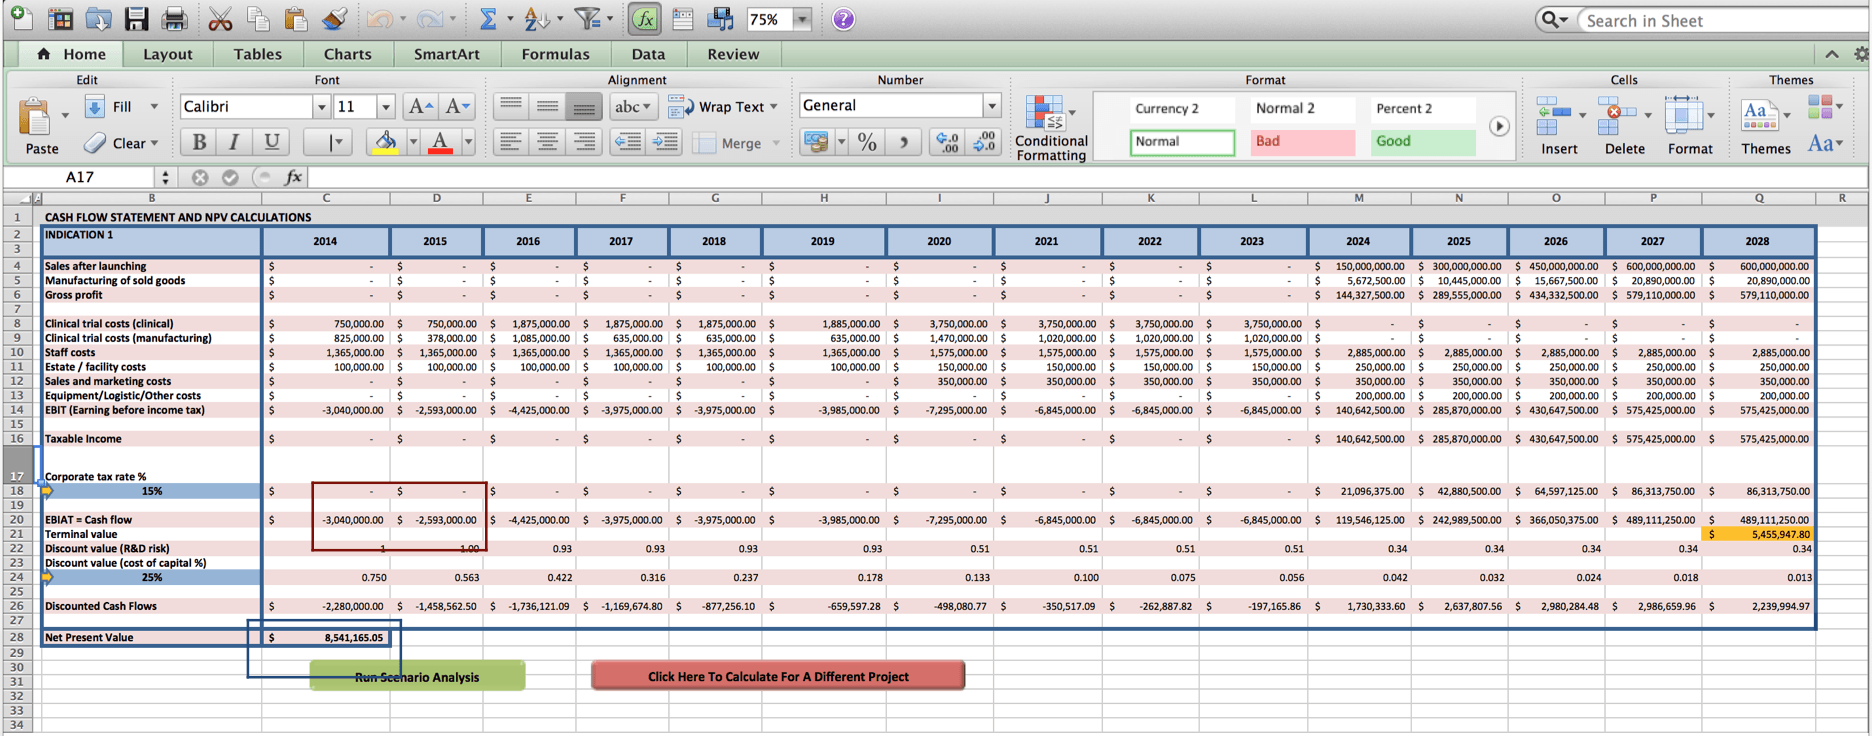
Once the user clicks on ‘Go to NPV analysis’, the user is ushered to Worksheet 2 where a cash flow statement for the user’s cell therapy project and NPV value will be produced.

Worksheet 2 >>>


Worksheet 2: Cash Flow Statement & NPV Calculation

By zceie01, on 1 June 2014

Worksheet 2 consolidates information provided by the user into a cash flow statement that runs 15 years into the future. Moreover, the cash flow statement is used to calculate the project’s net present value and projections of the project’s net present value as it progresses to subsequent stages in the development process.

toolmanual_ws2_cashflowstatement

To construct the cash flow statement, the user is asked to provide information in Box 5 about the corporate tax rate at which profits will be charged. The current UK corporate tax rate is 21%. From 2015 onwards, it will be 20%. Although the user can select a lower tax rate, the BRITS tool does not provide an automated option for deducting any tax credits, allowances, and tax relief, companies may be eligible for.

In order to calculate the net present value of the project with the purpose of calculating its net present value, the tool applies two discount rates to the free cash flow (EBIAT):

  • To help the tool determine the first of these discount rates, users are prompted in Box 5 to provide information about the cost of capital of the firm, which is also referred to as the Weighted Average Cost Of Capital (WACC). For entrepreneurial firms that commercialise cell therapy projects, this is typically the rate of return investors in the firm expect to receive. If unknown, we recommend users to use a rate within the range between 20% and 30% with he higher end of the range reserved for earlier stage firms that are considered to be riskier. The rate that discounts the project’s cash flow based on the firm’s cost of capital is applied in row 24 of worksheet 2.

toolmanual_ws2_cashflowstatement:b

  • The second discount rate that accounts for the project’s R&D risk is automatically applied in row 22. This discount is calculated based on data the BRITS team collected on failure rates of cell therapy projects that are similar to the one characterised by the user in Box 1 of Worksheet 1. These failure rates are also visualised in Figure 1 on Worksheet 1.

The Net Present Value that is presented in Worksheet 2’s cell 28C, is the sum of the discounted cash flows added up to the terminal value of the cash flows after year 15. The terminal value is calculated as the value of an annuity that pays out the firm’s projected free cash flow in year 15, using the firm’s cost of capital.

Also, worksheet 2 generates a figure with the projected project valuations that will be achieved once the project hits subsequent development stages. These projections will be particularly valuable in efforts to plan and assess funding strategies for projects.

toolmanual_ws2_cashflowstatement:c

Worksheet 3 >>>


Worksheet 3: Scenario Analysis

By zceie01, on 1 June 2014

At the bottom of worksheet 2, there is a button that allows the user to conduct a scenario analysis to assess the impact of various scenarios on the project’s cash flow projections and valuation. To conduct the scenario analysis, the user is asked to set the parameters for this analysis in Box 6. In order to calculate best and worst case scenarios, the user can specify in Box 6 the variation from the base case in terms of the market penetration the project’s product is able to achieve once it hits the market, and the speed with which clinical trials are completed.

Once the user has set the parameters for the scenario analysis, and presses the button ‘run NPV scenario analysis’, the user is directed to Worksheet 3 where three scenarios are displayed as well as a figure with the NPVs associated with these scenarios:

– The base case scenario is a duplicate of the scenario presented in Worksheet 2

– The best-case scenario indicates the impact on the project’s cash flows and valuation if the market penetration of the cell therapy product is higher than in the base case scenario and clinical trials are completed speedier than in the base case scenario by amounts that the user specifies in Box 6.

– The worst-case scenario indicates the impact on the project’s cash flows and valuation if the market penetration of the cell therapy product is lower than in the base case scenario and clinical trials are completed at a slower pace than in the base case scenario by amounts that the user specifies in Box 6.


Project Valuation & Planning Tool

By zceie01, on 1 June 2014

The BRITS business valuation and planning tool for cell therapy projects provides a set of critical decision support tools for faster and more effective decision making and commercialisation in the cell therapy field. The cell therapy sector is a new sector and the uncertainties stakeholders face in designing business and financial strategies for the commercialisation of cell therapies were a key impetus for the BRITS project.

The BRITS tool builds on a comprehensive analysis of project failure rates and development times for different types of cell therapy projects across the various stages of the product development trajectory. Moreover, the tool incorporates parameters to calculate key development costs associated with cell therapy projects. The tool produces three main outputs based on user inputs:

  • A cash flow statement the tool generates helps users estimate yearly incomings and outgoings and financing needs over the course of the cell therapy project development pathway.
  • The project valuations the tool generates help users assess the financial viability of cell therapy projects, and formulate funding strategies. In addition, the valuation function is useful in facilitating negotiations about equity distributions following capital infusions in cell therapy projects and the organisation of licensing deals.
  • Scenario analyses produced by the tool will allow users to assess the robustness of business and financial planning scenarios as the duration of product development pathways and the adoption of cell therapies in the market change.


Download tool

By zceie01, on 1 June 2014

The BRITS tool can be accessed at the bottom of the following webpage [click here].
Please send an e-mail to Dr Simcha Jong for the password required to use the tool.
Screen Shot 2014-06-30 at 15.24.02

BRITS Tool Manual

By zceie01, on 1 June 2014

The BRITS tool is designed to support investors, technology transfer professionals, academic entrepreneurs, and managers in business planning and project valuation exercises in the cell therapy sector. To this end, the BRITS tool provides users access to data that is of value in R&D project planning in the cell therapy sector. For example, the tool incorporates a comprehensive dataset on failure rates and development times of past commercial cell therapy projects. In addition, the tool contains data on manufacturing costs for different types of cell therapy projects and various other costs associated with the development of cell therapy projects such as staff costs.

The BRITS tool offers a user-friendly Excel-based format to use these data as input for customized cash flow sheets, project valuations, and financial scenario analyses based on the technical specifications of individual cell therapy projects and the development strategies that are under consideration. All currency values in the spreadsheets are in US$. The tool consists of three worksheets that should be used in sequence. Click below for more information on the three worksheets that make up the BRITS tool’s interface:

WORKSHEET 1: USER INPUT AND PROJECT SPECIFICATIONS

WORKSHEET 2: CASH FLOW STATEMENT AND NPV CALCULATIONS

WORKSHEET 3: SCENARIO ANALYSIS


Case study 2: Dividing up equity

By zceie01, on 1 June 2014

Assessing funding needs and the value of equity in entrepreneurial cell therapy projects

Assessing funding needs for early-stage cell therapy companies and the equity distribution among new investors and existing owners in these companies, constitute a critical challenge for stakeholders involved in creating successful companies around individual cell therapy projects. The BRITS tool provides stakeholders guidance in dealing with these challenges. Specifically:

– The cash flow statement produced by the tool helps stakeholders in assessing the funding needs associated with various development stages.

– The NPV calculation can be used to support negotiations surrounding the distribution of equity among investors and novel investors in cell therapy companies.

We use the case study of company X, which is seeking funding to develop a new allogeneic cell therapy in the oncology market space as a case study. The company completed preclinical studies and has regulatory approval to proceed with a phase I/IIa study to assess the therapy’s safety and to collect preliminary data on the therapy’s efficacy. In addition, managers use the following assumptions about the therapy they are developing and the commercialisation trajectory they will follow:

The product and its market
  • A treatment consists of a single dosage containing 10^8 cells
  • The company hopes to charge an average price of $60k for the treatment.
  • Other variable costs, primarily logistics costs associated with delivering the product to the patient are $200,-/treatment.
  • The company plans to manufacture the therapy in-house.
  • The market the treatment will reach is a market of 10,000 patients per year; During the first year after launch the company will reach 25% of this market and it will take four years to reach the company’s total target market.
Clinical trials costs
  • The clinical costs of running a phase 1/2a trial with 10 patients are $100k per patient, with manufacturing costs at $50k per treatment.
  • The clinical costs of running a phase 2b trial with 50 patients are $150k per patient, with manufacturing costs at $50k per treatment.
  • The clinical costs of running a phase 3 trial with 100 patients are $150k per patient, with manufacturing costs at $40k per treatment.
Manufacturing set-up costs
  • All manufacturing is done using PLANAR technology. Moreover, the firm incurs process development costs of $250k, technology transfer costs of $100k, and PPQ batches costs of $100k, at each of the commercialisation stages.
Staff costs
  • To supervise the commercialisation of the cell therapy, the company employs three executive-level managers, three senior and three junior researchers throughout the commercialisation process, and four other staff members to provide administrative and technical support during each of the three clinical trials stages of development. Post-commercialisation, the company will need to hire an additional 16 technical/administrative staff members. Finally, to support marketing efforts, three marketing professionals will be hired during phase 3 trials, and this total will increase to eight marketing professionals post-commercialisation.
Fixed costs
  • Estate costs are $100k/year during clinical trials phases 1/2a and clinical trials phase 2b. These costs increase to $150k/year during clinical trials phase 3 studies, and $250k/year post-commercialisation.   Marketing and sales costs kick in once the company enters clinical trials phase three studies at $350k/year.
  • Fixed costs for a logistics infrastructure kick in at $200k/year post-commercialisation.
Cost of capital
  • Investors in this type of company are assumed to achieve an annual rate of return on capital of 25%; Moreover, as the company is a UK company, the corporate tax rate is assumed to be 15%.

Using the inputs listed above, the tool produces the following cash flow statement that projects the financial in- and out- goings for the firm for the coming 15 years (see screenshot 1).

ppt1

Assessing the firm’s development path and funding needs

ppt2

Based on our data on allogeneic anti-cancer cell therapies entering phase 1/2a trials, we estimate that the duration of phase 1/2a trials will be 2 years, the duration of phase 2b trials will be 4 years, and the duration of phase 3 trials will be another 4 years (see costs boxed in red in Screenshot 2).

ppt3

Row 20 consolidates all in- and out- goings and highlights yearly in- and out- goings in the form of Earnings Before Interest, After Tax (EBIAT). Adding up the projected outgoings during phase 1/2a trials, the tool projects a funding need of $3.0 Million + $2.6 Million = $5.6 Million (see costs boxed in red in Screenshot 3).

In addition, by adding up the discounted, risk-adjusted cash flow projections of row 28 in the spreadsheet, the tool provides a valuation for this cell therapy project of $8.5 Million (see amount boxed in blue in Screenshot 3).

Accordingly, a $5.6 Million investment to fund clinical trials 1/2a studies, would be worth a $5.6 Million/$8.5 Million = 67% ownership stake.

The tool allows stakeholders to play around with various assumptions underlying the firm’s business planning and assess the implications for these assumptions for the company’s funding needs, valuation, and equity distribution. One example would be for the firm from our example to arrange with managers and R&D workers that 50% of salaries will be paid in equity rather than cash during phase 1 clinical trials. This would significantly reduce the cash burn rate, and increase the valuation of the company. Screenshot 4 presents the cash flow statement and NPV for the same firm and assumptions as before, but reduces salary outgoings by 50% for managers and R&D workers during phase 1 clinical trials.

ppt4

The revised funding need of the firm to finance clinical trials 1/2a is $2.5 Million + $2.0 Million = $4.5 Million, and the project valuation is $9.3 Million. Accordingly, the value of the $4.5 Million cash, investors would bring in is $4.5 Million/$9.3 Million = a 48% ownership stake.

In addition, the $562,500 of foregone yearly salary of managers and R&D workers for the two years that it will take to complete clinical trials 1 (calculated by subtracting from the amount in cell C10 of the baseline case cash flow statement, the amount in cell C10 of the cash flow statement in Screenshot 4), paid out in equity rather than in cash would be worth (2 x $562,500)/$9.3 Million = a 12% equity stake for these staff members.

Download the screenshots above:
Loader Loading...
EAD Logo Taking too long?

Reload Reload document
| Open Open in new tab

Download

Case study 1: Process change case study

By zceie01, on 1 June 2014

Data on manufacturing costs were collected by Dr Sally Hassan with help of LONZA. Dr Suzy Farid also contributed to the development of this case study. Some data on manufacturing costs in this case study are blacked out subject to peer review and publication.

The BRITS tool can provide guidance to stakeholders in cell therapy projects in the development of manufacturing strategies. Managers have at their disposal options to use a range of manufacturing technologies along the development pathways. The BRITS tool will provide guidance for managers:

  • In assessing how investments and pay-offs associated with different manufacturing technologies affect the firm’s cash flows.
  • In evaluating how switches between different technologies along the development pathway affect these cash flows.
  • In deciding on optimal manufacturing strategies for the commercialisation of a specific project.
Different scenarios for manufacturing strategies

We use the case study of company X, which is developing a new allogeneic cell therapy product. The company has completed preclinical studies and has regulatory approval to proceed with a phase I/IIa study to assess the therapy’s safety and to collect preliminary data on the therapy’s efficacy. As they are planning the project’s development trajectory all the way through FDA approval, managers are weighing several options. Specifically, managers are considering whether to set up manufacturing using more traditional, and cheaper planar cell expansion processes or whether to opt for more advanced, and more expensive 3-D single use cell expansion processes. While requiring a higher upfront investment, these 3-D single use cell expansion processes will allow the company significantly reduce post-commercialisation per unit manufacturing costs.

Apart from considering whether to use either planar or MC-SUB technology all the way along the development trajectory (scenario’s A+E), managers consider various scenarios that involve switching from planar to MC-SUB technology as clinical trials progress and uncertainty about market approval is reduced. Figure 1 highlights these various scenarios.

Figure 1: Scenarios for different manufacturing strategies

1

Business planning for the cell therapy company X is developing builds on a number of assumptions that are used as input for the tool.

Figure 2.1: Project assumptions that are fixed across scenarios (clinical trials)

2.1


Figure 2.2: Project assumptions that are fixed across scenarios (staffing)

2.2


Figure 2.3: Project assumptions that are fixed across scenarios (other)

2.3


In addition, managers have obtained input from a contract manufacturer about the manufacturing costs associated with different scenarios (see figure 3).

Figure 3: Project assumptions that vary across scenarios

3

Finally, managers expect clinical trials 1, to take 1 year to complete, clinical trials 2, 2 years to complete, and clinical trials 3, 3 years to complete. Moreover, contract manufacturers warn managers that changing manufacturing processes at a specific stage of the development process requires managers to factor in a one-year delay in the duration of the clinical trials for that stage, and will require the company to conduct a bridging study involving fifteen subjects to satisfy regulators.

Valuation of different scenarios for manufacturing strategies

Using the BRITS tool, users are able to assess the NPV for the different scenarios. Assuming that the company will be able to charge $10k for its product post-commercialisation, the tool provides the following valuations (see figure 4).

Figure 4: Valuation of different scenarios assuming therapy can be commercialised at a price of US$ 10k

4

Figure 4 suggests that the highest valuation of the project is realised if managers select scenario A as the basis for the company’s manufacturing strategy, and stick to the more traditional planar technology throughout the commercialisation process. Thus, given the assumptions underlying the tool’s calculations, benefits in terms of lower costs of goods post-commercialisation of the new MS-SUB technology do not weigh up against the increased upfront investments for this technology.

The assumption that the company will be able to sell its product at a price of $10k means that it will enjoy a significant gross profit margin. Under scenario A, the company would enjoy a gross profit margin of $7,317/$10,000 = 73%, and

under scenarios B, C, D, E, the company would enjoy a margin of $8,500/$10,000 = 85%.

Assessing different scenarios for manufacturing strategies under different conditions

Managers  For example, managers often overestimate the willingness to pay for novel cell therapies and the profit margins their firms are able to sustain in the market. The BRITS tool is useful in assessing how reductions in gross profit margins firms are projected to realise, affect trade-offs managers face.

Figure 5 highlights how reductions in the price of the cell therapy alter valuations of the different manufacturing scenarios. As the price the firm charges for its cell therapy product decreases, scenario A falls down the ranking of the scenarios with the highest valuation. With a reduction of the price of the cell therapy product by half, it becomes more attractive to switch to MC-SUB manufacturing technology for phase 3 (scenario B), or phase 2 clinical trials (scenario C), than to stick to planar technology throughout (scenario A).

Figure 5: NPVs of manufacturing scenarios at different price points of cell therapy

5