X Close

Science blog

Home

News, anecdotes and pictures from across science and engineering at UCL

Menu

From summer interns to cubesats in space

By Charlotte E Choudhry, on 7 October 2016

Pratham2

Many students send emails requesting summer internships at UCL Physics & Astronomy, but one particularly caught Dr Anasuya Aruliah’s eye. Vishal Ray was a 2nd year Aerospace Engineering undergraduate at the prestigious Indian Institute of Technology Bombay, India (IIT). He belonged to a student team building their own miniature satellite. Vishal was just the student that Dr Aruliah needed for her new direction of research: satellite drag. After a successful application to the International Students Dean’s Summer Student Scholarships, he was awarded a 2 month internship in summer 2015.
Dr Aruliah’s group, the Atmospheric Physics Laboratory (APL), is a subgroup of the Astrophysics Group. It has a long history of researching the upper atmosphere using a global circulation atmospheric model. They also operate a network of Fabry-Perot Interferometers (FPIs) in Arctic Scandinavia to observe the aurora. The Earth’s atmosphere is like an onion skin, with the troposphere (the domain of weather forecasters), stratosphere and mesosphere as layers on top of each other. The thermosphere is the final layer of the Earth’s atmosphere, and is the altitude region between 90-400km. Low Earth Orbit (LEO) satellites occupy the top of the thermosphere, and rely on upper atmospheric models to predict their orbits.

Recently the APL group found a discrepancy between measurements of thermospheric winds calculated from Doppler shifts of airglow photons, and winds determined from atmospheric drag on the Challenging Minisatellite Payload (CHAMP) satellite. This is an important puzzle to solve because satellite drag measurements are put into atmospheric models to bring them as close to reality as possible. If the ground and satellite measurements do not agree, then which is correct?

The IIT miniature satellite, commonly called a cubesat, is composed of a single cube, only 30 cm in length, width and breadth, and weighing only 10 kg, as much as a few bags of sugar. Their cubesat is called Pratham. This fits perfectly with UCL’s involvement in the European Union FP7-funded QB50 project, in which fifty cubesats carrying miniaturised sensors will be launched nearly simultaneously. This is an international collaboration involving many universities, academic institutes and the space industry. It is an unprecedented science operation, with potential for future Space Weather monitoring campaigns. The QB50 cubesats will be carried by rocket into the upper thermosphere, and fall to Earth in decaying orbits while sampling regions of the thermosphere and ionosphere that were previously poorly understood owing to the lack of detailed measurements.

“The simplicity and low cost of cubesats has spurred much excitement and creativity amongst young (and old) engineers and scientists over the last few years. There are new frontiers being opened by this miniaturised space technology,” said Dr Aruliah.

The UCL Mullard Space Science Laboratory (MSSL) designed and built one of the three key sensors: the Ion Neutral Mass Spectrometer, which will be carried on several of the cubesats, as well as their own cubesat called UCLSat. The QB50 cubesats are scheduled for launch in three batches over the winter period of 2016-2017. Two batches from a Ukrainian-Russian Dnepr rocket, and a third from the International Space Station. During Vishal’s internship at UCL he met with the MSSL cubesat and sensor team, led by Mr Dhiren Kataria and Dr Rob Wicks; and with Dr Stuart Grey in the UCL Department of Civil, Environmental & Geomatic Engineering.
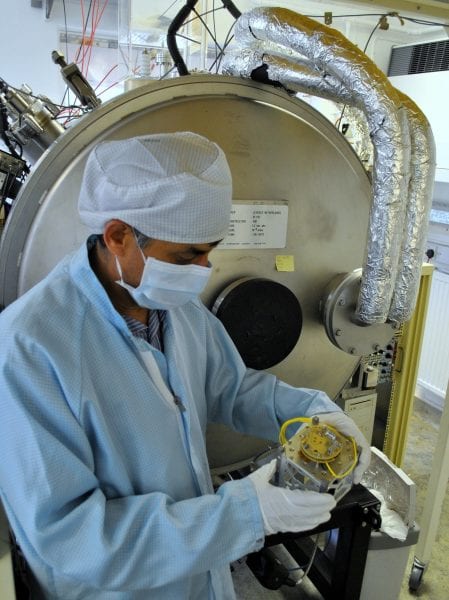
Dhiren Kataria holding the UCLSat designed and built at MSSL

Dhiren Kataria holding the UCLSat designed and built at MSSL

Vishal used his experience to write several sophisticated computer programs to calculate drag coefficients from simulations of a cubesat orbiting in our 3-dimensional atmospheric model called CMAT2. This work was subsequently built upon by Dr Aruliah’s 4th year project student, Jennifer Hall. Jennifer wrote her own programs to derive and compare satellite drag coefficients from CMAT2 simulations and EISCAT radar measurements. Jennifer’s project won the UCL Physics & Astronomy Tessela prize for best use of computer technology in a 4th year project.
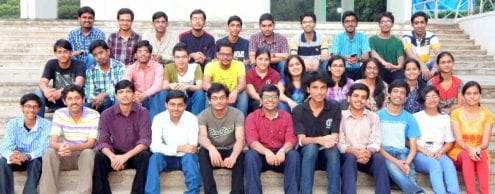
IIT Pratham group

Pratham team at the Indian Institute of Technology Bombay. Vishal Ray is 2nd from the right in the top row.

One year on, after a busy 3rd year of studies, Vishal has written up his summer project as a journal paper, and “Pratham” was scheduled for launch at 0530 UTC on the 26 September 2016. The IIT Bombay student team installed their cubesat on the launch vehicle PSLV C-35 on the remote island of Sriharikota in South India. Vishal said that he “…had goosebumps when we actually placed the satellite on the launch vehicle module and completed the testing for one last time!”. “Pratham” was successfully launched and will measure the total electron count from 800 km altitude in a Sun Sychronous Orbit. MSSL were the first to receive Pratham’s beacon signal, which the students were incredibly excited to hear. You can hear the cubesat from 4:20 onwards as it passes within range of the detector at MSSL. The signal is decipered as “Pratham IIT Bombay Student Satellite”. The accompanying image is of Theo Brochant De Viliers (MSSL) beside the MSSL receiver.

https://soundcloud.com/uclsound/signals-from-the-pratham-cubesat-satelllite

The prospect of finally being launched is very exciting, with both projects having been nearly 10 years in the making. Once launched, the missions will change from the technical challenges of the innovation of miniature sensor devices to the scientific challenges of collecting, analysing and interpreting the measurements. The rewards will be great: from the new technologies surrounding cubesats; to the training of future space scientists and engineers, and to the Space Weather community.

Hidden in the archives: Finding the first-ever evidence of exoplanetary system

By Oli Usher, on 13 April 2016

You never know what hidden treasures can be uncovered in the archives.

And this was certainly the case at Carnegie Observatories’ collection when research for an article led to the unexpected discovery of a 1917 glass plate showing the first-ever evidence of a planetary system beyond our own Sun.

It all started last year when UCL astrophysicist Dr Jay Farihi contacted Carnegie Observatories’ Director, John Mulchaey, whilst researching an article on planetary systems surrounding white dwarf stars. Farihi was searching for a glass plate that contained a stellar spectrum of van Maanen’s star – a white dwarf discovered by Dutch-American astronomer Adriaan van Maanen.

The 1917 photographic plate spectrum of van Maanen's star from the Carnegie Observatories’ archive.

The 1917 photographic plate spectrum of van Maanen’s star from the Carnegie Observatories’ archive.

(more…)

Total eclipse of the Moon

By Oli Usher, on 28 September 2015

lunar-eclipse_2015-09-28

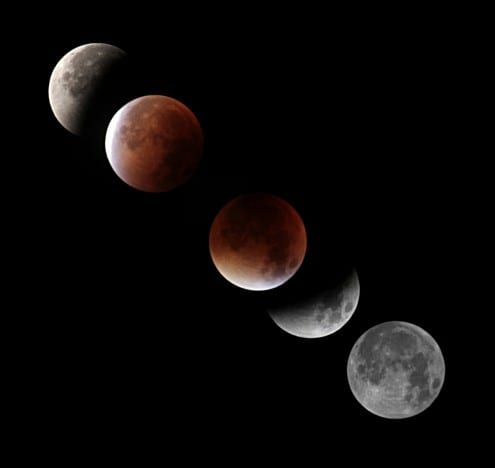
Last night saw both a supermoon (the Moon’s closest approach to Earth, in which it appears about 14% bigger than it does at its most distant), and a lunar eclipse, in which the full Moon passes through the Earth’s shadow.

During a lunar eclipse, the disc of the Moon progressively goes from bright white to a deep red: when in the Earth’s shadow, the only light illuminating its surface is the light that is bent through Earth’s atmosphere. This light – effectively, the light of all the sunrises and sunsets on Earth – is red because blue light is scattered in Earth’s atmosphere.

This sequence of photos was produced by Theo Schlichter, Computing and Instrumentation Officer at UCL’s observatory, using a Canon EOS450D camera and a 200mm lens. The composite was produced by Dr Steve Fossey.

First person: 8.3 magnitude earthquake hits Chile

By ucapola, on 23 September 2015

A combination of high mountains, clear skies and bone-dry deserts makes the north of Chile one of the world’s best places to observe the sky. Numerous international observatories are located there, and astronomers from around the world frequently travel there to carry out their research. Ofer Lahav, Perren Professor of Astronomy at UCL, was there during the magnitude 8.3 earthquake of 16 September. This is his personal account of the events.

Cerro Tololo Inter-American Observatory. Photo: Ofer Lahav

The Blanco 4-metre telescope at Cerro Tololo Inter-American Observatory. Photo: Ofer Lahav

The Earthquake started on Wed 16 Sep at 19:54 (local time), just as we were preparing for the start of DES (Dark Energy Survey) observations.

We left the telescope immediately, and moved to the shaky ground outside the dome. Eventually we were evacuated from there to the CTIO dining hall.

The team was evacuated to the observatory's dining hall - Ofer Lahav is leftmost.

The team was evacuated to the observatory’s dining hall – Ofer Lahav is leftmost.

After-shocks continued throughout the night, but the oscillations finally decayed.

The following morning was sunny and quiet. Observations resumed the following night.

Boulders dislodged from the mountainside and fell onto the road near the observatory. Photo: Ofer Lahav

Boulders dislodged from the mountainside and fell onto the road near the observatory. Photo: Ofer Lahav

I left next morning as planned, flights were on schedule.

We were all impressed by the way the observatory staff handled the situation efficiently and calmly.

It is re-assuring that the system, in part assembled at UCL, is working so well – the only obstacles between the DECam instrument and the galaxies are the Earth’s atmosphere and quakes…

The astronomers who didn’t stop for a missile strike (or a flat battery)

By Oli Usher, on 18 September 2015

This remarkable document comes from the observing log of the University of London Observatory. The observatory is now a UCL teaching facility and part of the Department of Physics & Astronomy, but at the time was an important research facility.

It reveals the effect of the Nazi bombing of London during the second world war.

paper

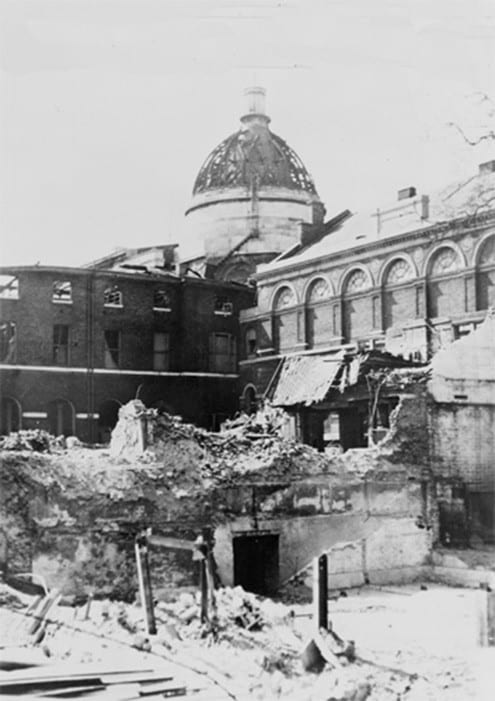
UCL’s Bloomsbury campus was severely damaged in raids early in the war, with the Library’s dome destroyed and the historic buildings around the main quadrangle all gutted by fire.

bombdamage

Relentless bombing from aircraft early in the war, then by V1 and V2 missiles later in the war brought the conflict close to Londoners, and the unperturbed tone of the log makes clear how commonplace it had become – even in the quiet suburban environment of Mill Hill, where the observatory is located.

The log reads:

1944 August 3

Opened 21h. Sky clear.

Found red light on spectrograph not workingm, owing to plug having been left in and battery run down. Set on γ Cas with the help of dark room red light.

I started exposure at 21h 44m GMT.

Flying bomb exploded very close and shifted star in declination out of the field.

Star recovered and exposure restarted at 21h 47m GMT.

Just after starting the second time, a second flying bomb exploded. This was more distant and though it shifted image from the [spectrograph] slit, star did not go out of field and was quickly recovered.

Exposure ended 22h 07m GMT.

Exposure time = 20m.

Plate developed.

Closed 22h ½.

EMP CCLG

The event was a V1 flying bomb strike on nearby Hendon, which killed eight and destroyed 193 houses.

The signatures on the end of the document are of historical note too – alongside CCL Gregory, the director of the observatory, was EM Peachey. She is better known today under her married name of Margaret Burbidge. At the time, she was a young astronomer who had just passed her PhD, but she went on to become one of the preeminent astrophysicists of the twentieth century.

The observatory will be holding a one-day astronomy event in the Quad on 2 October, and an exhibition of astronomical images produced by UCL staff and students using its telescopes will be held along the walls of the North Cloisters throughout the term.


The most distant galaxy

By Oli Usher, on 6 August 2015

EGSY8p7 The blurred, faint, orange speck at the centre of this image may look unremarkable, but it is the most distant galaxy ever to have been confirmed by scientists. Called EGSY8p7, the galaxy was identified by UCL PhD student Guido Roberts-Borsani in the Hubble image above, based on its unusually reddened colour profile.

Followup observations using the WM Keck observatory by a team including Roberts-Borsani and UCL astrophysicist Richard Ellis have confirmed the find. Splitting the light into its component colours, the spectrograph at the observatory showed that the galaxy’s spectrum was shifted far towards the red end of the spectrum by the expansion of the cosmos. This ‘redshift’ is an unmistakeable sign of an extremely distant object.

It is at a redshift of 8.68, meaning we see it as it was when the Universe was only about 4% of its current age. Its light has been travelling for over 13 billion years on its long journey to us.

Read more about the research.

Vintage space: Venus in 1991

By Oli Usher, on 28 July 2015

On 5 May 1989, the Space Shuttle Atlantis released the Magellan probe into low Earth orbit.

A short while later, Magellan’s rockets fired, sending it towards the sun.

Magellan being deployed from the Space Shuttle Atlantis on 5 May 1990. Photo: NASA (public domain)

Magellan being deployed from the Space Shuttle Atlantis on 5 May 1989. Credit: NASA

Swinging around our star, it arrived at its destination 15 months later: the planet Venus.

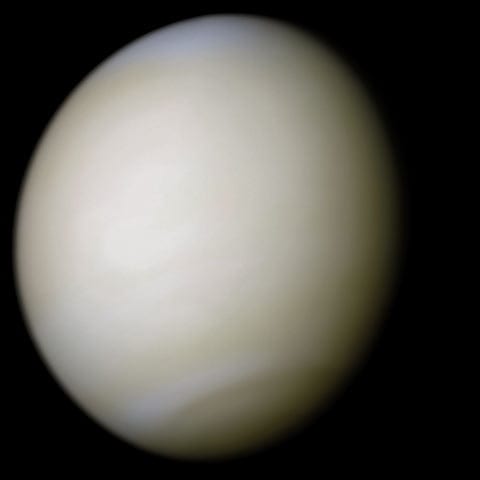
Venus is in some respects the most Earth-like planet in the Solar System. It is a similar size to our planet, has a rocky surface and a thick cloudy atmosphere. However, it is much closer to the sun, and thanks to its atmosphere, experiences a powerful greenhouse effect.

The planet Venus, seen by Mariner 10. Credit: NASA (processing by Ricardo Nunes)

The planet Venus, seen by Mariner 10. Credit: NASA (processing by Ricardo Nunes)

Surface temperatures there are well over 400 degrees Celsius, atmospheric pressure is similar to what submersibles experience a kilometre down into Earth’s oceans, and the ‘air’ of Venus’ atmosphere is full of sulphuric acid.

Exploration of Venus’ surface has been in the form of brief snapshots, taken in the few tens of minutes that landers survive the harsh conditions there. All the landers so far have been Soviet; UCL has a number of their photos in its Centre for Planetary Sciences’ image archive (with a selection available online in high resolution).

The surface of Venus seen by the Venera 13 probe. Credit: UCL RPIF

The surface of Venus seen by the Venera 13 probe. Credit: UCL RPIF

Observing Venus from space is less challenging – and less rushed.

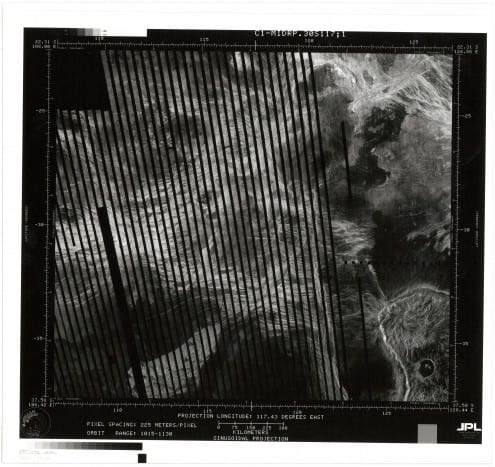
Between 1990 and 1994, Magellan was able to study the planet’s surface at leisure from its position high above the atmosphere. Because of the thick clouds, its images had to be produced by radar rather than optical photography, so they are not in colour. But they are extremely sharp.

Here is one of these images, held in UCL’s archives:

magellan-synthetic-aperture-radar

One of Magellan’s radar images of Venus’ surface. (The image is squint in the original!). Credit: UCL RPIF

Most of the highly processed images from Magellan are produced by multiple passes of the spacecraft over the planet’s surface, building up a complete image of the surface. This particular picture, however, is incomplete, revealing how Magellan’s images are put together. The black stripes show the gaps between the strips observed during different orbits of the planet.

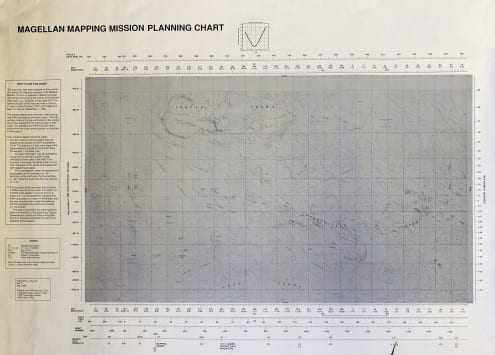
Also in UCL’s archives are some of the planning documents NASA produced as part of the mission, including this full map of the planet’s surface:

magellan-planning-chart-cc

Planning chart for the Magellan mission. Click here for labelled image showing the location of the above radar map. Credit: UCL RPIF

 Links


Pluto and Charon: A planetary waltz

By ucrhmon, on 14 July 2015

NASA’s New Horizons probe is flying past Pluto today, after years of travel. It is the first ever probe to visit the Pluto system. Here, Minna Orvokki Nygren (UCL Science & Technology Studies) describes a unique art-science collaboration commissioned by UCL & Birkbeck’s Centre for Planetary Sciences to celebrate the event.

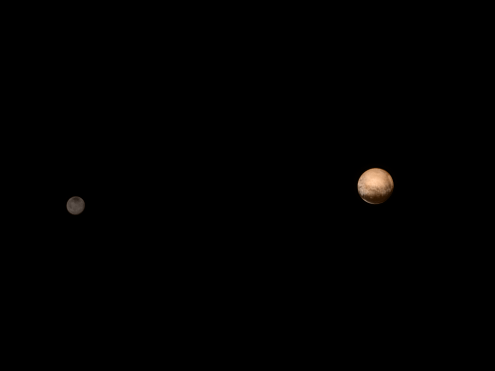
Pluto and its moon Charon, seen by New Horizons last week. Photo: NASA

Pluto and its moon Charon, seen by New Horizons last week. Photo: NASA

Pluto and Charon – A Planetary Waltz was composed in collaboration between composers Catherine Kontz and Minna Orvokki Nygren. The work was commissioned by the Centre for Planetary Sciences UCL/Birkbeck (CPS) and it received its premiere on the 24th of June 2015 at An Evening with the Planets event at the UCL by pianists Valentina Pravodelov and Kerry Yong.

The main organiser of the event, Professor Steve Miller’s support and enthusiasm towards the project were crucial in realising this new work.

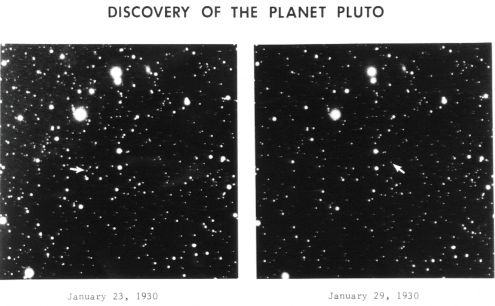
The piece was inspired by two photographic plates that led to the discovery of Pluto in 1930 by amateur astronomer Clyde W. Tombaugh.

The discovery images of Pluto

The discovery images of Pluto

These plates were used to devise the overall form for the musical work. The distance the bodies travelled across the sky and their relation to other bodies was reflected in the music. When seemingly further away from other celestial bodies, the warped “waltz” of Pluto and Charon, written in 5/4 time, takes over with its prominent bass line and thick chords.

A key aspect of the composition is its gestural dimension which the pianists take on during performance, such as switching seats with each other as in an “orbital ballet,” or the use of custom planetary mallets applied to the piano interior marking off specific movements in the piece.

Other features, such as the size, temperature, consistency and albedo of the bodies were also part of the compositional process. The dwarf planet Pluto being approximately twice the size of Charon is given a more powerful and majestic voice in the work, while its counterpart Charon’s music is lighter, slower and mysterious. The Kuiper belt’s chilly conditions are reflected in the piece by combining extremely high and low pitches of the piano, and giving them an ethereal resonance through the use of distinct pedalling.

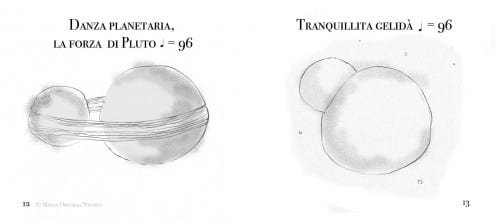
An illustrated score of Pluto and Charon was created to give the audience an opportunity to follow the movement of the bodies and the musical piece.

Illustrations from the score (© Minna Nygren, all rights reserved)

Illustrations from the score (© Minna Nygren, all rights reserved)

Related links


Hitting rewind on cosmic history

By Oli Usher, on 9 July 2015

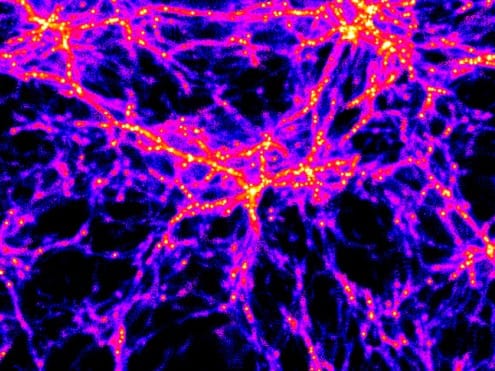
The universe is not smooth. Stars are clumped into galaxies. Galaxies are bound in clusters. And the clusters follow a vast universe-wide web of dark matter filaments, with huge voids between them.

Seeing how this web has changed over galactic history is one of the holy grails of astronomy.

A computer model of the filamentary structure of the universe at the age of about 2 billion years. Credit: ESO (CC-BY)

A computer model of the filamentary structure of the universe at the age of about 2 billion years. Credit: ESO (CC-BY)

Astronomers now know that the universe is not only expanding, but is doing so at an ever increasing rate. The driver for this expansion, dubbed ‘dark energy’, however, is still a mystery. Even its most basic properties, such as how it has affected the structure of the universe over time, are the subject of continued scientific debate.

If we could turn back the clock, and see snapshots of the how the universe looked at stages throughout its history, we would take a huge step closer to understanding dark energy.

Fortunately, two major projects currently under way are doing this: the Dark Energy Survey (DES) and the Kilo Degree Survey (KiDS). UCL scientists are closely involved with both, and the KiDS project has this week released its first data.

Over the next few years, KiDS will use the ESO VLT Survey Telescope in Chile to produce a detailed colour image of 1500 square degrees of sky (equivalent to a square 80 times the height and width of the full Moon). A parallel project will map the same area in five wavelengths of infrared light.

The ESO VLT Survey Telescope at Paranal Observatory in Chile. Credit: ESO (CC-BY)

The ESO VLT Survey Telescope at Paranal Observatory in Chile. Credit: ESO (CC-BY)

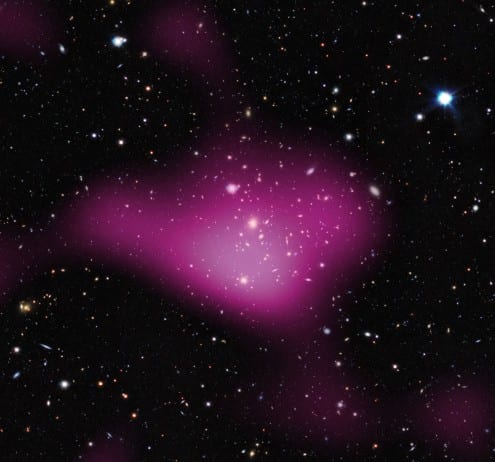
As light from distant galaxies and quasars passes through the cosmos, its path is slightly bent by the gravity of objects in the foreground, an effect known as gravitational lensing. Scientists can use these subtle distortions to map where the mass is located in an image – revealing the location not only of the mass of the visible galaxies, but of the dark matter. Dark matter, as its name suggests, neither emits nor reflects light, so its presence can only be inferred from this type of painstaking detective work.

This week’s first data release from KiDS only covers about a tenth of the total area of sky that will be studied in the project, but it has already produced its first useful maps of the location of dark matter.

The first dark matter map from the KiDS survey, showing the inferred location of the dark matter in pink. Credit: ESO (CC-BY)

The first dark matter map from the KiDS survey, showing the inferred location of the dark matter in pink. Credit: Kilo-Degree Survey Collaboration/A. Tudorica & C. Heymans/ESO (CC-BY)

The next step is to move back through time. This is difficult but not impossible. As the universe expands, it stretches the waves of light that pass through it. The further away you look, and the further back in time you see, the redder this makes the objects appear.

KiDS, along with its infrared counterpart, will record the colour of each object through nine different coloured filters – giving enough information on the colour profile to estimate the distance of each galaxy. Through this, it will be possible to dial back time, observing the distribution of mass at various points going back through time, charting how the size and structure of the dark matter filaments has changed throughout cosmic history.

Current theories about dark energy suggest that we should see structures rapidly growing in the early universe, with this gradually slowing down over time – and KiDS will help test whether this is indeed the case.

UCL is involved in KiDS through Benjamin Joachimi, Edo van Uitert (both UCL Physics & Astronomy) and Tom Kitching (UCL Mullard Space Science Laboratory). They work mainly on analysing the gravitational lensing effects detected in the survey.

These lensing effects can be quite dramatic – high resolution images of large galaxy clusters taken with the Hubble Space Telescope show dramatic distortions in the shapes of background galaxies.

Gravitational lensing can dramatically distort the shapes of background galaxies, as can be seen in this Hubble image which shows galaxies distended into arcs around the cluster's centre of gravity. Credit: NASA/ESA (CC-BY)

Gravitational lensing can dramatically distort the shapes of background galaxies, as can be seen in this Hubble image which shows galaxies distended into arcs around the cluster’s centre of gravity. Credit: NASA/ESA (CC-BY)

But in most cases the effect is actually very subtle – a tiny modification of the shapes of thousands of galaxies, which appear as barely more than dots in the background.

For each one of these dots, it’s impossible to say whether the shape it appears to us is down to it genuinely being slightly flattened – or whether this is a result of the light from the galaxy being distorted by gravitational lensing.

But if you look at thousands of galaxies, you can tease out the statistical likelihood – for instance, if thousands of galaxies all appear flattened in the same direction, it’s likely to be because an unseen mass of dark matter is distorting them all in the same way.

These measurements rely on extremely accurate modelling of how the telescopes work and of precisely how lensing effects occur – to the extent of even producing dummy data to test their assumptions and calibrate the observations.

A simulated image of lensed galaxies, developed by scientists to calibrate their analysis of real telescope data

A simulated image of lensed galaxies, developed by scientists to calibrate their analysis of real telescope data. Credit: R. Herbonnet/E. van Uitert

The primary goal of the KiDS project is to find out more about the evolution of the cosmos and to test the laws of gravity and general relativity.

KiDS is in friendly competition with the Dark Energy Survey to do this. To an outsider this might look like a waste of resources – but this is the cutting edge of cosmology and in truth nobody really knows what we will find. If both KiDS and DES come up with the same result, despite their different telescopes, detectors and methods, then we can have some confidence that the conclusions are accurate.

Of course if they don’t, then we’re back to square one. But at least we’ll know that we don’t know.

Related links


Positronium beam

By Oli Usher, on 7 July 2015

UCL's Positronium Beam

UCL’s Positronium Beam

Positronium is an exotic atom made up of an electron and a positron in orbit around each other. Positrons are the antimatter equivalent of electrons, so these particles are highly unstable composite particles made up of both matter and antimatter.

Because of this, positronium atoms only last a few nanoseconds before the matter and antimatter annihilate each other.

Despite their short lives, these peculiar particles have interesting features – including being able to form compounds despite not actually being an element.

UCL is home to the only positronium beam in the world. In this device, positrons created by a radioactive source pass through a chamber of hydrogen gas, where they pick up electrons, before being guided towards a target.

Standing by the Positronium Beam in this photo are UCL PhD students Andrea Loretti (left) and Sam Fayer (right), both from the Department of Physics & Astronomy.

High resolution images

Links