 Close
Close

A world map for website health checks with Grafana
By t.band, on 30 June 2021
UCL’s Geochronology software “IsoplotR” is available as an R package (just the calculations or with a web GUI) or online in a number of different locations. We already have Prometheus installed on one of our machines collecting metrics from various pieces of software we have running, and we have Grafana to display nice dashboards of these metrics. But could we add a little world map with little green or red dots for whether the various IsoplotR installations are up or down?
IsoplotR does not export Prometheus metrics, but polling the /version.txt HTTP endpoint on IsoplotR’s web interface should be enough to tell if it is running. So it looks like we need some sort of exporter to translate from “can I hit /version.txt” to something Prometheus is happy with. There is of course a standard, official way to do this, but it is not obvious from the documentation. The answer is the Blackbox Exporter.
How do we use the Blackbox Exporter? Once again, the documentation is not clear. Do we configure Blackbox? Or do we configure Prometheus? Or both? My guess that configuring Prometheus would work nicely was borne out; just cargo-culting the example configuration and changing the list of endpoints to poll was enough.
I decided to run Blackbox from a Docker image, but the documentation here says to run:
docker run --rm -d -p 9115:9115 --name blackbox_exporter \
    -v `pwd`:/config prom/blackbox-exporter:master \
    --config.file=/config/blackbox.yml
But this just results in errors in the log, because we haven’t made a blackbox.yml file (and don’t want to). So instead we run:
docker run --rm -d -p 9115:9115 --name blackbox_exporter \
    prom/blackbox-exporter:master
That’s better!
curl "http://127.0.0.1:9115/probe?module=http_2xx"\
"&target=http://chinageology.org:8080/version.txt"
Produces some nice Prometheus output.
So having added the configuration to Prometheus and restarted it, we can check that it works from the Prometheus web front end. So I need a PromQL query. Eventually I figured out that the Prometheus output we got in the last stage was going to be a huge clue, so I tried this:
probe_success
and got a list of websites with their up/down status!
Now on to Grafana. We will need to add a world map plugin. I installed Grafana as a snap in Ubuntu Server, so the commands needed to install this plugin were different from the documentation:
sudo grafana.grafana-cli plugins install grafana-worldmap-panel

snap restart grafana
Now, looking at my Grafana browser tab I was expecting to see this Worldmap panel to be available. But it wasn’t. I could see it in the plugins list, but the new panel type wasn’t available to choose. It took me way too long to hit F5 and see if a refreshed page would show it to me. It did.
Now the tricky bit. We know I want “probe_success” as the PromQL query, but the Worldmap panel has confusing options. Should I be using Table or Time Series output? Table didn’t work for me, producing a Data error “TypeError: this.datapoints is undefined”. So, Time Series it is. Worldmap has options for how to get the locations: “country”, “state”, “geohash”… none of these are right; I don’t have anything in the query or values returned that mentions the location of the website polled. We probably have to go with “json endpoint” which allows us to provide a mapping from … something … to a location. But map from what?
Eventually this is what I figured out: the Worldmap panel looks at the legend of the data and tries to turn that into a location. If you choose “json endpoint” you can supply your own mapping. So, I set the query legend to:
{{instance}}
Then I added a json file in /var/www/html where an nginx installation on the same machine would see it and serve it up. The file looks a bit like this:
[
 {
  "key": "http://isoplotr.es.ucl.ac.uk/version.txt",
  "latitude": 51.525304,
  "longitude": -0.133806,
  "name": "London"
 },
 {
  "key": "http://isoplotr.geo.utexas.edu/version.txt",
  "latitude": 30.285623,
  "longitude": -97.736181,
  "name": "Austin"
 },
 ...
]
And I checked I could load this file in a browser from another machine (this might be overkill). Then on the Worldmap panel setting I could set “Location Data” to “json endpoint” and “Endpoint url” to the URL that serves up the JSON. And it worked! A few tweaks to make it look nice (like setting a single threshold to 1 and the colors to red and green) and we have our map!
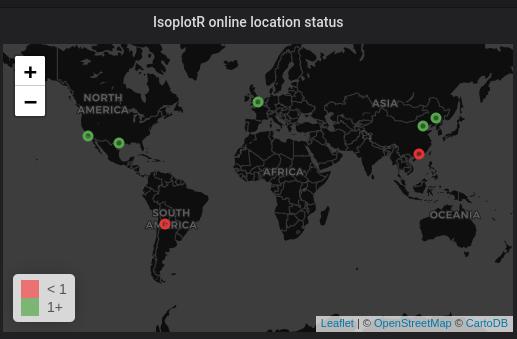
So, not the most elegant or robust solution (I’ll have to maintain that isopotr-locations.json file by hand instead of being able to have the locations in with the Prometheus configuration) but it looks nice.