X Close

Research Department of Primary Care and Population Health Blog

Home

Menu

Archive for the 'THIN' Category

Health indicator recording in UK primary care electronic health records: key implications for handling missing data

By Nathan Davies, on 13 March 2019

In this post Tra My Pham talks about their latest paper which has investigated the recording of data in UK primary care electronic health records and the implications this has on conducting research using these records. 

GP electronic health records provide a large amount of information and data for medical research. These information source help us to study individuals’ health over time, and offer many opportunities for research into populations that would otherwise be difficult and/or expensive to undertake.

Large UK primary care databases (GP electronic health records) capture information on key health indicators such as height, body weight, blood pressure, cholesterol level, smoking status, and alcohol consumption. These are relevant risk factors for many health conditions including diabetes and heart diseases, which remain leading causes of the global disease burdens. In primary care when patients register with their GP practices, it is typical that their past and current medical history is documented. Most individuals will have a record of the above health indicators as part of their registration. Thereafter, this information is mainly recorded if it is directly relevant to the patients’ care, ie, some patients will have several records over time while other will only have a few. Therefore, data can often be incomplete, which poses a challenge for their use in research. In this study, we aimed to further understand how common health indicators are recorded in the UK primary care setting, and whether there are potential implications for dealing with incomplete data in medical research.

We analysed records of height, body weight, blood pressure, cholesterol level, smoking status, and alcohol consumption from 6.3 million individuals aged 18–99 in The Health Improvement Network (THIN) database during the period 2000–2015. There were differences in the recording of these health indicators by sex, age, time since registration with the GP practices, and disease status. In particular, women aged 18–65 years were more likely than men of the same age to have these health indicators recorded, and this gap narrowed after age 65 (Figure 1). More than 60% of individuals had their health indicator data recorded during the first year following registration with their GP practices. After that, this proportion fell to only 10–40%. The recording of relevant health indicators were more regular among individuals with chronic diseases compared to those without, eg, body weight being measured more frequently for diabetes weight management (Figure 2).

Health indicator recording in general practices followed, to some extent, the GP consultation patterns by age and sex. In particular, younger women were more likely to see their GPs than younger men. Therefore, it seemed likely that for women, many weight and blood pressure measurements may have been taken in conjunction with their consultations for contraception and pregnancy. Our results suggested that many practices offered general health checks for their newly registered patients, during which patients’ health indicators were recorded. A GP incentive scheme was introduced in 2004, under which GPs receive financial payments based on quality targets and they have to record data, eg, health measurements, in order to meet these targets. Since this scheme began, many individuals with chronic conditions have had their health indicator measurements recorded on a more regular basis, which was reflected in our findings.

For health research studies using primary care databases, incomplete information on common health indicators will affect statistical analysis. In particular, analyses based on the available information alone may be misleading. It is standard in medical research to overcome the problem of incomplete data by using a statistical method called multiple imputation. The method involves using the data collected to estimate the unseen data (several times for each unseen value), so that analysis can proceed as though complete data had been collected. Based on the findings of our study, multiple imputation taking into account the differences in health indicator recording by individuals’ demographic characteristics and disease status is recommended, but should be considered and implemented carefully.


Our article and relevant references can be found at:

Petersen I, Welch CA, Nazareth I, Walters K, Marston L, Morris RW, Carpenter JR, Morris TP, Pham TM (2019). Health indicator recording in UK primary care electronic health records: key implications for handling missing data. Clinical Epidemiology, 2019 (11) pp. 157-167. https://doi.org/10.2147/CLEP.S191437.  

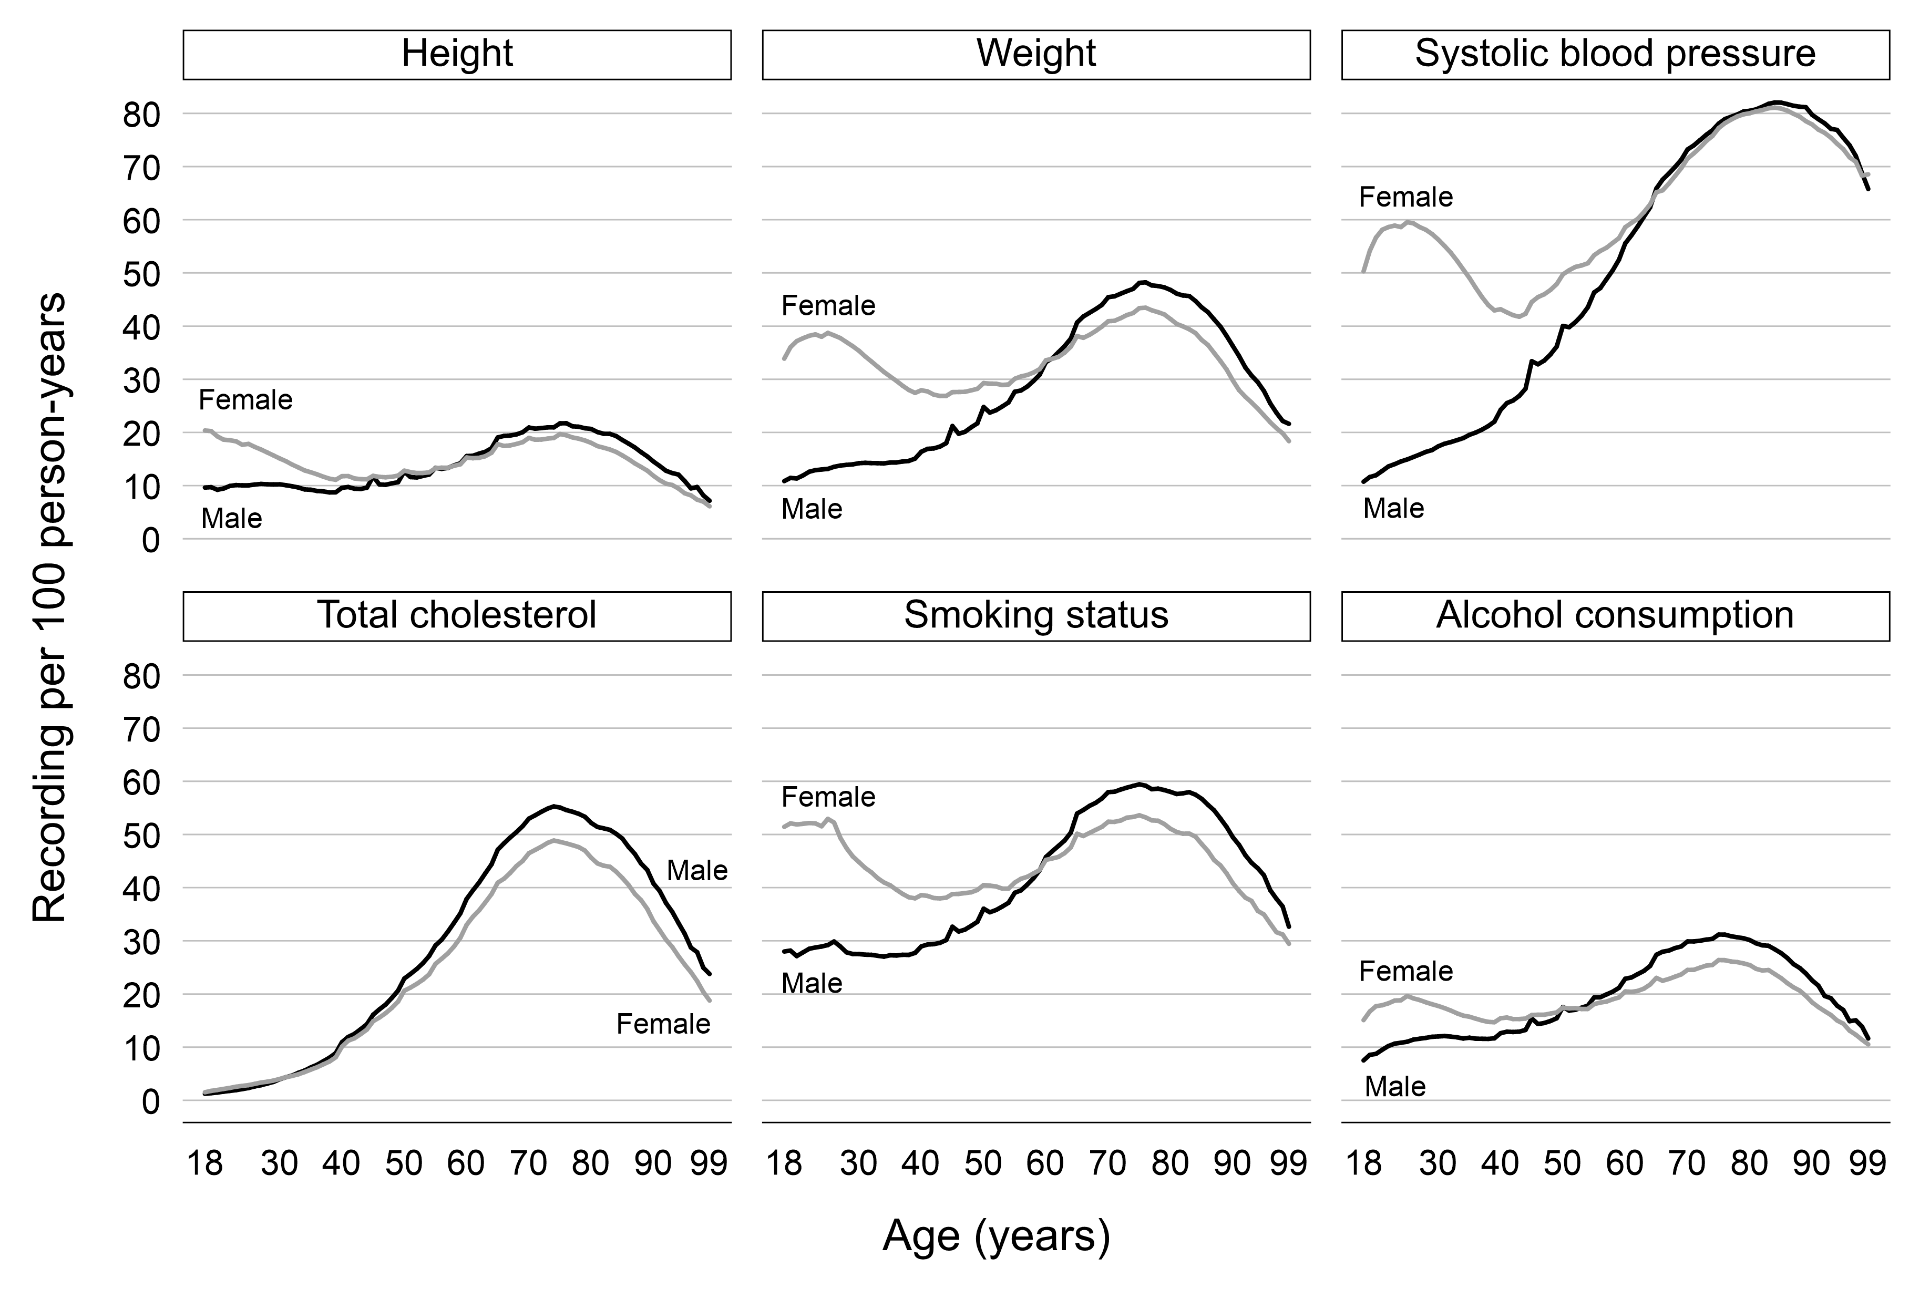
Figure 1. Number of records of each health indicator per 100 person-years by sex and age (in years).

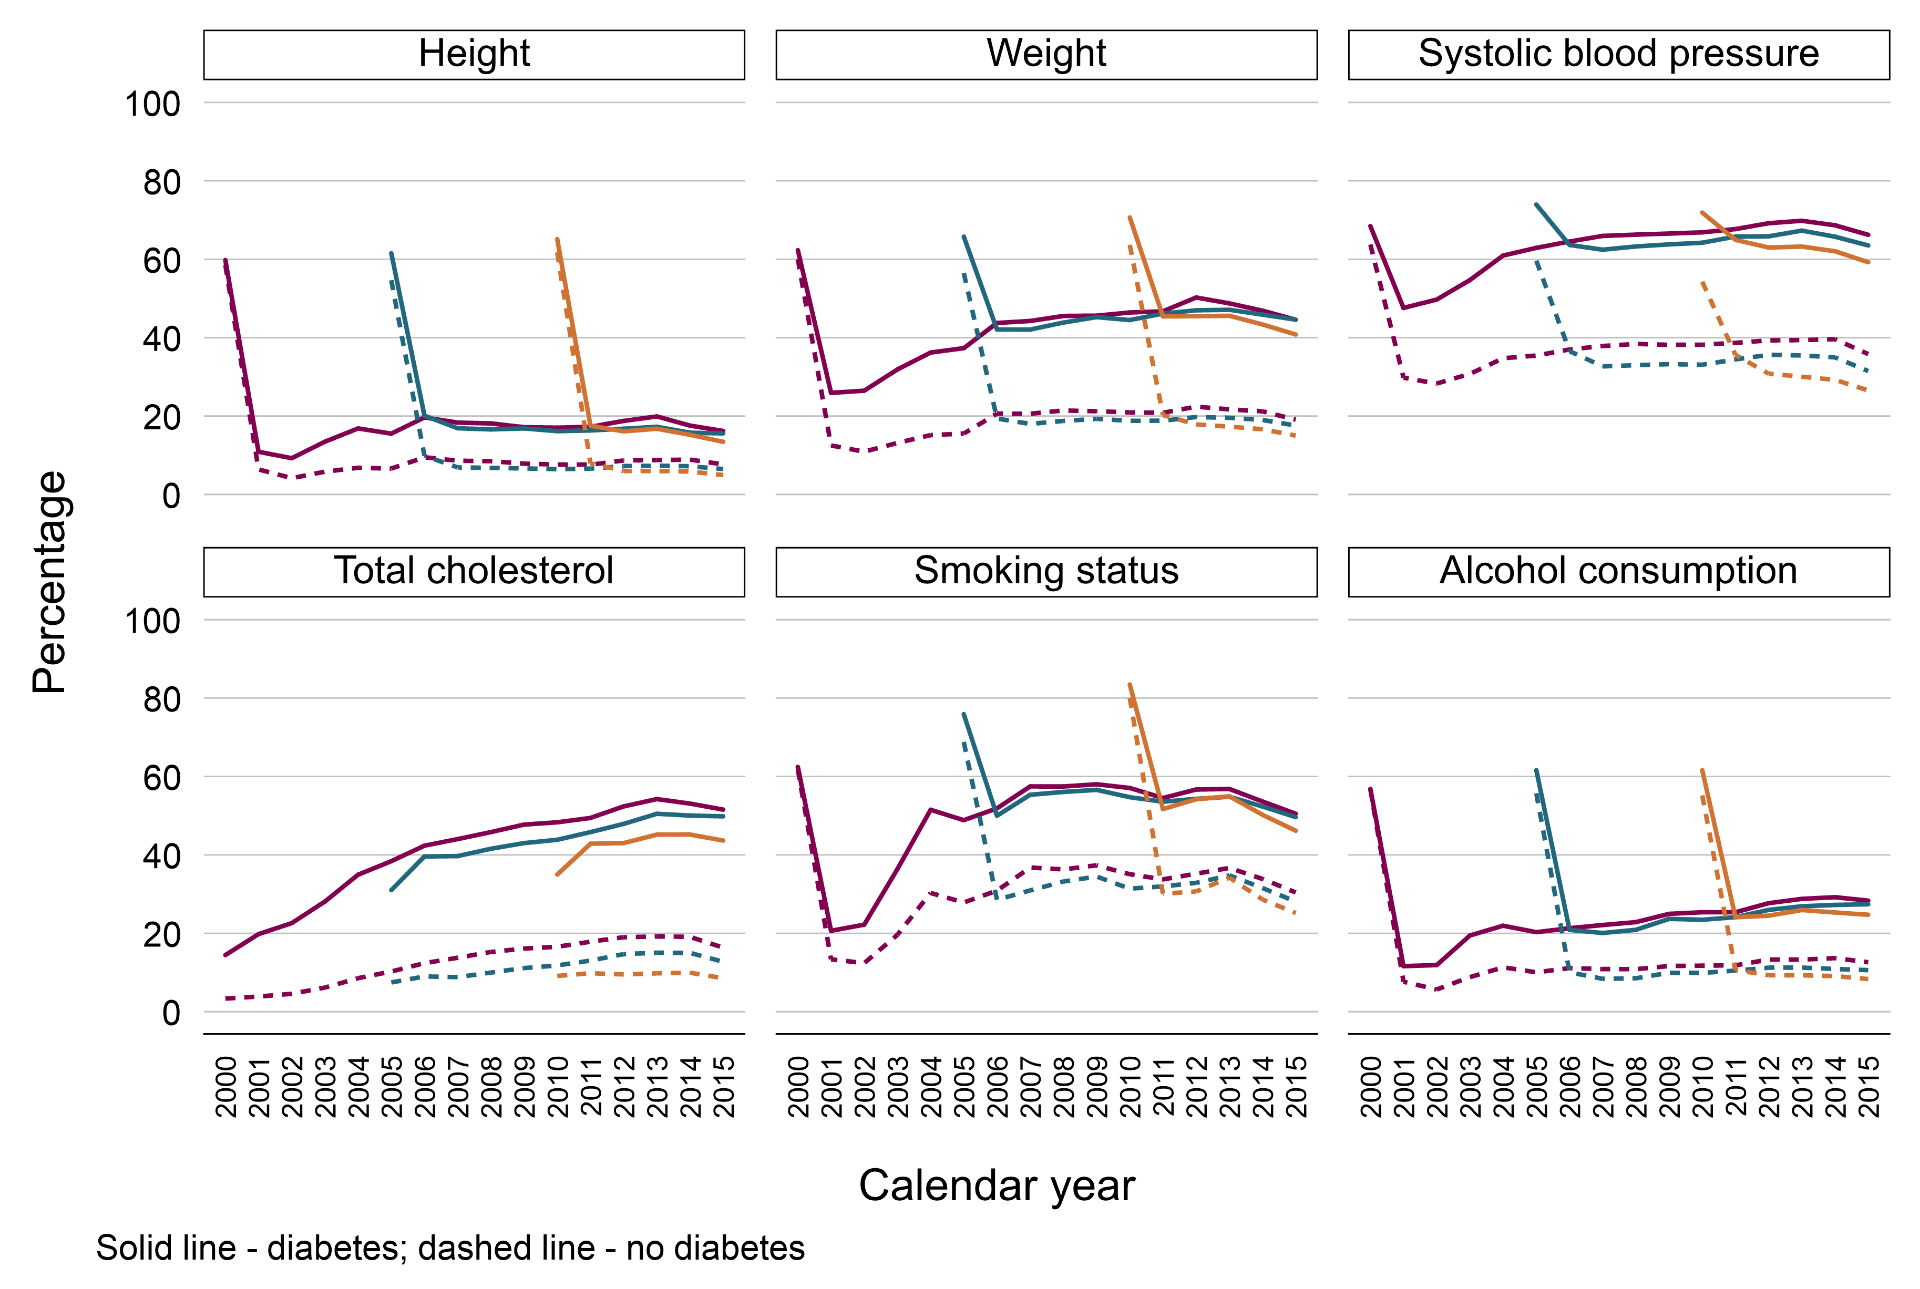
Figure 2. Percentage of individuals with a record of each health indicator in the 2000 (purple), 2005 (teal), and 2010 (orange) registration cohorts by calendar year and disease status.
Note. Solid line – diabetes; dashed line – no diabetes.

“Why am I doing this?!” A reminder.

By Nathan Davies, on 6 September 2018

I have been assured that asking oneself “Why am I doing this?!” is not an experience unique to any one stage of a research career. The key is having a good answer.

At the height of the British summer heat wave, I travelled to Chicago, to give an oral presentation to the Alzheimer’s Association International Conference (AAIC) on a project I’ve joined, funded by the Dunhill Medical Trust, addressing inequality in primary care of people with dementia among UK ethnic groups.

The first phase of the project has already been published in Clinical Epidemiology and found that dementia diagnosis incidence was significantly higher in Black men and women compared to White men and women, respectively, and was significantly lower in Asian women compared to White women. Tra recently wrote a blog on this below. I presented these results along with new results showing inequality by ethnicity in prescribing of certain drugs among patients with dementia.

The presentation itself went smoothly, and I breathed a sigh of relief as I walked off stage. With the nerves and the bright lights out of the way, I was excited to find that a queue of people were keen to talk with me about the project.

Multiple researchers expressed how grateful they were that someone was looking into this area, highlighting that while the demographics of many developed nations are changing, the research has not often kept up. Others wanted to share personal experiences, speaking of the reluctance of family members to seek a diagnosis or medication even as their condition progressed, especially when cultural factors around memory problems and fear of stigma were at play. These conversations made clear that the need to identify inequalities and break down barriers to good quality care was not a problem unique to the UK, but everyone I spoke with reinforced how important it was to see that we’re working on it.

In the midst of Stata code, funding applications, and reviewer comments, we can lose sight of the goal. As researchers, we have the privilege of generating work that can improve peoples’ lives. We can be reminded of that by our Patient & Public Involvement advisors, our colleagues, or a review of the “Impact” section of our own funding application (and hopefully by this blog post). My conversations with a variety of people after my presentation was a wonderful reminder of the goal and impact of this project. I hope you can take a moment today to remember the goal of your work too, because you’re doing this for a good reason!

A comparison of new dementia diagnosis rates across ethnic groups in UK primary care

By Nathan Davies, on 31 August 2018

In this post Tra Pham discusses her recent work with colleagues from the department, Division of Psychiatry and King’s College London on new diagnoses of dementia and the differences among ethnic groups.

Around 46.8 million people worldwide have dementia; this is expected to rise to 131.5 million by 2050. Recent studies have reported stable or declining rates of new dementia cases overtime.

In 2010, members of our department (Rait et al, 2010, BMJ) conducted a primary care database study to investigate survival of people with a diagnosis of dementia, and reported a stable rate of new dementia diagnoses in UK primary care between 1990 and 2007. We know little about the differences in the likelihood of receiving a dementia diagnosis among different ethnic groups. Some evidence has indicated that people from Black and Minor Ethnic (BME) groups present at services (i.e. GP) later in their illness. Therefore, compared with the White British ethnic group, BME dementia patients may have less access to timely diagnosis. This can prevent them from benefiting from early intervention and treatment which may help slow the progression of the disease.

Our recent study reported the overall rate of new dementia diagnoses in UK primary care between 2007 and 2015. In addition, we reported, for the first time, the rate by White, Asian, and Black ethnic groups. Pulling together current best evidence of new dementia cases in the community and the 2015 UK census data, we estimated the proportion of White and Black people developing dementia who received a diagnosis in 2015. Our hypothesis was that there would be a smaller proportion of Black people with dementia who were diagnosed compared with people from the White ethnic group.

We analysed data of 2.5 million older people from The Health Improvement Network (THIN) database. 66,083 new cases of dementia were identified, which corresponded to an increased rate of new dementia diagnoses between 2007 and 2015 (Figure 1).

Figure 1 Rate of new dementia diagnoses per 1,000 person-years at risk (PYAR) by calendar year in The Health Improvement Network (THIN) UK primary care database.

Compared with White women, the dementia diagnosis rate was 18% lower among Asian women and 25% higher among Black women. This rate was 28% higher among Black men and 12% lower in Asian men, relative to White men. Based on diagnosis rates in THIN data and projections of new dementia cases from community cohort studies, we estimated that 42% of Black men developing dementia in 2015 were diagnosed, compared with 53% of White men.

The results thus suggest that the rates of people receiving a diagnosis may be lower than the actual rates of developing dementia in certain groups, particularly among Black men. There are several possible explanations for this. It could indicate that Black men experience barriers to accessing health services or receiving a diagnosis. GPs may be more reluctant to diagnose dementia in BME groups especially if culturally competent tests are unavailable. GPs and families might also be reluctant to name dementia in communities where more stigma is associated with a diagnosis.

Our study emphasises the need for service improvement targeting BME groups who might be facing barriers to accessing health care services and getting a dementia diagnosis. GPs should be equipped with culturally appropriate assessment tools in order to make a timely diagnosis of dementia for BME patients.

Our findings also highlight the importance of raising awareness of the benefits of getting a timely diagnosis of dementia, particularly in people from minority ethnic groups who may be more at risk of dementia. Timely diagnosis of dementia can lead to more targeted support and enable GPs to provide appropriate patient care management. These benefits can be explained to the patients by family and friends, as well as professionals such as nurses and social workers. They can also help the patients to overcome the fears of talking about dementia. Faith and community groups can contribute to ensuring that local dementia services are accessible to all.

This study is conducted in collaboration with King’s College London. This work is supported by The Dunhill Medical Trust [grant number R530/1116]. Our article and relevant references can be found at:

Pham TM, Petersen I, Walters K, Raine R, Manthorpe J, Mukadam N, Cooper C (2018). Trends in dementia diagnosis rates in UK ethnic groups: analysis of UK primary care data. Clinical Epidemiology (10): 949-960. doi: 10.2147/CLEP.S152647.

Mixed methods or mixed up?

By rmjlmcd, on 19 February 2018

In this post, Kingshuk Pal discusses his experiences of moving from qualitative research to quantitative research.

So I’m between research methodologies. It’s a bit awkward as you might imagine. Bumbling my way through a no-man’s land between two opposing paradigms – the self-conscious embarrassment of adolescence an unwelcome companion once more. I question myself constantly. Was I truly unhappy being where I was? Is the promise of happiness at the other end of the rainbow just a fairy tale?

Should I seek to define myself as a qualitative researcher or a quantitative researcher? Can I meaningfully be both? Am I method-fluid, mixed-methods or just mixed-up?

The transition is certainly not an easy process. Language acquisition skills apparently peak by age 7, so the evidence-based solution for learning Stata would be to find a time machine that can transport me back in time 30 years or so. But as my time-machine building efforts are short a DeLorean and flux-capacitor or two, having a study group and working through a short introduction to Stata for biostatistics with my colleague Tom Hartney has certainly proved a remarkably helpful alternative. Amazing what you can learn from copying the homework of someone way smarter than yourself. Sadly my attempts to learn about medical statistics and epidemiology have not gone quite so well. My textbooks are currently gazing down at me judgementally from a shelf where they are gainfully employed as bookends… Maybe I can start a book club… targeting anyone suffering from insomnia. For any readers still awake – thanks – and please let me know if you’ve got any good suggestions for epidemiology or stats courses…

There may be some people curious about what tempted me over to what my qualitative friends suspiciously view as the “dark side”. I’m exploring the links between diabetes and depression by looking at routinely collected primary care data (from the THIN database). Poorly controlled diabetes increases the risk of heart attacks, strokes, amputation, blindness and renal failure (National Collaborating Centre for Chronic Conditions, 2008). The presence of depression increases the risk of poorer outcomes in diabetes as it is associated with poor glycaemic control and increased rates of complications (de Groot et al. 2001; Lustman et al. 2000). Depression has also been found to double the likelihood of being diagnosed with diabetes (Eaton et al. 1996; Kawakami et al. 1999). The relationship between the two might be partly due to shared underlying pathophysiology driven by changes in stress hormones in the hypothalamus-pituitary-adrenal cortex axis and sympathetic nervous system (Renn et al., 2011; Snoek et al., 2015). Both conditions are also associated with subclinical inflammation (Tabák et al., 2014). There are also behavioural factors and complications associated with these conditions that link them through poorer self-care due to raised BMI, reduced physical activity etc. (Lin et al., 2004). The net result is a shared increase in vulnerability to these common chronic conditions and poorer outcomes (including increased mortality) where they co-exist (Park et al., 2013). My area of interest is the use and impact of anti-depressants in people with type 2 diabetes and seeing how that reflects the interactions described above.

In contrast, part of my doctoral work on the HeLP-Diabetes project was qualitative research that touched on the negative emotional burden (diabetes related distress) that was placed on people living with type 2 diabetes (Kingshuk et al., 2018). And now I sometimes think about which might be more helpful for me as a doctor – to understand or measure the impact of depression and distress in people living with type 2 diabetes? Clearly I need to be able to do both. If I don’t understand what it means to be depressed with diabetes, it’s harder for me to engage with patients and frame my advice in terms that are meaningful and relevant for them. But when time and resources are increasingly limited, I need evidence to help guide me as to how hard I look for depression, who I should focus on and what the best treatment option might be.

So as a clinician, I need both. But as a researcher can I do both? There is often debate in the medical profession about the merits of generalists Vs specialists. And most GPs would unsurprisingly mount a passionate case for the role of the generalist providing holistic care and continuity over time which is different to the focused care provided by specialists. So I hope the same is true with research – and maybe somewhere there’s a place for a mixed-up researcher like me…

Making the Most of “Real World” Data

By Nathan Davies, on 12 May 2017

In this post Manuj Sharma talks about the mid-year meeting for the International Society of Pharmacoepidemioogy (ISPE) he recently attended at the Royal College of Physicians in London.

Pharmacoepidemiology itself comes across as quite a mouthful, but it simply refers to the study of the use and effects of medications in large numbers of people – focusing on both how effective and safe medications are. As such, research including both trials and observational studies focused on medication all come under the pharmacepidemiological heading.

A big point for discussion at this years conference was the impact of ever growing volumes of “real world” patient data and what it means for the field of pharmacoepidemiology going forward. “Real world” is any data collected outside of the constraints of conventional randomised trials. When it comes to medications, there are many who traditionally have looked at randomised controlled trials as the only means of getting to a clear unbiased answer but given so much data is now becoming accessible, can we really afford to ignore other study designs and methods?

“Real World” Data Sources. Reproduced with permission from presentation delivered by Dr Enrica Alteri from European Medicines Agency at the ISPE Mid-Year Meeting in London, 2017

“Real World” Data Sources. Reproduced with permission from presentation delivered by Dr Enrica Alteri from European Medicines Agency at the ISPE Mid-Year Meeting in London, 2017

The thoughts on what all this new patient data meant for the future of research into medication were sought from representatives from 3 key stakeholders, regulators, industry, and the NHS. The discussion was extensive but here are some of the major points that grasped my attention and gave, I felt, most food for thought…

The regulators were up first and their perspective was delivered by Dr Enrica Alteri, Head of Research and Development at the European Medicines Agency (EMA). She was quick to emphasise how the EMA have been advocating increasing use of “real world” data for some time.

The most interesting example provided of this was regarding an extension of licensing granted to a medication called Soliris® (eculizumab), used for paroxysomal nocturnal haemoglobinuria, a life threatening condition where red blood cells break apart prematurely. The original trials approved the medicine for use in particular patient group with history of blood transfusions while a registry based study using “real world data” was subsequently used to successfully extend the license of the medication for use in patients with other levels of disease severity. The path that any new treatment takes from development to decisions on approval and reimbursement can take over 20 years. So with new medicines being developed at a faster pace, there is a need to make this process more efficient to allow patients to safely access treatments sooner. The EMA is accepting of this type of licensing extension using “real world” data, provided of course, like with any trial, the study is conducted in a rigorous, robust manner!

The industry perspective came from Andrew Roddan, Vice President & Global Head of Epidemiology at GlaxoSmithKline who highlighted another important role for this data in drug development through identifying disease patterns and targets. He also emphasised that use of “real world” data and undertaking randomised trials did not have to be mutually exclusive. Andrew Roddan used The Salford Lung Study as an exciting example where professionals from eight organisations across Greater Manchester involving over 2,800 patients, 80 GP practices and 130 pharmacies collaborated to investigate effectiveness of a new inhaler, Relvar Ellipta® for COPD. The study was securely hosted within the NHS network, which integrated the electronic medical records of consenting patients across all of their everyday interactions with their GPs, pharmacists and hospitals. This linked database system allowed monitoring of patients’ safety in close to real-time with minimal intrusion into their daily lives. This also meant recruitment of a large group of patients was possible – including types often excluded in traditional respiratory trials. Not everywhere has the technological integration that is in place in Salford, but this was an exciting vision for where medicines development can go!

The final perspective, fittingly came from Dr Indra Joshi who gave her viewpoint from the NHS frontline, as a practising acute medicine physician. Dr Indra Joshi was excited by the increasing volumes of patient data emerging and believed it could greatly contribute to various aspects of pharmacoepidemiology while also improving patient care. She was, however, keen to remind everyone that patients must be involved each step of the way to ensure this data continues to become available. She also believes that despite advances there was still some way to go before we achieve the healthcare record integration needed to conduct studies to the quality of the Salford Lung Study throughout the UK.

The lively discussion and presentations from the stakeholders gave interesting perspectives on the future of growing volumes of patient data and what it meant for research into medication. Despite some differences there was overall agreement on a few points. While trials remain central to medication licensing decisions and establishing efficacy of treatments early on, there are multiple opportunities for “real world” data to add to this evidence base to support the process. A clear understanding of the strengths and limitations of the available “real world” data was key to realising where they can add most value. And finally, how important it is to ensure early and frequent engagement between all stakeholders for success. Next time, it would be great to hear the patient perspective as well!


__________________________________________________________________________________

Big Bang Data Exhibition at Somerset House

By Nathan Davies, on 8 April 2016

In this blog Tra My Pham talks about a recent visit the Thin team had to the Big Bang Data exhibition at Somerset House.

Our team recently went on a field trip to the new Big Bang Data exhibition at London’s Somerset House. Through the work of artists, designers, journalists and visionaries who used data as raw materials, the exhibition showcased the complex relationship between data and our lives, how data affects the way we do things today and impacts our future.

The weight of the cloud

The weight of the cloud

The introductory section of the exhibition revolved around the concept of ‘the cloud’, a buzzword for online storage services such as Dropbox or Google Drive where we can store and access our data over the Internet instead of using a computer’s hard drive. These conceptually light and intangible services are actually supported by a heavy network of physical servers located in industrial-scale warehouses known as data farms. For example, Facebook’s first data centre in Europe is based in Lulea, Sweden, serving more than 800 million Facebook users. The invisible infrastructures supporting ‘the cloud’, hidden inside such closely-guarded data centres, were unveiled to viewers in Timo Arnall’s fascinating film Internet Machine.

History of data was the main theme of the next section that we went on to see. The last few decades have witnessed an information explosion, which involves a radical shift in the quantity, variety and speed of data being produced, as well as the continuous evolution in the way data can be stored, accessed and analysed.  From floppy disks with storage capacity of 1.44 megabytes in the late 80s, we can now easily store and carry around terabytes of data in portable hard drives for everyday use. Going back a couple of decades, storing 1 terabytes of data would require more than 700,000 floppy disks!!!

Horizon by Thomson and Craighead (2015)  - digital collage from online sources

Horizon by Thomson and Craighead (2015)
– digital collage from online sources

This section also gently touched on the discipline of data visualisation, which has become essential in capturing and making sense of the abundant data available nowadays. I was particularly drawn to ‘Horizon’ by Thomson and Craighead, a digital collage of real-time images taken in different time zones around the world and constantly being updated, forming what resembled a global electronic sundial.

Some of the work in the next section we visited focused on the issue of data privacy and security, something we all need to consider in our roles in research. For example, by mapping pictures of cats posted on social media in I Know Where Your Cat Lives, Owen Mundy exposed how easy it is to trace the location of cat owners using their own digital footprints.

Other artists’ interest lies in collecting and visualising their own personal data. My two favourite pieces of work in this stream were Dear Data by Stefanie Posavec and Giorgia Lupi, and Annual Reports by Nicholas Felton.

Dear Data by Posavec and Lupi -  Week 7: A Week of Complaints

Dear Data by Posavec and Lupi –
Week 7: A Week of Complaints

In Dear Data, London-based Posavec and New York-based Lupi got to know each other through postcards filled with data they collected and drew about their weekly activities; from the number of times they looked at the clock to how often they laughed or made complaints.

Since 2005, Felton has been gathering a legacy of information about himself, his personality and everyday habits such as dining, drinking, reading and travelling. These data are presented in the form of annual reports, reflecting his activities during the years.

Annual Report by Nicholas Felton –  Dining and Drinking in 2008

Annual Report by Nicholas Felton –
Dining and Drinking in 2008

To me, these two pieces brought about a sense of wittiness. However, what struck me most was that there is no single correct way of making sense of the data, and data that seem to be trivial at first sight can be integrated and visualised to tell meaningful stories.  As a researcher using a large primary care electronic database, this was by far the most special section of the exhibition to me, and gave me much inspiration for improving the data visualisation aspect of my work.

Function: Pixellating the War Casualities in Iraq  by Kamel Makhoufi (2010)

Function: Pixellating the War Casualities in Iraq
by Kamel Makhoufi (2010)

This section showed how the future form of our data society is being shaped for the common good. What drew my attention was Pixellating the War Caualities in Iraq, a simple yet stunning pixel visualisation created by Kamel Makhloufi to highlight the casualties during the Iraq war. Each pixel had a colour, blue for ‘friendly troops’, green for ‘host nation troops’, orange for ‘Iraqi civilians’ and grey for ‘enemies’. The two images showed the same data but in different presentations. The right image illustrated the deaths as reported chronically, and the left image grouped the deaths by the characteristics of the person killed. This work really emphasised the power of visualisation tools in conveying meaningful messages from large and complex datasets.

We also visited other sections of the exhibition including ‘London Situation Room’, where stories of Londoners were depicted through data, and Black Shoals: Dark Matter’, which was a spectacular visualisation of the world’s stock market.

The exhibition ended with ‘What Data Can’t Tell’. This section featured works to illustrate that using data analysis alone may not be enough to resolve some of our society’s complex issues such as education, health care or war, which also involve a high level of moral arguments.

Before concluding our visit at the exhibition, we made our last stop at The Data Store. This section brought together products that capture data with the aim of enhancing our everyday life, such as personal fitness wristbands, or wearable camera that automatically take pictures over the course of a day, also known as narrative clips.


Handling missing data in longitudinal clinical databases

By Nathan Davies, on 1 July 2014

Cathey WelchCathy Welch is a former Research Associate of Primary Care and Population Health and current part time PhD student.Cathy Welch is a former Research Associate of Primary Care and Population Health and part-time PhD student. She worked on a MRC funded project:
“Missing data imputation in clinical databases: development of a longitudinal model for cardiovascular risk factors”. For more information about our work on electronic health records please see:  http://www.ucl.ac.uk/pcph/research-groups-themes/thin-pub

She is currently a Research Associate working on the Whitehall II study in the Department of Epidemiology and Public Health. Here she discusses multiple imputation as a method for handling missing data. 

Missing data is a common problem in all areas of research. Many studies choose to analyse the observed data only, but this can bias findings if the observed data is not representative of all the data, resulting in misleading conclusions.

An alternative approach to handle missing data is multiple imputation, which selects multiple random values from the predictive distribution of the missing data given the observed data. Analysis of imputed data can achieve unbiased results if certain assumptions are plausible. For example, the data is missing at random (the reasons for missing data depend on the observed values but not the missing values). We can investigate the relationships in the data to understand structure, extent of the missing data and the reasons for the missing data to justify a plausible missing at random (MAR) mechanism. We can also make plausible assumptions regarding the `missingness mechanism’ based on prior knowledge of the data, not just from the observed data.

Multiple imputation (MI) has been implemented in many research studies. However, we were interested in the best multiple imputation approach to imputed missing values in longitudinal data (repeated measurements over a time period). For this investigation, we used The Health Improvement Network (THIN) primary care database of electronic, health records. This database currently consists of over 550 practices with 11 million patients and many variables. We wanted MI to take account of the longitudinal and dynamic structure of the data as reasons for recording information changes over time. However, computational problems arise due to the substantial size of the database.

Nevalainen(1) proposed a new approach to MI, the two-fold fully conditional specification (FCS) algorithm, to impute missing values in longitudinal data. It imputes each time point conditional on observations at the same and adjacent time points and repeatedly cycles through all time points, so it takes into account the longitudinal structure. This approach reduces computational problems because each iteration includes a few time points.

This method was not validated for use in a real longitudinal database, for example when entry to the study and exit from the study varies for each individual. The first step was to develop a Stata command to implement the two-fold FCS algorithm in real longitudinal data. This command is now available to download from the Statistical Software Components (SSC) archive using the Stata command ssc install twofold. A paper describing the command is now available from The Stata Journal.

Before implementing the two-fold FCS algorithm in THIN, we used a simulation study to validate the two-fold FCS algorithm. One advantage of using simulation study is we know the original data so we can make data missing and compare different approaches for handling missing data to the results from analysing the original data. Another advantage is we can challenge the two-fold FCS algorithm in different settings when it achieves unbiased results.

We simulated data from the associations observed in THIN with 10 years of follow up. We used an exponential model of interest to investigate the association between measurements recorded at a baseline time point and a future CVD event.

We made 70% weight, systolic blood pressure and smoking status measurements missing at each time point and compared to:

  • a complete records analysis
  • imputing missing values at baseline conditional only on other measurements recorded at baseline
  • using the two-fold FCS algorithm to impute
    • Smoking status as time-independent
    • Smoking status as time-dependent – From GPs and interrogation of the data found adult non-smokers are unlikely to begin smoking. So, if a patient only ever had a non-smoker record, we assumed they were non-smokers at every time point. This approach reduced missing data and simplified the imputation process (semi-deterministic method).

The simulation study found analysing data imputed using the two-fold FCS algorithm gave essentially unbiased estimates for time-dependent variables compared to a complete records analysis or analysing data imputed at baseline only because  the two-fold FCS algorithm uses the repeated measurements in the imputation. Weight variable was least biased, probably because of high correlations between repeatedly measured weight values. Also, using semi-deterministic method derived based on our knowledge of the data to impute smoking status was preferable because it improved the estimate precision (standard errors).

This study is now published in Statistics in Medicine(2). Next step is to use the knowledge gained from this validation process to apply the algorithm in THIN. We also hope other researchers using longitudinal databases with missing data may recognise the potential bias which can occur from analysing only the observed data and consider using the two-fold FCS algorithm to impute missing values.


Reference List

  (1)   Nevalainen J, Kenward MG, Virtanen SM. Missing values in longitudinal dietary data: a multiple imputation approach based on a fully conditional specification. Stat Med 2009 Dec 20;28(29):3657-69.

  (2)   Welch CA, Petersen I, Bartlett JW, White IR, Marston L, Morris RW, et al. Evaluation of two-fold fully conditional specification multiple imputation for longitudinal electronic health record data. Stat Med 2014 Apr 30.


Smoker, ex-smoker or non-smoker? The validity of routinely recorded smoking status in UK primary care: a cross-sectional study

By Nathan Davies, on 7 May 2014

Louise Marston reports here on a recent paper published with BMJ Open.

When is a non-smoker an ex-smoker?  You may wonder this, and as we found out, the answer is often in primary care records.  These come from the computerised records that general practitioners make during consultations with their patients.  These include symptom, diagnoses and drugs prescribed.  They also include other information which may be relevant to healthcare such as weight, blood pressure and smoking status.

Following a previous paper, where we discovered that of the smoking status information present in the year following registration, there was a greater percentage of patients recorded as smokers than in UK population surveys we sought to look at smoking status in greater detail.

In our new paper we looked deeper into smoking status recording in the first year of registration in those who registered during 2008 and 2009 with a general practice in England that were part of The Health Improvement Network (THIN).  We found that smoking status recording was good, with 84% of those aged 16 or over had a smoking status record within a year of registering.  However, compared with the 2008 Health Survey for England (HSE), the percentage of ex-smokers was substantially lower in THIN (26% versus 14% respectively) and there was a lower percentage of current smokers in the HSE compared with THIN (21% versus 24% respectively).

Firstly we imputed assumed missing smoking status data could be any of current smoker, ex-smoker or non-smoker.  After age standardising to account for the differing age structures between datasets, there were still notable differences between THIN and the HSE, for ex-smoking.  Further analysis assuming data on all smokers in THIN had been collected and missing data were ex or non-smokers resulted in a lower percentage of ex-smokers in THIN compared with the HSE (23% versus 26% respectively).  Using time since quitting in the HSE, we estimated that those who quit smoking before the age of 30 are unlikely to be recorded as ex-smokers in general practice records and instead recorded as non-smokers.

Differences in smoking status between datasets may be due to the way smoking status is ascertained; in THIN it is self-report without strict protocol.  Some people who quit smoking a long time ago or only smoked for a short period may not consider themselves to be ex-smokers, and describe themselves as non-smokers when asked by their GP or other practice staff. In the HSE, smoking status is collected using a strict algorithm, categorising those who smoked at any time even for a short period as ex-smokers.  The HSE data are collected in the same way from all participants.

Smoking status matters for epidemiological research as ex-smokers carry a higher risk of many diseases than never smokers, especially soon after quitting.  This has been shown in the 50 year follow up of British doctors (Doll et al, 2004).  However, it is reassuring to know that soon after registration, most current smokers will have been recorded as such in general practice and misclassification is most likely in those who quit smoking a long time ago.

This study was funded by a UK Medical Research Council grant [G0900701].


Marston L, Carpenter JR, Walters KR, Morris RW, Nazareth I, White IR, Petersen I Smoker, ex-smoker or non-smoker? The validity of routinely recorded smoking status in UK primary care: a cross-sectional study. BMJ Open 2014;4:e004958. doi:10.1136/bmjopen-2014-004958


Doll R, Peto R, Boreham J, et al Mortality in relation to smoking: 50 years’ observations on male British doctors. BMJ 2004;328:1519.