 Close
Close

Big Bang Data Exhibition at Somerset House
By Nathan Davies, on 8 April 2016
In this blog Tra My Pham talks about a recent visit the Thin team had to the Big Bang Data exhibition at Somerset House.
Our team recently went on a field trip to the new Big Bang Data exhibition at London’s Somerset House. Through the work of artists, designers, journalists and visionaries who used data as raw materials, the exhibition showcased the complex relationship between data and our lives, how data affects the way we do things today and impacts our future.

The weight of the cloud
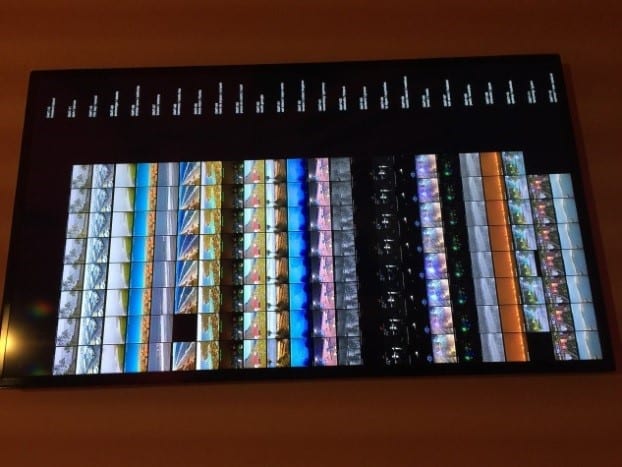
The introductory section of the exhibition revolved around the concept of ‘the cloud’, a buzzword for online storage services such as Dropbox or Google Drive where we can store and access our data over the Internet instead of using a computer’s hard drive. These conceptually light and intangible services are actually supported by a heavy network of physical servers located in industrial-scale warehouses known as data farms. For example, Facebook’s first data centre in Europe is based in Lulea, Sweden, serving more than 800 million Facebook users. The invisible infrastructures supporting ‘the cloud’, hidden inside such closely-guarded data centres, were unveiled to viewers in Timo Arnall’s fascinating film Internet Machine.
History of data was the main theme of the next section that we went on to see. The last few decades have witnessed an information explosion, which involves a radical shift in the quantity, variety and speed of data being produced, as well as the continuous evolution in the way data can be stored, accessed and analysed. From floppy disks with storage capacity of 1.44 megabytes in the late 80s, we can now easily store and carry around terabytes of data in portable hard drives for everyday use. Going back a couple of decades, storing 1 terabytes of data would require more than 700,000 floppy disks!!!
Horizon by Thomson and Craighead (2015)
– digital collage from online sources
This section also gently touched on the discipline of data visualisation, which has become essential in capturing and making sense of the abundant data available nowadays. I was particularly drawn to ‘Horizon’ by Thomson and Craighead, a digital collage of real-time images taken in different time zones around the world and constantly being updated, forming what resembled a global electronic sundial.
Some of the work in the next section we visited focused on the issue of data privacy and security, something we all need to consider in our roles in research. For example, by mapping pictures of cats posted on social media in I Know Where Your Cat Lives, Owen Mundy exposed how easy it is to trace the location of cat owners using their own digital footprints.
Other artists’ interest lies in collecting and visualising their own personal data. My two favourite pieces of work in this stream were Dear Data by Stefanie Posavec and Giorgia Lupi, and Annual Reports by Nicholas Felton.

Dear Data by Posavec and Lupi –
Week 7: A Week of Complaints
In Dear Data, London-based Posavec and New York-based Lupi got to know each other through postcards filled with data they collected and drew about their weekly activities; from the number of times they looked at the clock to how often they laughed or made complaints.
Since 2005, Felton has been gathering a legacy of information about himself, his personality and everyday habits such as dining, drinking, reading and travelling. These data are presented in the form of annual reports, reflecting his activities during the years.
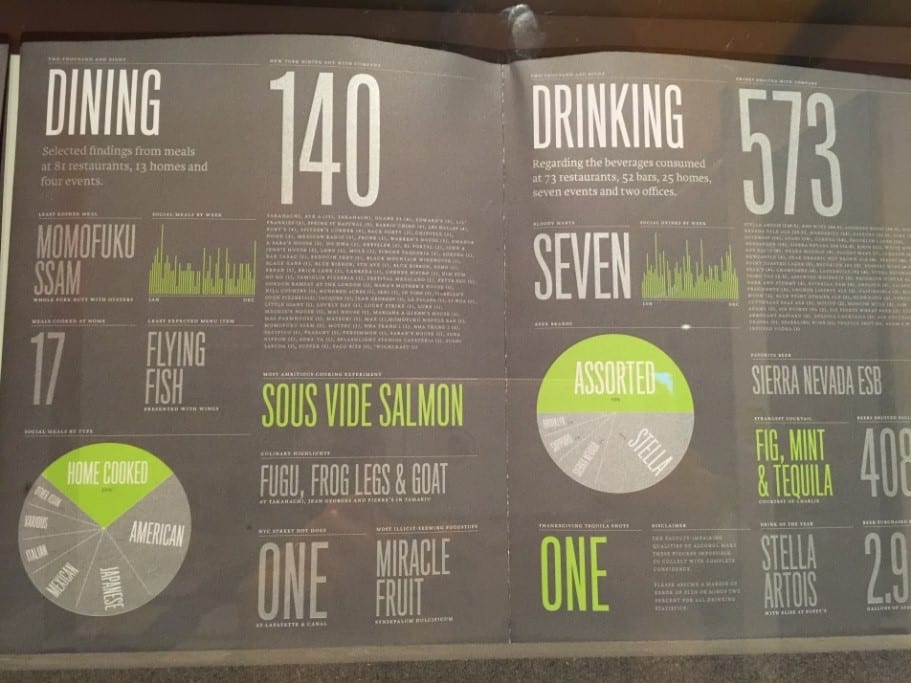
Annual Report by Nicholas Felton –
Dining and Drinking in 2008
To me, these two pieces brought about a sense of wittiness. However, what struck me most was that there is no single correct way of making sense of the data, and data that seem to be trivial at first sight can be integrated and visualised to tell meaningful stories. As a researcher using a large primary care electronic database, this was by far the most special section of the exhibition to me, and gave me much inspiration for improving the data visualisation aspect of my work.
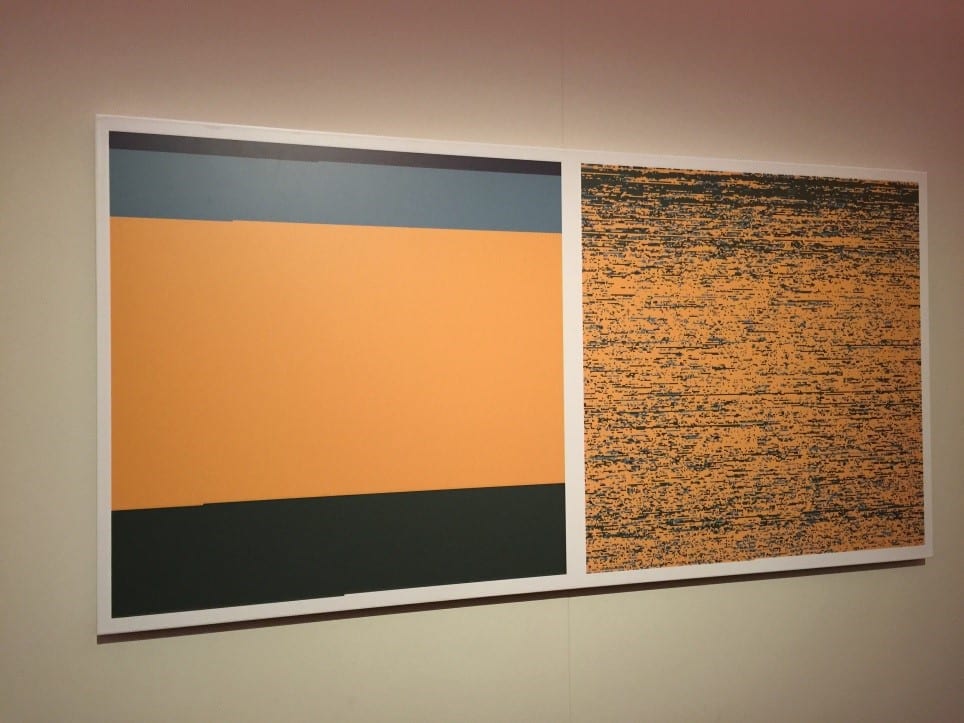
Function: Pixellating the War Casualities in Iraq
by Kamel Makhoufi (2010)
This section showed how the future form of our data society is being shaped for the common good. What drew my attention was Pixellating the War Caualities in Iraq, a simple yet stunning pixel visualisation created by Kamel Makhloufi to highlight the casualties during the Iraq war. Each pixel had a colour, blue for ‘friendly troops’, green for ‘host nation troops’, orange for ‘Iraqi civilians’ and grey for ‘enemies’. The two images showed the same data but in different presentations. The right image illustrated the deaths as reported chronically, and the left image grouped the deaths by the characteristics of the person killed. This work really emphasised the power of visualisation tools in conveying meaningful messages from large and complex datasets.
We also visited other sections of the exhibition including ‘London Situation Room’, where stories of Londoners were depicted through data, and ‘Black Shoals: Dark Matter’, which was a spectacular visualisation of the world’s stock market.
The exhibition ended with ‘What Data Can’t Tell’. This section featured works to illustrate that using data analysis alone may not be enough to resolve some of our society’s complex issues such as education, health care or war, which also involve a high level of moral arguments.
Before concluding our visit at the exhibition, we made our last stop at The Data Store. This section brought together products that capture data with the aim of enhancing our everyday life, such as personal fitness wristbands, or wearable camera that automatically take pictures over the course of a day, also known as narrative clips.