X Close

Research Department of Primary Care and Population Health Blog

Home

Menu

Archive for the 'PhD students' Category

How to keep active in old age? Sports participation key for men

By Nathan Davies, on 27 September 2017

Daniel Aggio PhD Student PCPH (6)In this post, Daniel Aggio, a PhD student at PCPH, discusses some of his PhD work that was recently published in BMJ Open and has had widespread media coverage in the UK and across the pond in America.

There is a considerable body of research suggesting that physical activity tracks from childhood into adulthood. In other words, being an active child means you are more likely to be active as an adult. Something that has been less explored is how physical activity tracks during the transition to old age, an important period when many major life events are likely to occur.

This study utilises data from the British Regional Heart Study, a prospective cohort study involving over 7000 middle-aged men recruited between 1978 and 1980 from 24 towns across Britain. One of the main assets of the British Regional Heart study is the lengthy follow up data, including measures of physical activity throughout the transition to old age. By exploiting these data, we were able to explore how physical activity tracks during this period and identify the types of activity in midlife that are most likely to predict an active lifestyle in later life.

It did not come as much of a surprise to find that being active in midlife more than doubled the odds of being active in old age, but we were struck by how strongly midlife sport participation, and particularly if it was initiated earlier in life, predicted being active in old age. For example, men who had played sports for 25 years or more were nearly 5 times as likely to be physically active in later life compared with men who did not play sports. But even taking up sport relatively late in midlife (i.e. less than 4 years ago) significantly increased the odds of being active in old age. Higher levels of walking and recreational activity in midlife also increased the odds of being active in later life, but they were not as strongly associated as sport participation. Until we carry out more research we can only speculate as to why this is the case. Plausibly, people who keep up sport may simply do so because they enjoy it. We also suspect that sport plays a pivotal role in the development and maintenance of key motor skills, which may prove vital in later life.

Although sport participation may be more stable and more likely to predict activity in later life than other types of activity, walking was the most likely to increase during later life, possibly because retirement might free up more time and functional declines may limit capability for more intense activities. From a public health perspective, promoting walking may be more feasible in later life as we show that many older adults are already increasing their walking during the transition to old age.

Being active in midlife, particularly playing sport, is important for maintaining an active lifestyle into old age. Sport participation may be crucial for establishing lifelong physical activity and should be promoted throughout the lifecourse, especially in early life. Strategies to increase physical activity in later life may also need to target other forms of activity that can be widely adopted, such as walking.

Click here to read the full published article.

Making the Most of “Real World” Data

By Nathan Davies, on 12 May 2017

In this post Manuj Sharma talks about the mid-year meeting for the International Society of Pharmacoepidemioogy (ISPE) he recently attended at the Royal College of Physicians in London.

Pharmacoepidemiology itself comes across as quite a mouthful, but it simply refers to the study of the use and effects of medications in large numbers of people – focusing on both how effective and safe medications are. As such, research including both trials and observational studies focused on medication all come under the pharmacepidemiological heading.

A big point for discussion at this years conference was the impact of ever growing volumes of “real world” patient data and what it means for the field of pharmacoepidemiology going forward. “Real world” is any data collected outside of the constraints of conventional randomised trials. When it comes to medications, there are many who traditionally have looked at randomised controlled trials as the only means of getting to a clear unbiased answer but given so much data is now becoming accessible, can we really afford to ignore other study designs and methods?

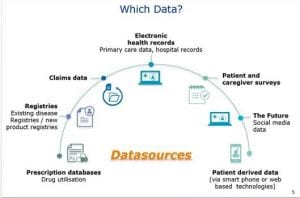
“Real World” Data Sources. Reproduced with permission from presentation delivered by Dr Enrica Alteri from European Medicines Agency at the ISPE Mid-Year Meeting in London, 2017

“Real World” Data Sources. Reproduced with permission from presentation delivered by Dr Enrica Alteri from European Medicines Agency at the ISPE Mid-Year Meeting in London, 2017

The thoughts on what all this new patient data meant for the future of research into medication were sought from representatives from 3 key stakeholders, regulators, industry, and the NHS. The discussion was extensive but here are some of the major points that grasped my attention and gave, I felt, most food for thought…

The regulators were up first and their perspective was delivered by Dr Enrica Alteri, Head of Research and Development at the European Medicines Agency (EMA). She was quick to emphasise how the EMA have been advocating increasing use of “real world” data for some time.

The most interesting example provided of this was regarding an extension of licensing granted to a medication called Soliris® (eculizumab), used for paroxysomal nocturnal haemoglobinuria, a life threatening condition where red blood cells break apart prematurely. The original trials approved the medicine for use in particular patient group with history of blood transfusions while a registry based study using “real world data” was subsequently used to successfully extend the license of the medication for use in patients with other levels of disease severity. The path that any new treatment takes from development to decisions on approval and reimbursement can take over 20 years. So with new medicines being developed at a faster pace, there is a need to make this process more efficient to allow patients to safely access treatments sooner. The EMA is accepting of this type of licensing extension using “real world” data, provided of course, like with any trial, the study is conducted in a rigorous, robust manner!

The industry perspective came from Andrew Roddan, Vice President & Global Head of Epidemiology at GlaxoSmithKline who highlighted another important role for this data in drug development through identifying disease patterns and targets. He also emphasised that use of “real world” data and undertaking randomised trials did not have to be mutually exclusive. Andrew Roddan used The Salford Lung Study as an exciting example where professionals from eight organisations across Greater Manchester involving over 2,800 patients, 80 GP practices and 130 pharmacies collaborated to investigate effectiveness of a new inhaler, Relvar Ellipta® for COPD. The study was securely hosted within the NHS network, which integrated the electronic medical records of consenting patients across all of their everyday interactions with their GPs, pharmacists and hospitals. This linked database system allowed monitoring of patients’ safety in close to real-time with minimal intrusion into their daily lives. This also meant recruitment of a large group of patients was possible – including types often excluded in traditional respiratory trials. Not everywhere has the technological integration that is in place in Salford, but this was an exciting vision for where medicines development can go!

The final perspective, fittingly came from Dr Indra Joshi who gave her viewpoint from the NHS frontline, as a practising acute medicine physician. Dr Indra Joshi was excited by the increasing volumes of patient data emerging and believed it could greatly contribute to various aspects of pharmacoepidemiology while also improving patient care. She was, however, keen to remind everyone that patients must be involved each step of the way to ensure this data continues to become available. She also believes that despite advances there was still some way to go before we achieve the healthcare record integration needed to conduct studies to the quality of the Salford Lung Study throughout the UK.

The lively discussion and presentations from the stakeholders gave interesting perspectives on the future of growing volumes of patient data and what it meant for research into medication. Despite some differences there was overall agreement on a few points. While trials remain central to medication licensing decisions and establishing efficacy of treatments early on, there are multiple opportunities for “real world” data to add to this evidence base to support the process. A clear understanding of the strengths and limitations of the available “real world” data was key to realising where they can add most value. And finally, how important it is to ensure early and frequent engagement between all stakeholders for success. Next time, it would be great to hear the patient perspective as well!


__________________________________________________________________________________

Big Bang Data Exhibition at Somerset House

By Nathan Davies, on 8 April 2016

In this blog Tra My Pham talks about a recent visit the Thin team had to the Big Bang Data exhibition at Somerset House.

Our team recently went on a field trip to the new Big Bang Data exhibition at London’s Somerset House. Through the work of artists, designers, journalists and visionaries who used data as raw materials, the exhibition showcased the complex relationship between data and our lives, how data affects the way we do things today and impacts our future.

The weight of the cloud

The weight of the cloud

The introductory section of the exhibition revolved around the concept of ‘the cloud’, a buzzword for online storage services such as Dropbox or Google Drive where we can store and access our data over the Internet instead of using a computer’s hard drive. These conceptually light and intangible services are actually supported by a heavy network of physical servers located in industrial-scale warehouses known as data farms. For example, Facebook’s first data centre in Europe is based in Lulea, Sweden, serving more than 800 million Facebook users. The invisible infrastructures supporting ‘the cloud’, hidden inside such closely-guarded data centres, were unveiled to viewers in Timo Arnall’s fascinating film Internet Machine.

History of data was the main theme of the next section that we went on to see. The last few decades have witnessed an information explosion, which involves a radical shift in the quantity, variety and speed of data being produced, as well as the continuous evolution in the way data can be stored, accessed and analysed.  From floppy disks with storage capacity of 1.44 megabytes in the late 80s, we can now easily store and carry around terabytes of data in portable hard drives for everyday use. Going back a couple of decades, storing 1 terabytes of data would require more than 700,000 floppy disks!!!

Horizon by Thomson and Craighead (2015)  - digital collage from online sources

Horizon by Thomson and Craighead (2015)
– digital collage from online sources

This section also gently touched on the discipline of data visualisation, which has become essential in capturing and making sense of the abundant data available nowadays. I was particularly drawn to ‘Horizon’ by Thomson and Craighead, a digital collage of real-time images taken in different time zones around the world and constantly being updated, forming what resembled a global electronic sundial.

Some of the work in the next section we visited focused on the issue of data privacy and security, something we all need to consider in our roles in research. For example, by mapping pictures of cats posted on social media in I Know Where Your Cat Lives, Owen Mundy exposed how easy it is to trace the location of cat owners using their own digital footprints.

Other artists’ interest lies in collecting and visualising their own personal data. My two favourite pieces of work in this stream were Dear Data by Stefanie Posavec and Giorgia Lupi, and Annual Reports by Nicholas Felton.

Dear Data by Posavec and Lupi -  Week 7: A Week of Complaints

Dear Data by Posavec and Lupi –
Week 7: A Week of Complaints

In Dear Data, London-based Posavec and New York-based Lupi got to know each other through postcards filled with data they collected and drew about their weekly activities; from the number of times they looked at the clock to how often they laughed or made complaints.

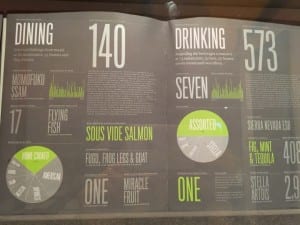
Since 2005, Felton has been gathering a legacy of information about himself, his personality and everyday habits such as dining, drinking, reading and travelling. These data are presented in the form of annual reports, reflecting his activities during the years.

Annual Report by Nicholas Felton –  Dining and Drinking in 2008

Annual Report by Nicholas Felton –
Dining and Drinking in 2008

To me, these two pieces brought about a sense of wittiness. However, what struck me most was that there is no single correct way of making sense of the data, and data that seem to be trivial at first sight can be integrated and visualised to tell meaningful stories.  As a researcher using a large primary care electronic database, this was by far the most special section of the exhibition to me, and gave me much inspiration for improving the data visualisation aspect of my work.

Function: Pixellating the War Casualities in Iraq  by Kamel Makhoufi (2010)

Function: Pixellating the War Casualities in Iraq
by Kamel Makhoufi (2010)

This section showed how the future form of our data society is being shaped for the common good. What drew my attention was Pixellating the War Caualities in Iraq, a simple yet stunning pixel visualisation created by Kamel Makhloufi to highlight the casualties during the Iraq war. Each pixel had a colour, blue for ‘friendly troops’, green for ‘host nation troops’, orange for ‘Iraqi civilians’ and grey for ‘enemies’. The two images showed the same data but in different presentations. The right image illustrated the deaths as reported chronically, and the left image grouped the deaths by the characteristics of the person killed. This work really emphasised the power of visualisation tools in conveying meaningful messages from large and complex datasets.

We also visited other sections of the exhibition including ‘London Situation Room’, where stories of Londoners were depicted through data, and Black Shoals: Dark Matter’, which was a spectacular visualisation of the world’s stock market.

The exhibition ended with ‘What Data Can’t Tell’. This section featured works to illustrate that using data analysis alone may not be enough to resolve some of our society’s complex issues such as education, health care or war, which also involve a high level of moral arguments.

Before concluding our visit at the exhibition, we made our last stop at The Data Store. This section brought together products that capture data with the aim of enhancing our everyday life, such as personal fitness wristbands, or wearable camera that automatically take pictures over the course of a day, also known as narrative clips.


Rebranding Non-Communicable Diseases: Lessons from a UCL Grand Challenges in Global Health Event

By Rosie Webster, on 13 October 2014

Kethakie Sumathipala is a PhD student in the Mental Health Research Group at PCPH. Here she reflects on lessons learned at a recent UCL Grand Challenges in Global Health event. 

Global health logo

Non-Communicable Diseases (NCDs) refer to non-infectious diseases or medical conditions that are long lasting, such as heart disease, cancer and diabetes. They kill around 36 million every year, worldwide; more people than any other cause.  Once considered to be diseases of the West, 80% of NCDs occur in the world’s poorest countries and affects the most marginalised communities.

A few months ago, I attended the NCD makeover show, organised by UCL’s Grand Challenge of Global Health. The presenters worked in fields outside of the world of academia and were all interested in the use of effective communication. They brought forward ideas from their experiences in social enterprises and the BBC to provide suggestions on how we might effectively work towards communicating risk relating to NCDs. From the session, I was able to obtain some valuable lessons in communication.

Communicating risk

Fred Hersch worked for NCDFree, a global social movement which aims to influence public, scientific, and policy action, by using inspiring local narratives and the medium of film, to communicate the challenges, opportunities and solutions of NCDs. He highlighted that even when people are aware of the health behaviours that may be good for them, such as eating healthily, drinking less or exercising, it isn’t always easy to make these changes. For one, the cost of giving up something today is far greater than the perceived benefits in the future, whether it be exercising rather than going to the pub on a Friday night, or spending your limited resources on the basic needs of your family rather than preventative medications. Therefore one of the greatest difficulties and challenges in managing NCD’s is communicating risk. He suggested the following simple methods to achieve this:

1) ‘Rebranding NCDs’ to suite a new generation, and the use of new forms of communication, particularly social media.

2) ‘Refocusing on health’ and living healthier lives, rather than only focusing on expansion of ‘health care.’

3) Messages which are accessible to the people they are targeted towards, by taking to consideration the contexts in which people live and the challenges they face in different countries, communities and backgrounds.

Branding NCDs

Ed Gillespie, from Futerra Sustainability Communications explained that one of the key aspects of effective communication was branding. Using the example of ‘Apple’, he explained that a great brand should: include a meaning and purpose, be visually identifiable, include a compelling story, be honest about what it provides, and keep evolving to stay relevant. He emphasised the following recommendations:

1) ‘Branding NCDs’– by using examples of recognisable brands such as Nike, Ed explained how  many people are able to associate with a visual image (e.g. Nike’s ‘tick’), and a tag line (e.g. Nike’s ‘just do it’) with iconic brands, he suggested that this may be relevant for rebranding NCDs in the future.

2) Use of acronyms – Ed explained that most lay audiences are familiar with HIV, AIDS and SARS, even if they cannot tell you what the letters stand for, however, fewer people are familiar with the term ‘NCDs’. Ed thought that this familiarity was important and suggested that a good acronym could be one of the steps in raising the profile of NCDs.

3) Use of a compelling story – Ed used the example the Cancer Research UK 2014 campaign, which follows a young woman moving through life over the course of a minute, from a child to a teenager to motherhood as the disease starts to take hold, interspersed with shots of scientists working towards finding a cure. The commercial ends with a scientist who appears to make an important discovery and the young women being given some good news. The final message is ‘one day everyone will beat cancer.’ Ed felt that this poignant and compelling story had the key ingredients to engage with the target audiences in a very short time, following this young woman’s difficult journey followed by a happy and positive ending

Using stories

The use of a good story was further discussed by Frank Ash, a documentary maker from the BBC. Frank explained that the stories should be emotionally engaging, intriguing and exciting to the audience.  He also warned against bombarding people with too much information. If the story was compelling enough and not overloaded with information, people were more likely to take away and remember a few key facts.
 
I found this event really interesting, and it inspired me to think about the way in which I could communicate my research findings to different audiences in the future. I hope that these lessons provide you with some food for thought!

Public Engagement Opportunities for PhD Students at UCL: Beyond Academia

By Rosie Webster, on 15 September 2014

By Ruth Blackburn, a PhD student within the THIN team at Primary Care and Population Health.

UCL are now recruiting for PhD students to join their team of Post Graduate Student Engagers.

The Student Engagers use the tens of thousands of objects (ranging from mummies to moles to work by Rembrandt) that are housed in UCL’s three Museums to engage members of the public about their research.  The Museums are all free for anyone and everyone to enter, which provides a unique opportunity for talking to a dynamic and varied group of people about your research.

Whilst undertaking my PhD on the prevention of cardiovascular disease in people with severe mental illness I started working as a Student Engager: initially, I had no real experience of ‘how to engage’ and was armed only with enthusiasm for making my research accessible and interesting.  However, the role has been hugely rewarding and has prepared me for PhD-related hurdles such the (often dreaded) upgrade process.

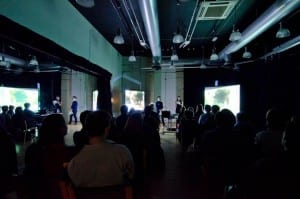
Ruth BlackburnI was also able to work with PhD students across the spectrum of academic study:  together we curated interdisciplinary exhibitions and events to promote discussions about why we undertake research, and to explain the purpose and findings of our PhD projects to researchers and the public.  Most recently, I worked with a PhD student of history and – with the aid of two projectors, some Technicolor film and a darkened room – we re-created a bus journey through post-war London.  This was a journey that provided insight into the first studies of coronary heart disease (which compared bus conductors and drivers to understand the impact of increased physical activity at work) and was artfully positioned in the context of post-war Britain. Public engagement provides a rare opportunity for truly interdisciplinary working that is enjoyable, challenging and insightful in equal measure.

If you are a PhD student in UCL with an enthusiasm for communicating your research to people beyond the academic bubble then please consider applying for a paid Post Graduate Student Engagement role (deadline October 2nd 2014).  You can find out more information here, and follow our Twitter feed.