 Close
Close

The relationship between Ofsted judgements and inspection team size
By Blog Editor, IOE Digital, on 7 February 2023
John Jerrim, Sam Sims and Christian Bokhove
This is the third in a five part series on Ofsted inspections. Jump to: previous and next.
We have published a new academic paper investigating how Ofsted inspection outcomes vary across inspectors with different characteristics. This has been supported by the Nuffield Foundation and uses data we have pulled together on approximately 30,000 school inspections conducted between September 2011 and August 2019.
You can read a full version of our academic working paper along with our responses to some FAQs about the research.
This third blog in the series explores how Ofsted inspection judgements are related to inspection team size.
How big are Ofsted inspection teams?
Let’s start with some basic background.
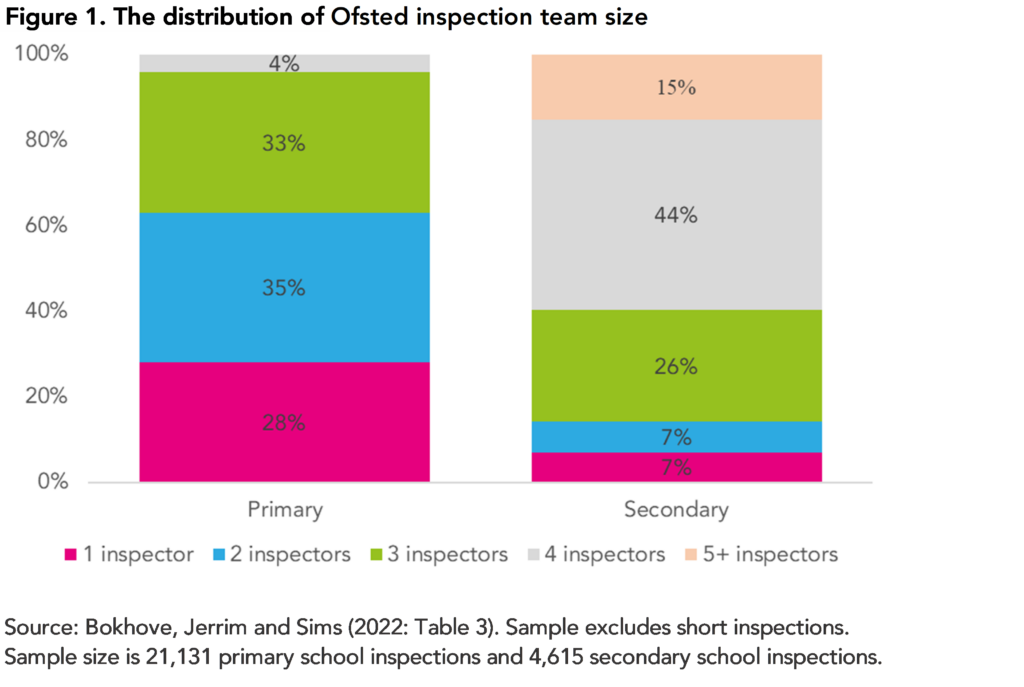
Figure 1 illustrates the distribution of Ofsted inspection team size for primary and secondary schools. This illustrates how roughly equal proportions of primary inspections are conducted by one (28%), two (35%) or three (33%) inspectors. It is very rare for primary schools to be inspected by a team of four inspectors or more (4%).
Secondary inspection teams tend to be larger. Most secondary schools are inspected by four inspectors or more (60%), with only a minority involving two inspectors or less (14%).
Do bigger inspection teams reach different judgements than smaller teams?
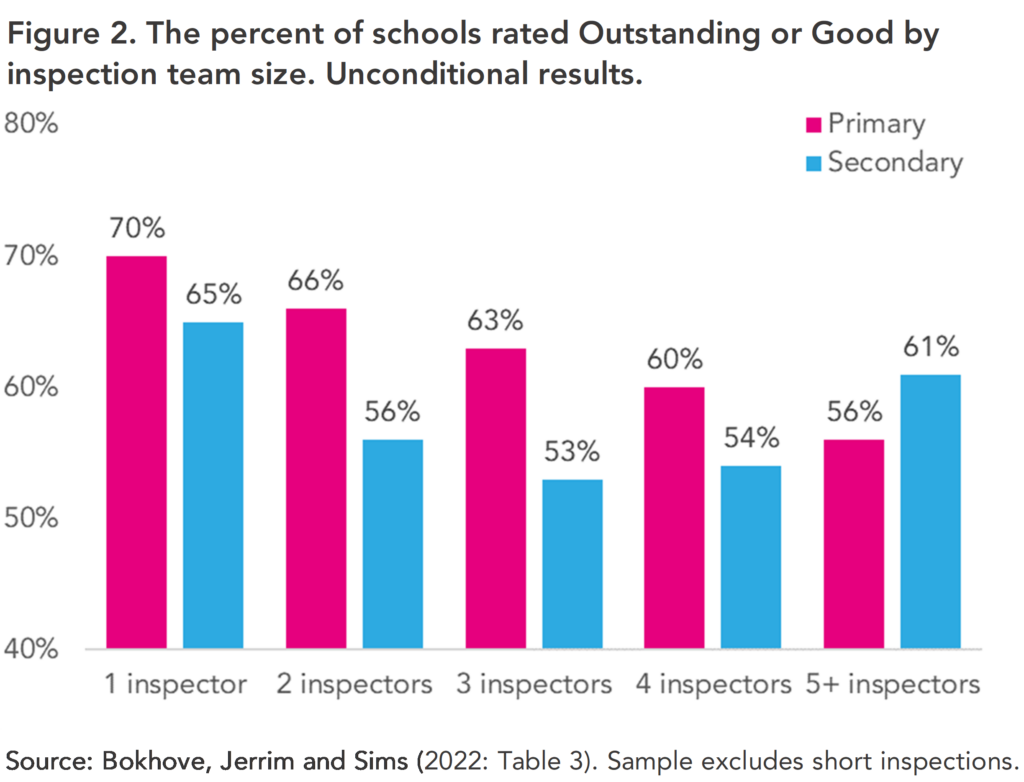
Figure 2 turns to how Ofsted judgements vary by inspection team size, focusing on the percent of schools awarded Outstanding or Good.
In primary schools, larger inspection teams seem to reach somewhat more negative judgements. 70% of primary schools inspected by a single inspector were judged to be Good or Outstanding, compared to 63% of those inspected by three inspectors (we should take results for primary schools inspected by five inspectors with a pinch of salt given the small sample size).
Interestingly, for secondary schools the opposite may hold true; schools inspected by five or more inspectors were slightly more likely to be rated as Good or Outstanding than those inspected by three or four inspectors (again, take the figure of 65% for a secondary schools inspected by a single inspector with a pinch of salt, given the small sample size).
Could this be due to bigger teams being assigned to inspect more problematic schools?
Like the difference found between HMIs and OIs in our second blog in this series, this is a possibility.
To probe this issue, we have estimated a set of ordinal logistic regression models controlling for background differences in the schools inspected by teams of different size (see notes to Table 1 for details).
Table 1 presents estimates from one such model for primary schools which controls for percent of pupils eligible for FSM, inspection type, prior Ofsted rating, school performance data, school absences, lead inspector gender and whether the lead inspector is an HMI.
A similar pattern seems to hold, although differences tend to be quite modest. Primary schools inspected by a single inspector have a 68% chance of being rated Good or Outstanding, compared to 64% of those inspected by three inspectors. The biggest difference seems to be with respect to the Inadequate grade, with primary schools inspected by a single inspector particularly unlikely to receive this judgement (3% for a single inspector compared to 6% for two or three inspectors).
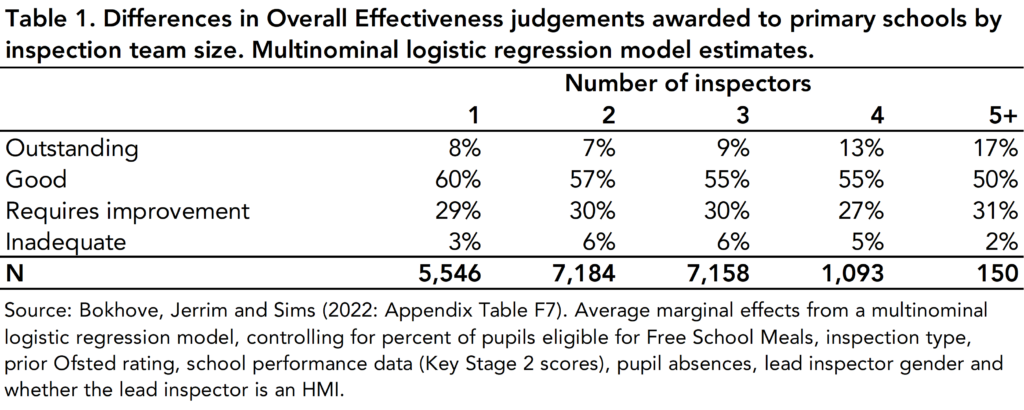
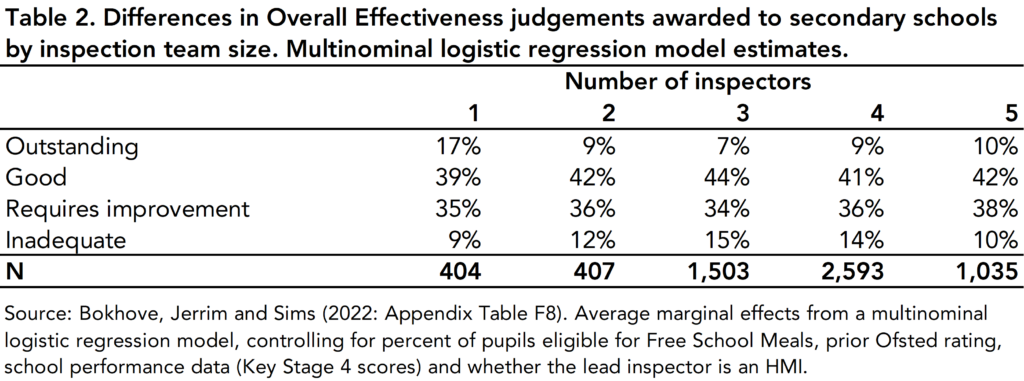
Table 2 presents analogous results for secondary schools. Interestingly, differences in inspection outcomes are somewhat less pronounced than for primary schools, particularly when we focus on groups with a reasonably large sample size (three, four or five inspector teams). The only statistically significant differences are between (a) teams of three inspectors being less likely to reach an Outstanding judgement and (b) teams of five or more inspectors being less likely to judge a school to be inadequate.
Conclusions
What are the key take-aways from above?
On the one hand, for primary schools we see inspection team size to be associated with inspection outcomes, though the difference is quite modest. We are talking about a 3 or 4 percentage point difference in the chances of being judged Outstanding or Good between an inspection conducted by a single inspector versus a team of three inspectors.
On the other hand, for secondary schools, we cannot detect much of a difference at all, with the potential exception of very large teams being slightly less likely to award an Inadequate grade.
This post was previously published on the FFT Education Datalab blog. Dr Christian Bokhove is Professor in Mathematics Education at the University of Southampton.

