How similar are the PISA and TIMSS studies?
By Blog Editor, IOE Digital, on 4 December 2017
Christina Swensson.
This is the fifth in a series of blogs that delve below the headline findings from the 2015 Trends in International Mathematics and Science Study (TIMSS). This blog investigates the similarities between TIMSS and the Programme for International Student Assessment (PISA), another large-scale study designed to assess pupil achievement across a number of countries. So how do the headline findings from the two studies compare?
PISA and TIMSS Cycles
TIMSS, administered by the IEA, has been carried out every four years since 1995, a total of six study cycles. The OECD started its own large-scale international survey in 2000 and has been running the Programme for International Student Assessment (PISA) every three years since then, also a total of six study cycles. The two studies do not normally coincide but they have done twice – in 2003 and in 2015.
Pupils in PISA and TIMSS
PISA and TIMSS target different groups of pupils. TIMSS investigates the performance of two groups of pupils: those in grade 4 (year 5 in England), who are generally aged between 9 and 10 and pupils in grade 8 (year 9 in England), who are generally aged between 13 and 14*. PISA assesses 15-year-old pupils irrespective of the school year they are in.
Selection of Schools and Pupils
In TIMSS, schools are selected randomly (from an IEA agreed sampling framework) to take part in the study, then a whole class of pupils within each school is selected to sit the TIMSS assessments. For PISA, schools are also selected randomly (this time in line with an agreed OECD sampling framework) but, in this study, a group of 15 year olds is selected randomly from within each school. In both studies, the sampling framework is constructed carefully to ensure the chosen group of schools will be representative of all schools in England in terms of region, gender, selection policy and performance.
The different approached to selecting pupils from within the study schools means that PISA pupils are spread across classes, so their learning experiences may differ if they have different teachers. Pupils in TIMSS are from the same class so their experiences of their maths and science teachers will be based on the same teacher.
Subject Coverage
TIMSS and PISA test different things, TIMSS being more curriculum based whilst PISA assesses the application of skills to real life problems. TIMSS focuses on assessing pupils’ knowledge and skills in mathematics and science, focusing very much on what they have been taught in school. In our blog looking at curriculum and assessment in TIMSS 2015, we discuss the extent to which the TIMSS test items are covered in the curricula in England and other high performing countries.
The TIMSS tests are based on a comprehensive analysis of mathematics and science curricula in the participating countries and the questions tend to be shorter and more focused on facts and processes.
PISA measures 15-year-old pupils’ reading, mathematics, and science literacy with the major domain of study rotating between reading, mathematics, and science in each cycle. Science was the main focus of the 2015 PISA study. PISA also includes measures of general or cross-curricular competencies, such as collaborative problem solving.
PISA is designed to be a test of functional skills that students have acquired, often in the format of real world problems with relatively longer text and instructions.
Participating countries
In 2015, 72 countries and economies took part in PISA – all 34 OECD members along with a number of partner countries and regions. Around 60 countries are actively involved in the IEA network and the majority of members took part in one or both of the TIMSS 2015 studies. A total of 57 countries and 7 benchmarking entities (regional jurisdictions of countries such as states or provinces) participated in TIMSS 2015. A total of 27 countries participated in both PISA and TIMSS, an increase from 17 in 2003. All four countries of the UK participated in PISA 2015 but only England participated fully in TIMSS 2015. Northern Ireland took part in the year 5 TIMSS study but not the year 9 one.
The National Centre for Education Statistics in the USA has collated useful tables showing the countries that participated in each cycle of PISA and TIMSS.
Mode of Assessment
Both PISA and TIMSS involve the administration of tests to school pupils along with background questionnaires for the pupils, their teachers and head teachers. Traditionally PISA and TIMSS have been paper-based surveys but in 2015 PISA moved predominantly to a computer based assessment, a move that TIMSS will emulate in 2019.
How comparable are the results?
Research has shown that TIMSS and PISA provide similar pictures of student achievement at the country level. A recent assessment published as a working paper by the German Institute for International Educational Research (DIPF) found a close alignment between country mean scores from both studies. The author, Professor Dr. Eckhard Klieme, Director of the Department for Educational Quality and Evaluation at DIPF, investigated the extent to which messages on student achievement in international comparison from TIMSS and PISA are consistent. He looked back at earlier research in this field and investigated possible explanations for differences between the latest findings from the two studies.
Focusing on the relationship between the 2015 performance of PISA pupils and the 2015 performance of the older TIMSS cohort, he found that 85% of the between-country variation in PISA Mathematics Literacy could be explained by TIMSS, and vice versa. He reported a similar finding for science.
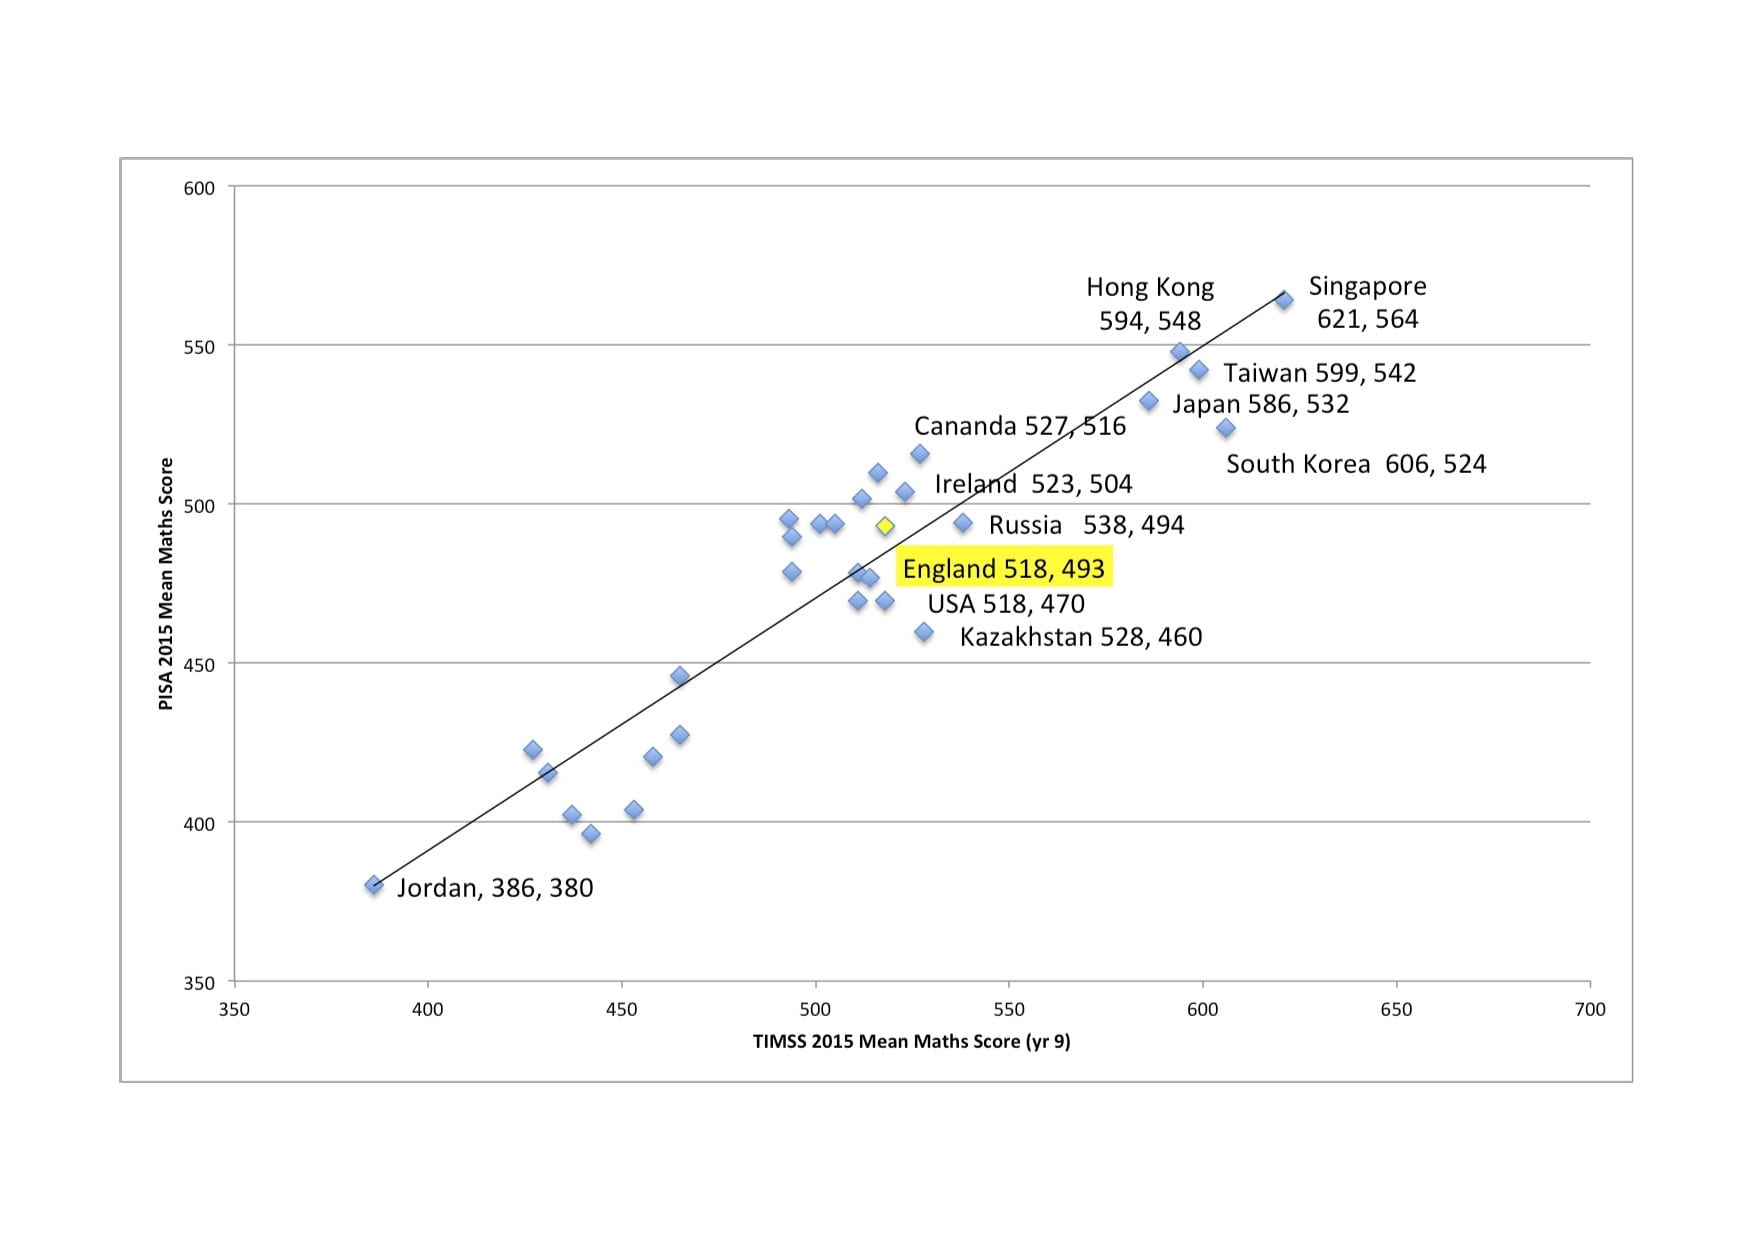
Eckhard Klieme’s analysis found some interesting minor deviations from the overall linear relationship. The high achieving East Asian countries seemed to do a little better in TIMSS mathematics than you would expect from their PISA results, while some Nordic and English-speaking countries (Norway, Sweden, Australia, Canada, Ireland, and New Zealand) did a little better in PISA. England was not included in the analysis but plotting England’s 2015 mathematics score from PISA (493) and England’s year 9 mathematics score from TIMSS (518) onto Klieme’s chart reveals a straightforward linear relationship in England’s data.
The chart below is similar to Klieme’s chart – it plots the 2015 mean maths score from PISA 2015 against the mean maths score from the year 9 TIMSS 2015 study for a selection of countries that took part in both studies (a slightly different sample of countries are represented in this chart).
We should note here that the TIMSS and PISA scales are different even though both are centred around 500 with a standard deviation of 100. More information on assessment scales can be found on the TIMSS and PISA websites.
Chart 1 – The relationship between the TIMSS 2015 (year 9) and PISA 2015 mean maths scores TIMSS and PISA Findings
England has consistently performed above the international average in TIMSS for both mathematics and science and above the international average in the PISA science tests, although the East Asian countries dominate both studies, with significantly stronger mathematics and science achievement across the board.
Mathematics
The TIMSS mathematics performance of year 9 pupils in England increased between 2011 and 2015, following a dip in 2011. England remains in the second highest group of countries with only six other nations scoring significantly higher than England in the most recent TIMSS year 9 mathematics tests.
England’s average mathematics score in PISA has remained stable over the last decade and the most recent study recorded a total of 19 countries with significantly higher PISA mathematics scores than England. In addition to the East Asian countries, several European countries have experienced improvements in mathematics and are now out-performing England.
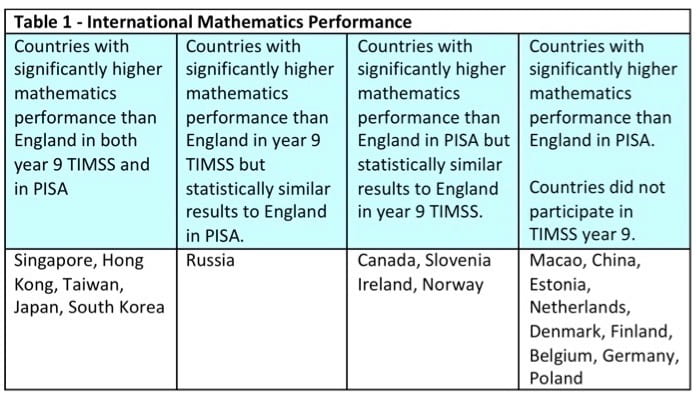
The table below looks at the mathematics performance of England in both PISA and TIMSS relative to the strongest performers in both studies.

Science
The performance of year 9 pupils in England in science has been one of relative consistency in TIMSS over the last twenty years. The average score of year 9 pupils in 2015 increased compared to 2011, although it was not a significant improvement. As with mathematics, England remains in the second highest performing group of countries with only five countries performing significantly higher than England in the year 9 TIMSS assessments.
Science was England’s top PISA subject in 2015, with 15-year-olds scoring higher in science (on average) than in either reading or mathematics. This was also the case in 2012. Whilst England has shown no material improvement in their score since 2006, it is notable that very few other countries have managed to substantially increase their scores over the same period. In fact, several other countries (including Finland, New Zealand and Australia) have seen their average science score decline by 10 points or more. There has been a sharp drop in average science scores in a number of high-performing countries between 2012 and 2015, including Finland, Hong Kong and South Korea. Only 9 countries had a higher mean science score than England in PISA 2015.
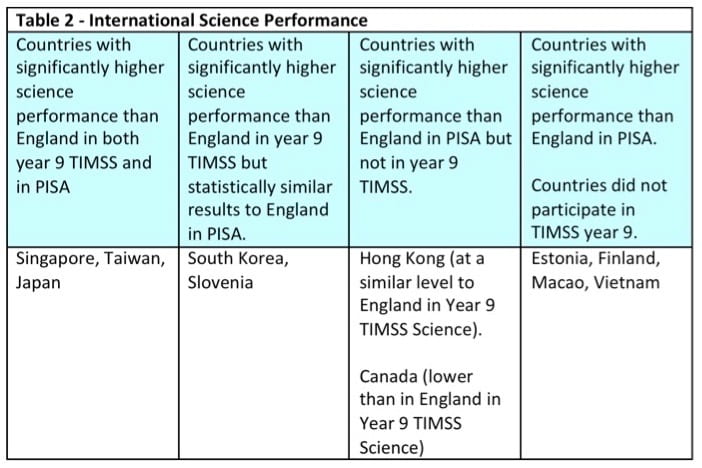
The table below looks at the science performance of England in both PISA and TIMSS relative to the strongest performers in both studies.

Progress in International Reading Literacy Study (PIRLS)
Although this blog has focused on TIMSS and PISA, it is worth highlighting the forthcoming publication of another international study run by the IEA – the Progress in International Reading Literacy Study (PIRLS), which assesses reading achievement at the fourth grade (year 5 in England) every five years. The results from PIRLS 2016 will be released on December 5 2017 and will report on 15 years of trends in reading achievement worldwide. It will be interesting to compare the relative performance of year 5 pupils in TIMSS 2015 with that of the year 5 pupils assessed for PIRLS 2016. A total of 50 countries and 11 benchmarking participants took part in PIRLS in 2016 with a further 14 countries and 2 benchmarking entities taking part in a computer based study called ePIRLS 2016.
Further information
You can find the full report on England’s performance in TIMSS here and the full report on England’s performance in PISA here. A number of papers summarising the key findings from both studies and their implications are available here. For a detailed breakdown of information from both studies please see the IEA data tables, which contain data for all countries participating in TIMSS and the OECD website, which holds a full set of data for all countries participating in PISA. Further information on PIRLS is available here.
IOE blogs on PISA and TIMSS are available on the IOE website under the heading of international comparisons.
Christina Swensson is Project Manager, TIMSS 2015
* The TIMSS target population is the grade that represents four years or eight years of schooling counting from the first year of compulsory schooling. For England this would be year 4 and year 8. However, IEA has a policy that students do not fall under the minimum average age of 9.5 years old (Grade 4) or 13.5 years old (Grade 8) at the time of testing, so England, Malta, and New Zealand assess pupils in their fifth year or ninth year of formal schooling.
2 Responses to “How similar are the PISA and TIMSS studies?”
- 1
-
2
Mike Kirst on the International Stage of Education wrote on 20 May 2022:

[…] In 2000, the OECD started its own large-scale international study and test, the “Programme for International Student Assessment (PISA)”. While both TIMMS and PISA were designed to compare educational achievement across countries, the two tests target different schools and pupils and differ in other important ways. TIMMS is more curriculum-based while PISA puts more of an emphasis on assessing “the application of skills to real life.”26 Most importantly for Mike, who prefers TIMMS over PISA, TIMMS focuses on what is actually taught; whereas, PISA emphasizes is what should be taught. (For a more complete comparison of TIMMS and PISA see, for example, “How Similar are PISA and TIMMs Studies”). […]
 Close
Close


These PISA analyses are all very interesting, but in theory they can be done by anyone with access to the data. Doesn’t the IoE have its own research to promote through its blog?
There are also many serious problems of reliability and validity with these tests. These need addressing before the results are accepted and discussed as fact. Where is recognition of these problems in the IoE blog posts? Where’s the academic circumspection?
Also, accepting and discussing PISA findings is to legitimise a way of seeing the world. This is a world of nation states, competition, league tables, and little true individuality. This illiberal world-view feeds into our schools and places pressure on them to perform in a particular way.
In schools, however, we need research that helps us make schooling an enriching and satisfying experience. Do these tests do that?