 Close
Close

Our 6th form research analysts
By Blog Editor, IOE Digital, on 2 September 2016
The Nuffield Research Placement programme allows 1,000 students in the first year of post-16 education who want to go on to study Science, Technology, Engineering or Maths at university to gain some work experience in their field of interest. It’s (usually) done during the summer for around four weeks. Students who don’t have a family history of going to university or who attend schools in less well-off areas are encouraged to apply.
For the past three years, the IOE’s Centre for Longitudinal Studies has provided work placements to five Nuffield students. Over the course of their placements, the students learn about the UK’s world-renowned cohort studies and get some hands-on experience analysing data.
In August 2016, students Daniel and Shihab spent four weeks at CLS learning how to use cohort data to understand physical activity across the life course. They summarise their findings below.
Daniel Powroznik
I originally applied to get a placement related to Maths since it’s the subject I want to study after sixth form. To be honest I didn’t know much about CLS at first, but I thought it would be good working with data and statistics. Over the course of the placement, I learned all about cohort studies and the significance of the work that had been done.
In my project, I used the 1970 British Cohort Study to see if physical activity tracked across life. In other words, if someone is physically active as a child, are they more likely to be physically active as an adult? I also looked at whether this relationship varied between men and women, and also whether there was a difference depending on family background.
I used data from the surveys carried out when the cohort members were aged 10 and age 30.
The charts below show the percentage of people doing different amounts of exercise at age 30 by amount of physical activity at age 10.

The charts show a number of patterns. Firstly, those who did no sports at age 10 were the most likely to also not exercise at age 30, giving support to the notion that physical activity does track over time. However, another interesting pattern is that a bigger proportion of those who did no exercise as a child also exercised every day as an adult, compared to those who exercised sometimes or often as a child. This maybe suggests that those who do decide to take up exercise as adults, after being inactive at a younger age, are more likely to be very dedicated to it and do it as often as possible.
By age 42, this positive story is less clear in the data. However, what does come through loud and clear is that more adults do no exercise at all at age 42 compared to when they were 30, regardless of their level of physical activity as a child: 37% of those ‘never/hardly ever’, 31% ‘sometimes’ and 25% ‘often’ doing sport at age 10.
This research has potential policy implications as it could show whether sport should be encouraged from the earliest ages and if it should be kept on the school curriculum throughout the school life.
I also looked at how physical activity varied across the genders. The graph below shows the amount of exercise men and women do at age 30 by their level of physical activity at age 10.

As you can see, for both men and women those who did no sports at age 10 were the most likely to do no exercise at age 30, with both men and women who often did sports at age 10 being the most likely to do some exercise at age 30. Also, in all activity groups, women were more likely than men to exercise every day.
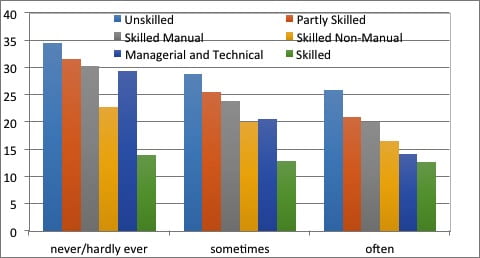
Physical activity was very strongly related to family background. The chart below shows that whatever the frequency of playing sport in childhood, those whose father had an unskilled job at the time they were born were the most likely to take no exercise at all at age 30, and those whose father had a professional or managerial occupation were the least likely to take no exercise.
For the future I would be interested to see if there is a difference in tracking exercise across the different regions of the UK and also looking at the amount of hours worked, and the participants’ wages.
Shihab Raihan
I applied to Nuffield stating my core interests were in Maths and statistics and it was great to end up getting a placement at CLS. I have improved my data analysis and coding skills, which is perfect as I am aiming to study a course at university which involves a high level of mathematics, such as Engineering and Computer Science.
My study’s objective was to look at how physical activity tracks across life and how this is affected by gender and socioeconomic background, using the 1958 National Child Development Study. Being physically inactive from a young age can lead to poor health conditions in the future, so I also looked whether being physically active at any age prevents, or reduces, the chances of being disabled in adulthood.
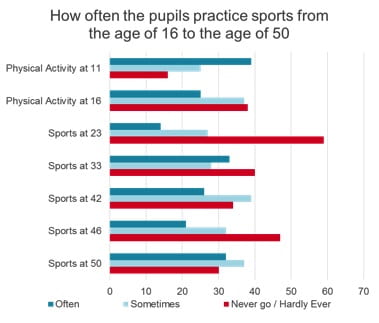
I started looking at how much physical activity the cohort members did at different ages. We can see that children at age 11 are the most likely to be physically active, with young 23-year-old adults being the most inactive, followed then by 46-year-olds. There are a few possible explanations for this. Perhaps, adults at age 23 are busy looking for a job or in progressing through their career. Whereas at age 46, adults may feel less able to practice specific type of sports, like rugby, because they may not be in the right shape for playing such sport. Nevertheless, children who have been physically active and fit from a young age don’t need to put as much effort as someone who just started to be physically active, at age 46 for example.
There was also a trend for people who did physical activity at one age to be more physically active later on. For example, 44% of children who ‘often’ went to a park at age 11, ‘often’ played outdoor games or sport at age 16. This compared to 31% who ‘sometimes’ went to a park at 11 and 28% who never went to a park at age 11.
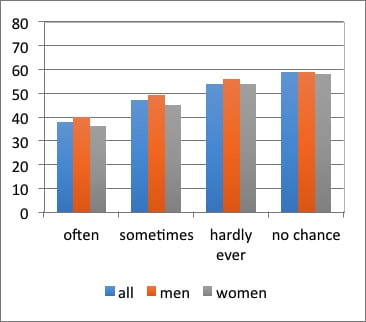
Looking later on, we see that teenagers who did not play out at age 16 were the most likely to not do any exercise in an average week at age 46, and this pattern was true for both men and women. However, when looking at this by father’s social class at the time they were born in 1958, big differences emerged.
% who took no weekly exercise at age 46 by how often played sport at age 16

I then looked at how physical activity and disability status were related. I found a clear relationship between the two: 18% of all adults in the study at age 55 were diagnosed with a disability, but the more often you previously took exercise, shown here at age 23, the less likely you are to be disabled at age 55.

For future research, I would be interested in knowing if the distance from the child’s house to the nearest leisure centre affects them from practicing sports. Moreover, it would be brilliant knowing if these trends differ across countries, as this data is limited to UK citizens.
We would like to thank all the cohort members for taking part in the studies over the years and allowing the data collected to be used for research. Their contributions allow for discoveries to be made about our society and are the catalyst for real changes on how we live our lives.

One Response to “Our 6th form research analysts”
- 1

Good to read this.