 Close
Close

Welcome to the CDLD Blog
By Admin, on 8 October 2020
The CDLD Blog
Welcome to the Child Development and Learning Difficulties (CDLD) blog. This blog is a forum for staff, students, alumni and guests to write about and around CDLDs thematic areas of research and engagement.
Our focus areas
CDLD focuses on research that supports children’s learning and educational practice. Our blogs relate to a wide range of aspects related to children’s development and education, each underpinned by research and evidence of best practice. These include:
- Development in individuals with Williams syndrome
- Supporting children with SEND in the classroom
- Mathematical development in the early years
- Educational technologies and apps
On each of these pages you can find some useful resources for you to download for free.
We also publish regular newsletters about activities at the CDLD lab. You can find our newsletters here: https://blogs.ucl.ac.uk/cdld/cdld-newsletters/
Mathematical difficulties in Williams syndrome and how to provide support
By Admin, on 6 May 2024
By Professor Jo Van Herwegen & Professor Victoria Simms
Our research has focused on mathematical skills in children and adults with Williams Syndrome (WS) and compared their skills to typically developing children and adults as well as those with Down Syndrome (DS). In addition, we have reviewed existing studies that have previously examined mathematical skills in WS. For more information about our work, see details below. This blog is based on our own research as well as the findings of our review.
What do we mean by mathematics?
First of all, mathematics is a really complex subject with many components. Mathematics is made up of many different types of concepts and skills. To be successful in mathematics we must know things like being able to recognize and name digits, know the meaning of number words, understand the meaning of counting, knowing how numbers fit together in a system and realising the relationship between operations, such as that addition is the reverse of subtraction. We must also have good skills, such as being able to count accurately, carrying out addition and subtraction procedures and tackle word problem solving.
What do people with WS find difficult?
Our own research has shown that all people with WS struggle with mathematics. All verbal children and adults do learn the counting names and are able to count to 20. However, few are able to count onwards from a number different to 1 or to count backwards, due to poor working memory skills. Therefore, people with WS may “get lost” in the number word list when being asked to do something that they are not used to doing or when they get distracted. So, although we sometimes hear that people with WS are good at counting, we should put that in context: Yes, the knowledge of counting names in WS tends to be better than most children with DS, but they do struggle with numbers beyond 100 as well as counting tasks that really push working memory skills.
Secondly, many children with WS struggle to understand the meaning of counting or what counting is for: When you count items in a set, it is so that you know what size that set is. Yet, many people with WS make errors when counting. Partly, these errors can be explained by a lack of pointing when counting the items and a lack of keeping track of items that have already been counted compared to those items that have not yet been counted. However, even when asked to give a number of objects (a task that does not involve pointing or working memory), many people with WS give a random number of items showing that they struggle to understand what counting is for.
People with WS usually display poor visuo-spatial skills, this means that they struggle with orientation of numbers and letters and therefore digit recognition can be tricky for some, especially when double (e.g. 21) or triple digits are involved (e.g. 341). These poor visuo- spatial skills may also impact on counting skills and being able divide up counted and not- yet-counted objects.
People with WS are quite good at estimating small numbers and are able to recognize the number of objects (up to 5) quite quickly. However, their estimation of larger numbers is poor and a number of studies have now shown that their ability does not exceed that of 8-9 year old typically developing children. For example, when being shown 9 red dots and 14 blue dots, people with WS find it very difficult to say which set has more without counting. Yet, this is a task that young typically developing children find quite easy. In addition, people with WS find it difficult to understand how numbers relate to each other, or to estimate where numbers go on a number line. This all suggests that their organisation of how numbers and quantities are organized in their brain is different and might cause mathematical difficulties.
When it comes to addition and subtraction, many children and adults with WS manage to solve simple sums that use single digits and do not exceed the number 16. However, we have no research about more complex sums. As we know that people with WS struggle with double digit recognition, these larger sums might be a challenge for them.
Overall, across all aspects of mathematics, except for small number estimation, people with WS may show difficulties throughout their lives.
What can you do about it?
Our review of existing research has shown that there are no intervention studies that have assessed how to improve mathematical skills in people with WS. There are no studies that have evaluated what works in the classroom in terms of mathematical practice for children with WS. So we can only make an informed guess based on what we know about mathematical abilities in typically developing children and studies that have examined what works for other children that have mathematical difficulties.
- 1) Improving number names: Although the knowledge of number names is delayed, children with WS are able to learn the number names and songs can particularly help children with WS. Actually there are a number of studies that suggest that the verbal abilities might, to a certain extent, help children with WS compensate for their non- verbal mathematical difficulties.
- 2) Pointing: Children with WS rarely point, especially younger ones. So try and find opportunities for children to point at things (by putting objects out of reach for example or by showing them two things one of which they really like and ask them to point to what they want). Also praise them and respond when they point. Pointing can help them when counting things later on.
- 3) Number line skills: Understanding how number relate to each other is very important for solving mathematical problems. There is good evidence to suggest that playing very simple board games- like snakes and ladders, helps children understand the number line (i.e. that numbers go from 1-10, with small numbers on the left and large numbers on the right). Playing games in which children have to put numbers in right order or amounts/sets of objects from small to large may also help.
- 4) Set sizes: Practicing comparing small sets of objects may help estimation skills. Share out two small sets of sweets and ask them to guess who has more! This will be motivating but also useful.
- 5) Cardinality: Task a bag of toys and ask children with WS to take out a specific number of items and give them a sticker each time they give the correct number of items. As children find this very difficult it is OK to start with numbers 1 and 2.
6) Digit recognition: As digit recognition difficulties are partly caused by visuo-spatial issues using larger font size, more space between sums (and even better just to have 1 per work sheet) as well as using colour to show how the digits go together (in 12 both numbers are blue but in 1 and 2 each number is a different colour) can help people with WS.
Also children with WS have working memory difficulties and will find it hard to keep track of items counted or to manipulate information in their minds only. So teaching them strategies of how to break sums down, how to keep track of items counted (line items to be counted up!) and encourage the use of fingers might really help them.
As with all learning in WS, it can take a very long time for people with WS to show true understanding and repetition is key. In addition, we know that some days people with WS can show good understanding of something and the next time it seems like they have forgotten everything (due to anxiety, lack of motivation, lack of concentration, sleep, who knows?!). Therefore, what works one day may not work on another day but luckily maths is all around us and thus, it should be easy to implement some maths activities in your daily routines. But also, motivation is key so using their favourite topic to cover some maths questions will really help them (e.g., How many people fit in that plane/train? Is that more than on the other plane/ train? How long it is the extension of that hoover? Is that longer than the other one?).
Some examples of maths in daily life:
- When driving in the car there are a lot of digit recognition games you can play: speedlimits, road numbers, car registrations, they all contain different digits!
- When shopping you can talk about the amount of items in your trolley, how thatcompares to people around you and how much you think you need to pay. This
game is good for large number estimation.
- When a child or adult with WS asks for something (sweets, money, anything to eatlike three fishfingers, four beans, one potato) ask them to count out the number of
items.
- If your child likes to line up toys, you could for example stick stickers with numbersor quantities (a number of dots) on these toys and use these and your child’s fondness of lining up toys to improve their understanding of how numbers relate to each other.
There are many more examples of how you can incorporate maths teaching in daily life, without the need to sit at a table and complete some worksheets. If you have any good examples, do get in touch!
References:
- Van Herwegen, J., & Simms, V. (2020). Mathematical development inWilliams syndrome: A systematic review. Research in Developmental Disabilities, 100, 103609. doi: 10.1016/j.ridd.2020.103609
- Van Herwegen, J., Ranzato, E., Karmiloff-Smith, A., & Simms, V. (2020). Foundationsof mathematical development in Williams syndrome and Down syndrome. Journal of Applied Research in Intellectual Disabilities 33(5), 1080-1089.
- Simms, V., Ranzato, E., Karmiloff-Smith, A., & Van Herwegen, J. (2020). Understanding number line estimation in Williams Syndrome and Down Syndrome. Journal of Autism and Developmental Disabilities 50(2), 583-591.
- Van Herwegen, J., Ranzato, E., Karmiloff-Smith, A., & Simms, V. (2019). Eye movement patterns and approximate number sense task performance in Williams syndrome and Down syndrome: a developmental perspective. Journal of Autism and Developmental Disabilities. Advance online. doi: 10.1007/s10803-019-04110-0
- Van Herwegen, J., Costa, H.M., Nicholson, B., & Donlan, C. (2018). Improving number abilities in low performing pre-schoolers: symbolic versus non-symbolic training programmes. Research in Developmental Disorders, 77, 1-11.
- Costa, H.M., Nicholson, B., Donlan, C., & Van Herwegen, J. (2018). Low performance on mathematical tasks in preschoolers : the importance of domain-general and domain-specific abilities. Journal of Intellectual Disability Research, 62(4), 292-302.
- Van Herwegen, J., Costa, H. M., & Passolunghi, M. C. (2017). Improving approximate number sense abilities in preschoolers: PLUS games. School Psychology Quarterly, 32(4), 497-508.
- Karmiloff-Smith, A., D’Souza, D., Dekker, T., Van Herwegen, J., Xu, F., Rodic, M., & Ansari, D. (2012). Genetic and environmental vulnerabilities: The importance of cross-syndrome comparisons. PNAS 190(2), 17261-17265.
- Van Herwegen, J., Ansari, D., Xu, F., & Karmiloff-Smith, A. (2008). Small and large number processing in infants and toddlers with Williams syndrome. Developmental Science, 11(5), 637-643.
Mathematical abilities in Williams Syndrome and future directions
By Admin, on 11 May 2023
Blog by Unta Taiwo and Stella Xu
Mathematical skills are an essential part of everyday living. From preparing a meal, setting a table, planning a daily schedule, or embarking on your weekly shop. We need to understand the quantities we need when we’re hosting dinner with friends or deciding how many apples to buy for a weekly supply. Other calculations come in handy when we are working out how much to pay for a bus fare, or a birthday present. Numerical skills, also referred to as mathematical abilities, prepare us for independence in our adult lives. Research has shown that, generally speaking, individuals with Williams syndrome can recognise and count smaller numbers. However, when it comes to comparing quantities and estimating the size of a set of objects, individuals with Williams syndrome are behind typically developing children (Van Herwegen & Simms, 2020). For example, children and adults with WS find it difficult to identify where numbers go along a number line (Simms et al., 2020) or understanding how sets of objects relate to each other (which one is larger/ has fewer) (Van Herwegen et al., 2020). Understanding how numbers relate to each other or what they mean forms the basis for more complex maths skills like arithmetic and can help identify mistakes or check answers when solving mathematical problems. For example, have you ever used a calculator to add large numbers and then decided that you must have made a mistake? It is your understanding of how numbers relate and what they mean, i.e. your Number Sense abilities, that help you estimate that the result on the calculator was wrong. Current evidence suggests that Number Sense abilities are delayed and may develop atypically in children with WS from infancy onwards.
It is important to understand the specific difficulties related to the development of mathematical abilities in individuals with Williams syndrome so that we can think about targeted interventions and guidance for parents and practitioners to improve learning outcomes. In the Child Development and Learning Difficulties (CDLD) lab we have a number of studies with the aim to better understand the specific strengths and difficulties associated with mathematical development in Williams syndrome:
HoME intervention study:

Photo provided by Unsplash
This intervention involves parents to deliver very short foundational maths games in the home environment over two 5-week blocks. Evidence from previous research (Van Herwegen et al., 2018) has shown that these games improved maths outcomes for children with mathematical learning difficulties. Each game is designed to be flexible to family dynamics, so games might be adapted to include siblings or other relatives. These carefully designed activities can be played in and around the house, including around the dinner table, whilst having a bath, walking to school, or getting ready for bed. Each programme will involve a degree of multi-sensory activities for engagement that tap into tactile, auditory and visual senses.
Recruitment:
We are looking for parents of children with Down syndrome or Williams syndrome aged between 5-11 years to take part in this intervention study. This intervention will be starting in the new year. If you are interested taking part in this study and would like more information, please get in touch with Unta (unta.taiwo.14@ucl.ac.uk).
Study on development of mathematical abilities

Photo provided by Unsplash
Currently very little is known about the predictors and the longitudinal development of mathematics in individuals with Williams syndrome. This study is therefore focusing on investigating which cognitive abilities at infancy may affect later math performance at school age. The results of this study will inform parents and practitioners on what areas to work on to improve mathematical achievement in school, as well as everyday life experiences. Part of this research will be pulling together findings from different UK labs that focuses on Williams syndrome, so we can better understand the long-term development of mathematics.
Recruitment
We are looking for parents of children with Williams syndrome aged between 5-18 years to take part of this study. This study will begin in June. If you are interested in taking part and would like to know more, please get in touch with Stella (stella.xu.21@ucl.ac.uk).
“You only need numbers for maths classes”
By Admin, on 12 October 2022
by Jo Van Herwegen
Dyscalculia is a learning difficulty that includes persistent difficulties with understanding numbers and can lead to a number of difficulties related to mathematics, including understanding time and money1. Dyscalculia affects about 1 in every 20 students in a classroom2 and is thought to occur as often as dyslexia.
Despite the fact that dyscalculia and dyslexia have similar frequencies, our latest survey shows that dyscalculia is less well known by the general public and also educators, compared to dyslexia. In our recent focus groups we explored how we can raise awareness about dyscalculia and address why teachers might have fewer knowledge about this learning difficulty compared to dyslexia. One of the hypotheses we explored was that teachers might have fewer opportunities to learn about dyscalculia. Indeed, our survey results show that dyscalculia was less often covered in initial teacher training and that there were fewer training opportunities for continued professional development related to dyscalculia compared to dyslexia. However, participants in our focus groups also stated that there are fewer opportunities to identify children with dyscalculia in the classroom. As one of the teachers stated: “You only need numbers for maths classes, whilst you need good reading abilities for all classes and thus, if you are not teaching maths then you might not notice that the child has any maths difficulties or dyscalculia”.
When reading about the number of A-levels obtained by students this year, I noticed a table with the top 10 A-level subjects and this reminded me of the comment by the teachers about the importance of numbers for maths classes only. The picture below shows the top 10 subjects for A-levels.
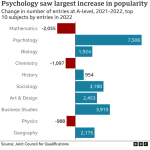
(taken from BBC website: https://www.bbc.co.uk/news/education-62498629)
As you can see from this picture, all 10 subjects require being good with numbers:
- Mathematics: I think this one is obvious why number knowledge is important
- Psychology: good number knowledge is important to understand statistical analysis and research outcomes.
- Biology: Understanding numbers allows for description of how molecules move in and out of cells, how bacteria shuttle through blood vessels, how drugs get broken down in the body and many other physiological processes.
- Chemistry: again, this is a more obvious one as students will have to understand formulas, calculate percentages use an appropriate number of decimal places in calculations, e.g. for pH calculation.
- History: well you might need to get your dates right on a history exam and thus need to know the difference between 1465 and 1645.
- Sociology: unless you use quantitative statistical analysis to analyse data from experiments, there isn’t much direct understanding of numbers involved. However, in order to develop sociological models and logical proofs, understanding of mathematical concepts and logical concepts will be beneficial.
- Art & Design: Symmetry, balance, exactness, and proportion are such important parts of a design and art. Proportions and ratios are mathematical concepts that are often used by graphic designers to make their designs well-balanced and attractive.
- Business studies: Business studies require an understanding of elementary arithmetic, elementary algebra, statistics and probability. For some management problems, more advanced mathematics – such as calculus, matrix algebra and linear programming – is applied.
- Physics: Mathematics is often described as an essential tool for Physics and in order to do calculations good number knowledge is required.
- Geography: Different areas of mathematics are used for different areas of geography but good geometry and number knowledge is required to make and read geographical maps.
Seeing that good number knowledge is relevant to most top-10 A-level subjects, it is important that teachers have a good understanding of dyscalculia and how this may affect students in the classroom so that students with dyscalculia can receive support for all school subjects, and not just for maths classes.
Want to find out more about dyscalculia?
Check out our new dyscalculia toolkit: https://blogs.ucl.ac.uk/cdld/2022/10/06/dyscalculia-toolkit/
References
- Van Herwegen, J. (2020). Math Disorder. In: S. Hupp & J. Jewell. The Encyclopedia of Child and Adolescent Development. John Wiley & Sons: Chichester, UK.
- Morsanyi, K., van Bers, B., McCormack, T., & McGourty, J. (2018). The prevalence of specific learning disorder in mathematics and comorbidity with other developmental disorders in primary school-age children. British journal of psychology (London, England : 1953), 109(4), 917–940. https://doi.org/10.1111/bjop.12322
Dyscalculia Toolkit
By Admin, on 6 October 2022
What do you know about dyscalculia?
Take our Quiz here: https://qualtrics.ucl.ac.uk/jfe/form/SV_29q4Kjxhphv6Aya
Extracting the voice of young people with intellectual disabilities: Top tips
By Admin, on 11 July 2022
We recently co-produced a workbook with young people with Williams syndrome (WS) aged 5 to 15 years old about their education, named “My Own Williams Learning”. As part of this co-production we wanted to obtain the voice and opinion of young people with Williams syndrome about what Williams syndrome is, what children might be good at or struggling with and what support or good practice in school looks like. The booklet contains advice and activities to help children with WS understand their own learning but can also be used by parents and teachers. This booklet will be available soon via the Williams Syndrome Foundation website (https://williams-syndrome.org.uk/clinical-guidelines/).
As part of the co-production process of this booklet we reflected on best practice to elicit the voice of young people who have intellectual disabilities. Although most young people with Williams syndrome are very talkative, they have mild to moderate intellectual disabilities and their language abilities are rarely age appropriate. In addition, they often have difficulties with language comprehension, working memory difficulties and maintaining conversations. As such, the voice of children with WS has rarely been captured before and often parents are asked to report on their child’s behalf. In our latest research, we showed that only 7% of the Education Health and Care plans of 33 children with WS explicitly reported the child’s voice in section A. Most of the EHCP’s used third person discourse to describe the child’s wishes, strengths and difficulties (Palikara et al. in press).

Photo by Jason Rosewell on Unsplash
We worked with the children either one-to-one or with small groups of up to 3 children at one time (like a focus group). All of the sessions took place online due to COVID-19.
Below are some tips that can be used by teachers and parents (and researchers!) to elicit the voice of young people with WS.
- Reduce working memory load by asking simple short questions and use visual reminders. It often helps to repeat the question in the same way (not rephrase it).
- Provide waiting time of up to 10 seconds to allow them to process the question and to formulate answers.
- Use images to introduce topics. So for example, when asking what children might be good at or need help with, it might be helpful to have pictures of topics and issues at school: maths, reading, listening, writing but also toilet, hand washing, PE, going on the bus. There are existing pictures from visual time tables that might be handy here. If there are a lot of pictures to go through, it might help to do several rounds of sorting these with the child into piles of ‘I need help with this’, ‘ I am good at this’. So introduce the pictures one by one and ask the child to sort them.
- If working with a group of children, it helps to ask the questions in the same sequence each time to support predictability of their turn.
- Finger puppets could be used to keep participants’ attention on the screen, but only when attention is waning.
- Action songs to which the children could participate can help to provide a break from talking and listening. We used them approximately each fifteen minutes.
References
Palikara, O., Ashworth, M., Castro-Kemp, S., & Van Herwegen, J. (in press). All views my own? Portraying the voices of children with complex neurodevelopmental disorders in statutory documents
Why the rise in number of SEN children, especially in the early years?
By Admin, on 4 April 2022
By Dr Jo Van Herwegen
The government announced additional funding for supporting children with Special Educational Needs (SEN) in schools during the autumn budget in 2021. However, recently we were contacted by schools who have seen a rise in number of children with SEN, especially in the early years, which may question if this additional funding is going to be sufficient to make a difference. In this blog, I explore the evidence about this and factors that could potentially explain changes in numbers.
However, before I start, I would like to explain some of the terminology:
SEN support= those children that require additional support often provided by teacher and SENCo but the child does not have EHC plan.
EHCP= A pupil has an EHC plan or statement of SEN when a formal assessment has been made. A document is in place that sets out the child’s need and the extra help they should receive.
What does national data tell us?
- The number of pupils with special educational needs (SEN) in England has increased for a third consecutive year to 1.37 million in January 2020. The percentage of pupils with an EHC plan has risen to 3.3% of the total pupil population1. See Figure 1 below,
- Across England: SEN is most prevalent among boys at age 9 (23% of all boys), and for girls at age 10 (13% of all girls)2. In 2-year-olds the proportion with SEN increased from 3.2% to 3.5%. For 3- and 4-year-olds the percentage with SEN increased from 6.3% to 6.6%. Both the percentage with an EHC plan and the percentage with SEN support increased1.
- Factors that influence SEN diagnosis: Those identified with SEN are more likely to speak English at home, are eligible for free school meals and related to ethnicity SEN are most prevalent in travellers of Irish heritage and Gypsy/Roma pupils with 30% and 26% respectively. Travellers of Irish heritage and black Caribbean pupils had the highest percentage of pupils with EHC plans (4.5% and 4.4% respectively).
- If we look at different types of primary need we see that: autism is most common need for those with an EHCP across all ages from 4 to 17 (for age 4 37% of those with EHCP have primary need of autism), whilst majority of 4 year-olds on SEN support (59%) have a primary type of need of Speech Language and Communication needs (SLCN)2.
So nationally indeed there is a rise in SEN, including during the early years and in preschool years we see indeed that most frequent SEN is autism for those with EHCP and SLCN for those on SEN support. There is evidence that the increase is larger is some authorities than others.
Figure 1 Percentage of children with SEN per year

Why is there this rise in SEN numbers?
There is not a lot of research in this area:
- The history answer:
From 2010 to 2015 there has been a steady decline in numbers of SEN, the first drop between 2010 and 2014 has been argued to be a response to Ofsted report in 20103 related to the fact that SEN might have been over-diagnosed before 2010. The second drop seen from 2014 onwards has been blamed on the fact that the SEND reforms kicked in and many children were not transferred from one system to the new system4. The argument is that the steady increase we have seen in last few years is just the catching up of the system with children now having been re-assessed appropriately and re-assigned to the appropriate level of support.
- Greater awareness:
SEN has been in the spotlight in the media. This means more awareness on what support children are entitled too. In addition, more teachers are now trained on SEN and thus are likely to spot the early indicators of SEN more. This would also fit with the observation that there is a rise in SEN in the early years. The new Early Years Foundation Stage Profile assessments at age five have large effects on the chances of an individual child being identified with SEND according to a new report5 by the Education Policy Institute.
When it comes to the different types of needs, there have been specific awareness campaigns for autism6 and for language development needs7. In our own research, we see that people endorse fewest neuromyths related to autism8 and we also speculated that awareness campaigns around autism may have helped this.
- Assessment and diagnostic criteria
The prevalence of autism seems to be rising with currently 1-2% of children in the UK receiving a diagnosis9. However, this rate seems to vary between countries. A number of reasons have been proposed for this increase, including more awareness as well as changes to the diagnostic criteria (introduced in 2013) and the broadening of the spectrum10. However, recent research has shown that the differences between those with a diagnosis of autism and without one are becoming smaller11, suggesting indeed that autism might be over-diagnosed in some cases.
An explanation for why more autistic children receiving an EHCP might be explained by the mismatch on how support is assessed: whereas schools (who make decision on SEN support) focus mostly on communication, language and literacy skills, local authorities (who assess for EHCP support) make decisions that are more aligned with personal, social and emotional development5.
Yet, we need to be careful with conclusions made about increases in specific types of needs categories as diagnostic labels such as autism and language delay or SCLN are not always consistently applied, especially in the early years, and often language difficulties co-occur with other developmental disorders, including autism12.
Why differences in local authorities?
- Different types of populations: SES, ethnicity,…. See data from1 and 2
- Types of schools within a certain area: parents move to certain areas to obtain provision. This was also confirmed by recent EPI report5: the chance of a child being identified with SEND (post-code lottery effect) was explained by the practices within a school rather than individual aspects of the child itself or the local authority.
Is there any evidence of misidentification of SEN in the early years?
The EPI report5 did find that summer born children were over-represented with SEND, and that the relative age effect appeared to be mediated through lower Early Years Foundation Stage Profile attainment for younger children. This finding suggests that assessors of the EYFSP fail to take into account the development that occurs in children over a 12 month time span.
References
- https://assets.publishing.service.gov.uk/government/uploads/system/uploads/attachment_data/file/985162/Special_educational_needs_Publication_May21_final.pdf
- https://assets.publishing.service.gov.uk/government/uploads/system/uploads/attachment_data/file/814244/SEN_2019_Text.docx.pdf
- OfSTED (2010). The Special Educational Needs and Disability Review: A Statement is Not Enough. London: OfSTED.
- Curran, H (2015) SEND reforms 2014 and the narrative of the SENCO: early impact on children and young people with SEND, the SENCO and the school.In: BERA Annual Conference, 15-17 September 2015, Queen’s University, Belfast, Northern Ireland.
- Hutchinson, J (2021). Identifying pupils with special educational needs and disabilities. Education Policy Institute. https://epi.org.uk/wp-content/uploads/2021/03/SEND-Indentification_2021-EPI.pdf
- National Autistic Society. (2021). Professional development. Retrieved from https://www.autism.org.uk/what-we-do/professional-development
- Raising awareness of developmental language disorder. https://radld.org
- Gini, S., Knowland, V., Thomas, M. S. C., & Van Herwegen, J. (2021). Neuromyths About Neurodevelopmental Disorders: Misconceptions by Educators and the General Public. Mind, Brain, and Education. doi:10.1111/mbe.1230
- Russell, G., Rodgers, L. R., Ukoumunne, O. C., & Ford, T. (2014). Prevalence of parent-reported ASD and ADHD in the UK: Findings from the millennium cohort study. Journal of Autism and Developmental Disorders, 44(1), 31–40. https://doi.org/10 .1007/s10803- 013- 1849- 0
- American Psychiatric Association (Eds.) (2013) Diagnostic and statistical manual of mental disorders: DSM-5. 5th edn. Washington, DC: American Psychiatric Association.
- Rødgaard, E. M., Jensen, K., Vergnes, J. N., Soulières, I., & Mottron, L. (2019). Temporal Changes in Effect Sizes of Studies Comparing Individuals With and Without Autism: A Meta-analysis. JAMA psychiatry, 76(11), 1124–1132. https://doi.org/10.1001/jamapsychiatry.2019.1956.
- Dockrell, J. E., and Hurry, J. (2018). The identification of speech and language problems in elementary school: diagnosis and co-occurring needs. Dev. Disabil.81, 52–64. doi: 10.1016/j.ridd.2018.04.009
Neuromyths in Education
By Admin, on 10 December 2021
By William Taylor
BSc Placement Student
What Are Neuromyths?
Neuromyths are defined as:
“A misconception generated by a misunderstanding, misreading, or misquoting of facts scientifically established to make a case for the use of brain research in education and other contexts”
(OECD, 2002)
How do they Originate?
There are three ways that have been noted in which Neuromyths can arise:
1.Distortion of Scientific Fact – Neuromyths stem from undue simplification of scientific facts. – Example: Left and Right Brained Individuals – Research on the specialisation of brain hemispheres led to the belief that individuals are differentiated between left and right-brained, and that each group has a specific learning style: with left-brain people being better at language and right–brain people being more creative. Yet, although the two brain hemisphere’s are lateralised, all people have a left and a right brain.
2.Offspring of Hypotheses – In other cases hypotheses may be held true but then later disproved by science, yet the content of the original hypothesis may still be regarded as the truth. For Example: The Mozart Effect – A study was done on the effects of different music types on spatial capacities and showed that listening to Mozart music resulted in an increase of 8-9 IQ points. It was later disproved that listening to Mozart makes people smarter, but the concept of the Mozart-Effect was still shown to be familiar, with ”80% of 496 people in California and Arizona were familiar with the Mozart Effect” (Pasquinelli, 2012)
3.Misinterpretations of Scientific Results – Myths can be based on accurate scientific information that has been interpreted in an erroneous way. – Example: Critical Period Theory – States that learning depends on synaptic growth and the first three years of life are the best period for learning. This myth ”fails to take into account the different maturation rates of the human brain and lifelong learning based on functional plasticity” (Pasquinellie, 2012). For example, the brain is also very receptive to learning and plastic during puberty!
New study at CDLD
A new study by colleagues from CDLD examined the endorsement of neuromyths about the typically developing brain and myths related to neurodevelopmental disorders by adults working in education and those not working in education.
Hypotheses
1.It was predicted that all groups would endorse some neuromyths, but neuromyths concerning neurodevelopmental disorders would be more common.
2.It was predicted that mainstream class teachers would hold less incorrect belief than the general public, and that SEND teachers would hold fewer incorrect beliefs than mainstream teachers.
3.It was predicted that those with more familiarity with a disorder would hold fewer incorrect beliefs, and that those with regularly access information about the brain would hold more incorrect beliefs.
Participants
569 participants were recruited via online sampling through online research websites as well as popular social media platforms such as Twitter or Facebook. Some worked in education (35%), others didn’t (65%).
Materials
2 Qualtrics Questionnaires were used:
- General Neuromyth Questionnaire: 15 statements to test general knowledge about the brain: 9 correct statements and 6 incorrect statements.
- Neurodevelopmental Neuromyth Questionnaire: Contained 30 statements about Neurodevelopmental Disorders, some were non-specific and could apply to multiple disorders, others were more specific to different disorders such as Autism.
Procedure
- In addition, the participants filled out a demographic information questionnaire at the end to give participant information
- Answers to the questionnaire were recoded using a scale of 1-4 from least correct, to most correct answer. This produced a total score for the overall belief of neuromyths for each participant; lower scores indicated higher acceptance of neuromyths.
Analyses
Results from the Qualtrics Survey were analysed to see if any differences existed between the responses to the general neuromyths and to those related to neurodevelopmental disorders. Further analyses were performed to investigate whether there were any differences in the performances of individuals working in education and those within the general public.
Key Findings
- Analyses found that:
ØThere was no significant difference between those working in education and those not working in education for neuromyths.
ØIn both groups, people endorsed more neuromyths related to neurodevelopmental disorders compared to neuromyths related to general brain development.
ØAlthough familiarity with neurodevelopmental disorders was not a factor, neuromyths associated with ASD were identified with greater accuracy than neuromyths related to other developmental disorders.
- The study showed that the participants were able to recognise neuromyths with greater accuracy compared to participants a decade ago.
- The frequency of access to brain research, and scientific resources, was shown to be a protective factor against neuromyths.
- In general the results suggested that greater understanding and knowledge of developmental disorders through awareness campaigns can help combat the endorsements of neuromyths.
Full Text – Gini, S., Knowland, V., Thomas, M. S. C., & Van Herwegen, J. (2021). Neuromyths About Neurodevelopmental Disorders: Misconceptions by Educators and the General Public. Mind, Brain, and Education. https://doi.org/10.1111/mbe.12303
Can Maths Apps Add Value to Learning?
By Admin, on 26 September 2021
By Dr Laura Outhwaite
Educational maths applications (apps) are an emerging trend in children’s learning environments aiming to raise achievement.
However, determining whether or what kind of maths apps provide a high-quality learning experience is a significant challenge. Current sources of advice rely on anecdotal evidence, while systematic guidelines focus on literacy apps. Teachers, parents, and policymakers need accessible and evidence-based information about what works with educational maths apps, in order to support them to make evidence-informed decisions on which apps to use with their children.
Our research funded by the Nuffield Foundation aims to address this need.
Our current systematic review has identified 50 studies that have evaluated 77 educational maths apps as a formal learning experience in school and at home with children in the first three years of compulsory school, using a broad range of quantitative and qualitative research methods. Emerging themes across the identified studies include: the role of the teacher/parent, children’s engagement with app-based maths instruction, and the importance of considering children’s language skills when using educational apps.
In the next phase of the research project, we are examining the mechanisms underpinning how maths apps might work. To do this, we are conducting a content analysis of mathematical content and design features of the maths apps identified in the systematic review. Initial results examining the links between these features and children’s learning outcomes with the apps suggest that the combination of feedback that both motivates children and explains why an answer is correct or incorrect, together with scaffolded levelling that is personalised and adaptive to the individual child, are necessary app design features for enhancing learning outcomes with educational maths apps.
Overall, this study is highly relevant to current educational policy and practice surrounding the increased use of technology for raising attainment and will provide robust evidence resulting in a better understanding of educational maths apps for young children.
For more information, please contact Dr Laura Outhwaite (l.outhwaite@ucl.ac.uk)
Developmental Dyscalculia
By Admin, on 22 September 2021
By Erica Ranzato
Mathematics is an important life skill. Research findings tell us that individuals with poor numeracy skills have poorer educational prospects, earn less, and are more likely to be unemployed, in trouble with the law and to be sick (Parsons and Bynner, 2005). Moreover, poor mathematical abilities affect not only the individual but bear an impact on the whole society. The accountancy firm KPMG estimated that the cost to the UK of poor mathematical abilities in terms of lost direct and indirect taxes, unemployment benefits, justice costs and additional educational costs was £2.4 billion per year (Gross et al., 2009).
There are many causes that can explain difficulties with mathematics. For example, a low intellectual level, attention difficulties, use of inadequate strategies, or limited numeracy learning experiences. One cause of poor mathematical abilities is developmental dyscalculia – from now on we will refer to it as dyscalculia. Dyscalculia is a learning difficulty with neurobiological origins that can persist into adulthood. At the heart of dyscalculia there is a difficulty with learning maths, despite an IQ within the typical range, that is not caused by difficulties experienced in formal education (such as prolonged absence from school through illness, etc) or other social settings.
Dyscalculia is a heterogeneous disability but, generally, people with dyscalculia experience difficulties with the most basic aspects
of number processing and arithmetic. These learning difficulties manifest in different ways depending on the age of the person, and the setting – i.e., not only in the school environment but in their everyday life, for example, when they have to tell the time. In his book More Trouble with Maths, Steve Chinn lists 31 indicators/behaviours with the aim of providing a checklist that can be used by a teacher, a parent or an adult learner as a screening survey of mathematics learning difficulties and dyscalculia. Some of them are reported below:
- Find it difficult to “see” that 4 objects are 4 without counting
- Difficulties with counting (e.g. lack of one-to-one correspondence)
- Find it much harder to count backwards compared to counting forward
- Has difficulty retrieving addition facts from memory
- Counts all the numbers when adding
- Has poor skills with money
- Finds it difficult to write numbers which have zeros within them
- Difficulties with estimating
- When solving columnar operation does not line up columns of number properly
- Writes 51 for 15
- Struggles with mental arithmetic
- Learns multiplications facts, but then forgets them overnight
- Gets very anxious about doing any mathematics
- Shows inability to “see patterns” or generalize
In 2008, the UK Government Office for Science published a report as a result of the project “Mental Capital and Wellbeing: Making the most of ourselves in the 21st century” where the following recommendation was made:
“Because of its low profile but high impacts, [Dyscalculia’s] impact should be raised. Dyscalculia relates to numeracy and affects between 4-7% of children. It has a much lower profile than dyslexia but can also have substantial impacts: it can reduce lifetime earnings by £114,000 and reduce the probability of achieving five or more GCSEs (A-C) by 7- 20 percentage points.”
Dyscalculia does not have a high public profile such as other learning difficulties – e.g. dyslexia -, but since 2008 Dyscalculia and maths learning difficulties have received more attention (Butterworth, 2018). There are now helpful websites – you can find some listed in the references – and the British Dyslexia Association now recognise it as a separate learning difficulty from dyslexia and has started courses to qualify teachers in teaching learners with specific learning difficulties/dyscalculia. This accreditation enables teachers and practitioners to conduct informal, curriculum-based assessments and deliver specialist teaching programmes to learners up to 18 years of age.
References:
Butterworth, B. (2018). Dyscalculia: from science to education. Imprint Routledge
Bynner J. & Parson, S. (2005). Does numeracy matter? London. Basic Skills Agency
Chinn S. (2017). More trouble with maths: a complete manual to identify and diagnose mathematical difficulties. Second edition. Imprint Routledge.
Gross J., Hudson, C., & Price, D. (2009). The long term costs of numeracy difficulties
Useful websites:
https://www.bdadyslexia.org.uk/
http://www.ronitbird.com/dyscalculia/ https://www.smartickmethod.com/blog/education/psychology/dyscalculia- detected/
How Families with Children with Special Needs are coping with the COVID-19 Pandemic: Lockdown January-April 2021
By Admin, on 15 August 2021
This project is part of a larger study that examines anxiety and concerns of children with special needs and their parents during the pandemic.
We first examined the anxiety and wellbeing of families of individuals with SEND, including the parent’s, the individual with SEND and the anxiety and wellbeing of any typically developing sibling, if they had one in May-July 2020.
In January 2021 a new lockdown was announced in the UK as a result of the ongoing COVID-19 pandemic. In order to examine how families coped with the continued impact of the pandemic and another lockdown, a survey was distributed to parents of individuals with Special Educational Needs (SEND) in the UK.
Between January- April 2021, 153 families of individuals with SEND aged 2-60 years old in UK completed the survey, including also 135 typically developing siblings.
Demographics

Parents reported that their children with SEND as well as typically developing siblings continued to experience high levels of anxiety, despite having more access to schools and support


Most families had access to green space


Parents reported that they found it hard to cope with the continued pandemic

Most families reported to be keen for their child with SEND to receive the vaccine

Suggestions from findings:
- Despite the access to schools and green space, anxiety in children with SEND and their typically developing siblings remained high during lockdown January-April 2021. Seeing that restrictions have now been lifted it would be interesting to see how children with SEND and their siblings recover from this anxiety.
- Parents found it harder to cope with the new lockdown compared to lockdown before, our fine-grained analysis will show why and what support they need.
- The majority of parents is keen for their child to be vaccinated. However, government guidelines for children with SEND have not yet been announced.