 Close
Close

But what does it all mean? A first attempt at coding
By Victoria Hoyle, on 23 July 2018
We have been out and about gathering ‘data’ for the project since March. This mostly consists of transcripts of interviews and focus groups with care leavers, social care practitioners, information practitioners and academic researchers, as well as piles of post-it notes and flip-chart papers from collaborative workshops. So far we have spoken to over 50 people and are sitting on a mountain of 150,000 words, and that’s just the beginning with plenty more sessions planned between now and the end of the year. Ultimately all of this will be analysed and interpreted to form the basis of the guidance, toolkits, conference papers and articles that we will produce during the project. But where do you start and how do you manage the process?
This kind of data doesn’t lend itself to statistical analysis, so instead we’re using a well-established approach to qualitative data called coding. This involves reading through each interview or focus group multiple times highlighting or tagging words, sentences and paragraphs that are significant to our research themes. We use a piece of software called Nvivo to capture this process, which allows us to build up a rich and complex picture. It also means different members of the research team can work on the same data, layering up our diverse perspectives. Later on the software will help us to manipulate the codes or tags, looking at patterns and themes in the data. We can also use it to create visualisations and diagrams.
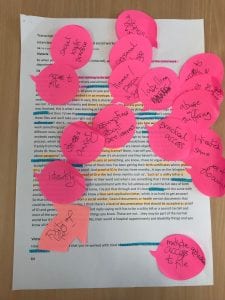
A critical part of this process is establishing a coding framework: the initial set of codes that we will use to shape the analysis. Over time the coding framework will take on a life of its own, growing as we work through the data, but we have to start from somewhere. At the beginning of July the whole research team got together to start building the framework. During the workshop we began this process by working intensively on a sample of data extracts. Wielding highlighters and post-it notes we marked up and commented on things that struck us as interesting and relevant in the context of the research questions.

The benefit of doing this as a team is the different viewpoints it captures at an early stage. Coding is a very individual process – every person responds to a transcript based on their own interests and instincts. Eight people will code a single paragraph in eight different ways, seeing and hearing different things.
In total we looked at extended extracts from three interviews and focus groups, to build up a good basis for designing the coding framework. My job was to take these sheets away and digest them into a structure of codes that can be input into NVivo. I used a good old spider diagram to collate and group the words and phrases that the group generated. In this way I was able to identify four key areas: Access, Content of Records, Regulation and Change. Below is the diagram for Access, by far the most developed of the areas. The highlighted words/phrases are taken directly from the coding exercise; the un-highlighted codes were generated from a recorded discussion we had later in the workshop.
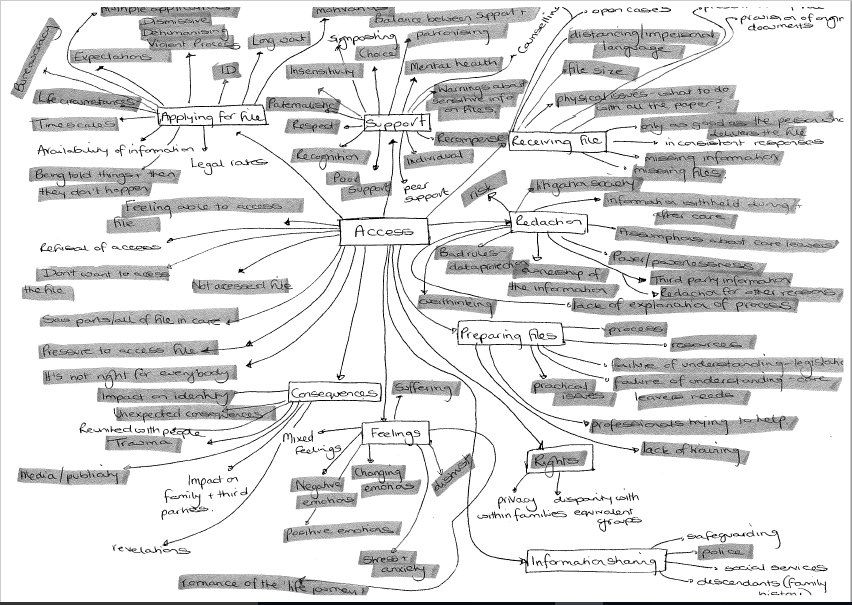
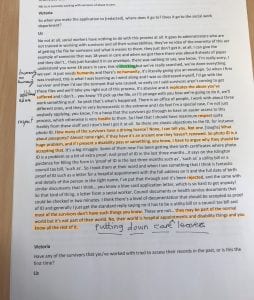
This looks very messy and chaotic at the moment, but once it has been uploaded into NVivo it looks very neat. We can start using it to code transcripts immediately, like this one from a contribution by a social care practitioner. You can see how sections have been highlighted on the left and mapped to codes on the right. Often two, three or more themes overlap as they do here.

Now that we have our initial coding framework we can begin the process of working systematically through our data in this way in earnest, which should keep us nice and busy until the beginning of next year.
