X Close

IOE Blog

Home

Expert opinion from IOE, UCL's Faculty of Education and Society

Menu

TALIS: A complex and realistic picture of teachers and teaching around the world

By Blog Editor, IOE Digital, on 25 June 2014

Chris Husbands 
What do we really know about teaching and teachers in England’s schools? What is teaching in England really like by comparison with other jurisdictions? Too often, discussions about teacher effectiveness, teacher appraisal, professional development and job satisfaction appear to be based on a sample of about one: massive over-generalisation from the specific instance.
So the publication of the OECD TALIS (Teaching and Learning International Survey) 2013 data for England is important. This is not the first TALIS – that was in 2008 – but the first to include England. TALIS covers lower secondary teachers in 34 countries, and the OECD reports its findings over 440 pages of dense text and charts. The English report, itself 200 pages long, was written by an IOE team led by John Micklewright and provides the most extensive data we have on teachers and teaching. The sample is still not enormous – 154 schools and 2,496 lower secondary teachers – but the response rate was very high (75% compared to just 17% in the DFE Teachers’ Workload Diary) and, importantly, this is the first survey to cover both state and independent schools.
Micklewright and his team deliberately do not come to an overall conclusion on what TALIS tells us about the state of secondary teaching in England. They try to tease out what the data say about different issues, framed as a set of questions – but it is for the reader to draw conclusions.
The result is fascinating: a treasure trove of data and graphs, which allow us to make informed comparisons across the OECD. Politicians and the press always ransack reports like this for the simple answer which tells us that “if only” we were more like [fill in name of organization or country] then everything would be different. But the TALIS report is more complex and realistic. There are differences between countries, but they evade easy generalization.
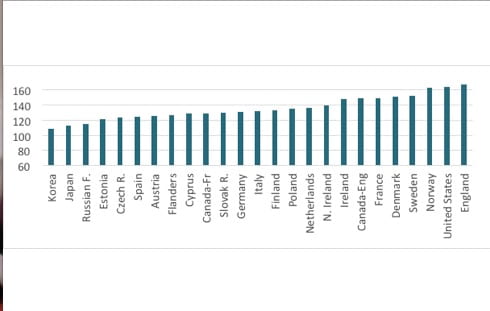
Take teacher workload: TALIS confirms that teachers in England work hard: a working week of 46 hours, one of the highest in TALIS and 9 hours more than the average. In only three of the sub-sample of high performing jurisdictions is the figure higher: Alberta (48 hours), Singapore (48 hours) and Japan (54 hours). But teaching time in England, at 20 hours, is close to the international average. This gap between working hours and teaching is a puzzle because English schools have significantly more teaching assistants and administrative staff than across the OECD. But it may be a result of high levels of autonomy enjoyed by English schools; examination of the TALIS data bears this out, suggesting that the difference is because English teachers spend slightly more time on each aspect of their work: planning, marking, and administration.
Or take classroom management. Across all OECD countries, a quarter of teachers report losing a third or more of time to classroom disruption. But in most respects England is at or better than the TALIS average. 21% of teachers in England say they have to wait for students to quieten down at the start of lessons, but this is below the median for all countries (27%) and below all high performing jurisdictions except Japan. Teachers in independent schools report better behavior than teachers in maintained schools or academies, but of course independent schools teach a more socially selective population.
Micklewright’s team look carefully at variations between schools, and conclude that classroom climate is correlated with the make-up of the school intake, and, more, of individual classes. And, there is evidence that disciplinary environment improves in smaller classes – of course, smaller classes are preponderantly found in independent schools. Even so, two thirds of teachers report a positive classroom climate. It’s in these classes that teachers are likely to use a variety of approaches including group work, extended investigation and information technologies. Teachers are more likely to teach like this if they participate in professional development involving individual and collaborative research, visits to other schools or teacher networks. Or consider findings on continuing professional development. Overall, there is exceptionally high engagement with CPD in England: 92% report some CPD in the last twelve months, but the number of hours spent on training is relatively low: high participation, low volume. And for all the rhetoric that continuing professional development is not simply about ‘going on a course’, courses and workshops account for the vast majority of CPD; just 45% of English teachers reported CPD involving ‘working with a group of colleagues’.
There are some insights into CPD quality, which tell us that CPD on the most challenging aspects of teaching is the least effective. Across TALIS, just 13% reported that training on teaching in multi-cultural or multi-lingual settings had an impact on their teaching; the figure was 8% in England. Figures on SEN training are similar.
But there are reasons to be positive about what CPD can do: across the OECD as a whole 66% of teachers thought that subject-focused CPD had an impact, and 50% thought that  CPD focused on pedagogy had an impact. The figures varied between countries. Both were lower in England, and higher in the nine highest performing jurisdictions – but before that becomes a policy line, we note that 73% of teachers in the eight lowest performing jurisdictions also reported a positive impact from CPD in their subject! Teachers in schools with higher levels of deprivation were more positive about the impact of CPD. Taken as whole, the OECD claim a correlation between regular collaborative professional learning activities and teachers feeling more confident about their capabilities.
TALIS suggests that England has a near universal system of teacher appraisal. Compared to the OECD as a whole, Micklewright’s team characterizes England as a “high feedback country”: 99% of teachers report receiving feedback. But schools are not making the most of it. Only about half of teachers (and this is a consistent figure across the OECD) felt that feedback enhanced efficacy.
It’s on self-efficacy – teachers’ beliefs about their ability to influence learning – that the English report concludes. There are variations between teachers’ sense of their effectiveness. But variation within schools is much greater than that between schools. Teams and departments matter. There is no difference between independent and state-funded schools, nor between affluent and deprived schools. Instead, the IOE team conclude that self-efficacy is highest when teachers report strong professional relationships, but they conclude that causality is unclear: it may be that teachers with high self-efficacy build good relationships, or, by working in teams with good relationships teachers become more confident.
It’s this puzzle, like so many others, which the report for England is so good at illuminating. It offers immense detail, but never at the expense of the underlying key questions. It challenges practice and policy on the basis of rigorous analysis, which is what really good research should do. It is balanced between strengths and weaknesses and clear-headed about international comparisons. It will be reduced, and perhaps traduced, in press headlines, but deserves serious research and policy attention on how we can best shape the teaching profession.

How class continues to drive the equality gap in England's adult skills

By Blog Editor, IOE Digital, on 10 February 2014

Andy Green
The latest OECD Survey of Adult Skills (SAS) generated much commentary on the relatively poor level of adult skills in England – particularly the revelation that on both literacy and numeracy tests young people scored no better than older generations and worse than their peers in all other countries except Italy and Spain. There was less discussion about how skills are spread around the population, but this is just as important. On this dimension the news is no better, because the distribution of adult skills in England is very unequal.
There is a larger gap in literacy and numeracy scores between the highest and lowest achievers than in most other countries and the impact of parental background on skills attainment is stronger than in most countries. Despite some evidence of a narrowing in the dispersion of skills in England over the last 16 years, the skills of the youngest cohorts are still more unequally distributed than in almost all other countries.
Difference in Average Numeracy Scores of Top and Bottom 20 Percent of 25-29 Year Olds
chart1jpg
There are large gaps in the skills of the 16-65 year olds, particularly in numeracy. Scores in SAS are measured out of 500 but the actual range of scores is much lower. In England the average score in numeracy of those in the lowest-scoring 20 percent is 153 points below the average score of  those in the highest scoring 20 percent. The gap in literacy scores is somewhat smaller at 134.3 points. Only two countries, France and the USA, are more unequal in numeracy and in literacy only Finland and Canada are more unequal. However, the situation for the younger age groups is even more alarming. For the 25-29 year olds there are no countries with more unequal skills distributions in either numeracy or literacy. England is also the only country where skills are as unequal amongst the younger age groups as the older ones.
England also does relatively badly on equality of opportunity – in terms of the degree to which social background influences skills attainment. The only country where the parents’ level of education has a greater effect on children’s skills attainment in literacy and numeracy is the Slovak Republic. Young people with graduate parents are likely to score 67 points higher in numeracy and 58 points higher in literacy than those whose parents only have GCSE level qualifications. English-speaking, ‘liberal’ countries generally show less equality of opportunity than other countries, and England and the USA the least.
Inequality of Opportunity in  Numeracy Skills for Younger and Older Age Groups
 chart2
Inequality of Opportunity for Numeracy and Literacy for 16-24 Year Olds by Country Group
chart3
Why are adult skills in England so much more unequal than in most other countries? Some possible explanations can be ruled out. Differences between age groups play no part in England since the skills levels of younger age groups are much the same as for older age groups. Inward migration seems to contribute a small amount to adult skills inequality in England but no more than in most countries and rather less than in some. Adult learning does not appear to play a greater role in exacerbating the skills inequalities amongst adults in England than in other countries.
However, there is one likely explanation and that has to do with initial education. Skills and educational qualifications are very closely related. In England, each of the different age groups has a very high level of inequality in education qualifications compared with other countries. Since most qualifications are achieved before the age of 25 this implies that the initial education system has been producing very unequal outcomes going back to the 1950s. Our research (pdf) concludes that the primary cause of adult skills inequality in England is the exceptionally unequal skills outcomes of the initial education system sustained over a long period, fuelled and supplemented by an especially strong influence from social background.
The research was funded by the Economic and Social Research Council. Grant Number: ES/J019135/1
This blog post first appeared on The Conversation 
 

Let's replace our Fortnum's v Walmart system with a John Lewis model of schooling

By Blog Editor, IOE Digital, on 25 February 2013

Sandra Leaton Gray

Last week, the Organisation for Economic Co-operation and Development (OECD) published an analysis of fair opportunities for pupils (PDF). Andreas Schleicher, its Special Adviser for Education, has said that social division represents a long term issue for the UK education system, and that there is distinct polarisation between the attainment levels of rich and poor pupils.
Using the example of London – where one-fifth of the country’s children attend school – Geoff Whitty and I found that children getting free school meals (a marker for deprivation) were very much more likely to attend poorly-achieving schools than successful ones.
The graph below demonstrates this. On the x-axis, we have plotted something the Government calls Families of Schools, based on official data and grouped according to shared characteristics such as attainment, number of children having free school meals and so on. On the y-axis, we have plotted the different types of school, as a proportion of the whole family: community, voluntary aided or controlled (usually faith schools) and foundation (funded directly by the State).
From the graph we can see that there are comparatively few community schools in the top performing Family, and a higher number of voluntary aided or voluntary controlled schools, in the case of this group, selective schools.
In contrast, all the schools in the bottom performing Family, where most of the children receiving FSM are concentrated, are community schools, and none are selective. (Data source: DfES, 2005).
sandrachart1
As these data are from 2005, we have revisited our earlier research. In the 2011 Families of Schools data, 2% of children in Family Number 1 (highest achieving, mainly selective schools) received free school meals (FSM), compared to 45% of children in Family Number 23 (lowest achieving, mainly community schools)..
So it is clear that the children suffering the most social and economic deprivation still have the least opportunity to attend academically successful schools. This is because the UK currently offers parents variable educational provision, usually depending on factors over which they have little or no control – for instance, whether the school is selective, its geographical location, or the family’s religion.
This variable provision has been described as a “spectrum of diversity” by academies sponsor Sir Bruce Liddington, but to some families it can simply seem confused and fragmented. In response to a situation where some children are “in” and the others “out” – a kind of Fortnum and Mason versus Walmart model of education, if you like – I propose a John Lewis model of schooling. In this model, all the main stakeholders play a part in its success, and it is designed to be mutually beneficial to all. Wherever you go in the country, you know what you are getting, and it’s reliable.
If it goes wrong, as is occasionally inevitable, other parts of the system step in to make sure your child is well looked after and that his or her education is attended to properly. In my John Lewis educational world, teachers would fraternize regularly and exchange best practice, pupils would learn to work in a schooling system where knowledge is pursued as a means to understanding rather than examination passes, and there would be a national consensus on what the education system is trying to achieve.
It’s time to ditch the language of division, where some people are “in” and some people are “out”, and reform our fragmented, artificially competitive education system. Instead we need to move towards the collaborative, high reliability schooling this country deserves.