X Close

IOE Blog

Home

Expert opinion from IOE, UCL's Faculty of Education and Society

Menu

Is PISA still a fair basis for comparison? Some serious questions have emerged

By Blog Editor, IOE Digital, on 26 January 2018

John Jerrim
A version of this blogpost also appears on the Centre for Education Economics website.
The OECD’s PISA study compares the science, reading and mathematics skills of 15-year-olds across countries, with the results closely watched by journalists, public policymakers and the general public from across the world.
It’s conducted every three years, and particular attention is now being paid to how the PISA scores of each country are changing over time. For instance, are the academic skills of young people in some countries improving, while in others they are in relative decline?
Of course, to answer such questions robustly, fair and comparable measures (more…)

Homework lessons from PISA: looking past the headlines

By Blog Editor, IOE Digital, on 7 September 2017

John Jerrim
When the PISA results are released, almost everyone is fixated upon the average scores children have achieved in reading, science and mathematics, and our latest position in the “international rankings”. However, a lot of other information is captured within this study, some of which is actually a lot more interesting than the headline results themselves. My report for the Sutton Trust today looks at one such issue – how much time do 15-year-olds spend in additional learning activities outside of their core timetabled hours? This captures not only the use of private tutors, but also access to afterschool clubs. Here, I briefly overview four of the key messages (more…)

Only grade 5 and above should be considered a pass when GCSE maths and English results are released tomorrow

By Blog Editor, IOE Digital, on 23 August 2017

 John Jerrim.
Tomorrow is the release of GCSE results, with this year having the added excitement of changes to how grades are being reported for certain subjects. Rather than the long-standing use of alphabetic grades (ranging from A* to U), English language and maths will be scored on a numeric (9 to 1) scale. Consequently, no-one really quite knows what to expect!
Confusion has not been helped by the Department for Education defining both grade 4 and grade 5 as the “pass” mark, and then using these for different purposes. For instance, whereas schools will require their pupils to achieve grade 5 to be included in their EBACC accountability figures, children themselves will be awarded the EBACC if they reach at least grade 4. Likewise, the leading Russell Group universities are now using different criteria; whereas UCL will require applicants to certain courses to have achieved at least grade 5 in English and maths, other (such as Manchester) are only asking for grade 4 . 
Confused? You should be! It doesn’t really make much sense, does it? But it does (more…)

Why does Vietnam do so well in PISA? An example of why naïve interpretation of international rankings is such a bad idea

By Blog Editor, IOE Digital, on 19 July 2017

John Jerrim
When the PISA 2015 results were released in December last year, Vietnam was one of the countries that stood out as doing remarkably well. In particular, Vietnam was ranked 8th out of all the participating countries in science, with an average score of 525 test points. This was significantly higher than the average score for the United Kingdom (509), which was positioned 15th in the PISA science rankings.
This is not the first time that Vietnam has apparently excelled in PISA, with a strong performance from this country in the last round, conducted in 2012. Indeed, OECD Director for Education and Skills Andreas Schleicher wrote a whole article for the BBC, discussing a variety of reasons for this developing country’s stunning success.
But does Vietnam’s amazing performance in PISA, given that it is still a low-income (more…)

The ten key findings from PISA 2015

By Blog Editor, IOE Digital, on 6 December 2016

John Jerrim.
Today, the Organisation for Economic Co-Operation and Development (OECD) release results from the 2015 round of the Programme for International Student Assessment (PISA). Although the ‘country rankings’ take the headlines, there are many other (and often more interesting) findings once you scratch below the surface. In this blog2post, I provide a crash-course in ten other key findings for the UK from the latest wave of PISA data. For further details on any of these results, see the PISA 2015 national reports for England, Wales and Northern Ireland that I have co-authored.
1. Although average scores have remained stable in the UK, this masks some notable differences between the four countries over the last decade…
There has been no significant change in England’s average PISA score, in any subject, since 2006 (the first time point to which we can compare). However, average science scores have fallen by around 20 test points (two terms of schooling) in Wales, with a similar decline in mathematics scores between 2006 and 2015 in Scotland.
2. …but we shouldn’t (yet) read too much into the fall in science scores between 2012 and 2015
Undoubtedly, education in Scotland is likely to come under the microscope today, in part because of the pronounced decline in its 15-year-olds’ PISA science scores over a short (more…)

Social mobility, education and income inequality: an overview in five graphs

By Blog Editor, IOE Digital, on 17 March 2016

 
Lee Elliot Major and John Jerrim.
The study of education inequality and social mobility increasingly feels like a small world. The British Prime Minister David Cameron hopes for improved educational opportunities for disadvantaged children. President Barack Obama has put the issue of inequality and social mobility at the heart of at least one State of the Union address. In fact most national leaders espouse similar aspirations. And at international gatherings the education challenges facing countries are strikingly similar: improving education in the early years; recruiting and developing good teachers; ensuring equitable access to leading universities.
But international comparisons matter precisely because of the differences they reveal between countries. We can indicate how well one education system or society is performing by comparing it against somewhere else (the assumption being that humans are basically the same across the world). At the same time good comparative data is devilishly hard to come by and offers mainly (more…)

How shift to computer-based tests could shake up PISA education rankings

By Blog Editor, IOE Digital, on 19 February 2016

John Jerrim.

The world’s most important examination is moving online. Since the Organisation for Economic Cooperation and Development launched the Programme for International Student Assessment (PISA) in 2000, it has provided an influential and timely update every three years of how 15-year-old school children’s mathematics, science and reading skills compare across the globe.
Poor performance has “shocked” a number of national governments into action, and they have embarked on a range of extensive reforms to their school systems.
Whereas each of the five cycles of tests completed between 2000 and 2012 were completed on paper, 58 of the 72 economies who participated in PISA 2015 between November and December last year administered the PISA test using computers – including the UK.
My new research starts to show that this shift is likely to influence the results of PISA (more…)

Minister, it will cost young people a lot of money to attend a high status university

By Blog Editor, IOE Digital, on 19 November 2013

John Jerrim
Last week, I had the pleasure of speaking at the Sutton Trust summit about access to “high status” universities. It was great to be able to engage with a number of leading experts in higher education and widening participation over the two days. For the summit, I produced a report (pdf) outlining various issues surrounding widening access in England and the United States. These range from the link between family background and access to high status institutions, to the thorny matter of tuition fees, living costs, bursaries and debt.
Although the report seems to have been generally well received, it has also touched on some sensitive nerves. In particular, David Willetts, the minister for universities and science, stressed that no graduate has to pay back their loan until they earn more than £21,000 – and then only nine pence in the pound over this amount.
This is indeed an incredibly important point, as my colleague from the London School of Economics Gill Wyness pointed out during our session at the summit. Such “income contingent loans” help insure young people against the risk associated with investing in a degree, and mean they do not have to turn to wonga.com if they do not immediately find a well paid job.
However, one cannot escape the fact that at some point this debt has to be repaid. This is particularly relevant for young people attending elite institutions such as Oxford, Cambridge and the London School of Economics. Graduates from such leading universities tend to earn the highest wages. It therefore seems reasonable to ask, how much will attending one of these elite institutions costs?
Unfortunately, this is not an easy question to answer, as it depends upon the specific career path chosen after university. But let’s take secondary school teaching as an interesting example. How much might an Oxbridge graduate who enters this noble profession pay for their degree?
Below is a spreadsheet with some back-of-an-envelope calculations based upon the following (generally conservative) simplifying assumptions:

  • Zero real interest is paid on the loan and there is zero inflation
  • There is no real pay increase in the teaching pay scales and no change to the £21,000 repayment threshold
  •  The debt is written off after 30 years (as per the current HE finance system)
  • All costs associated with post-graduate study (including a PGCE) are ignored
  • The teacher chooses to work in an inner-London school throughout their career
  • They complete a 3-year undergraduate course
  • They work full-time continuously between the ages of 21 and 50
  • They take out a a £9000 tuition fee loan and a £5000 loan to cover living costs
  • Their parents’ household income is roughly £40,000 per year
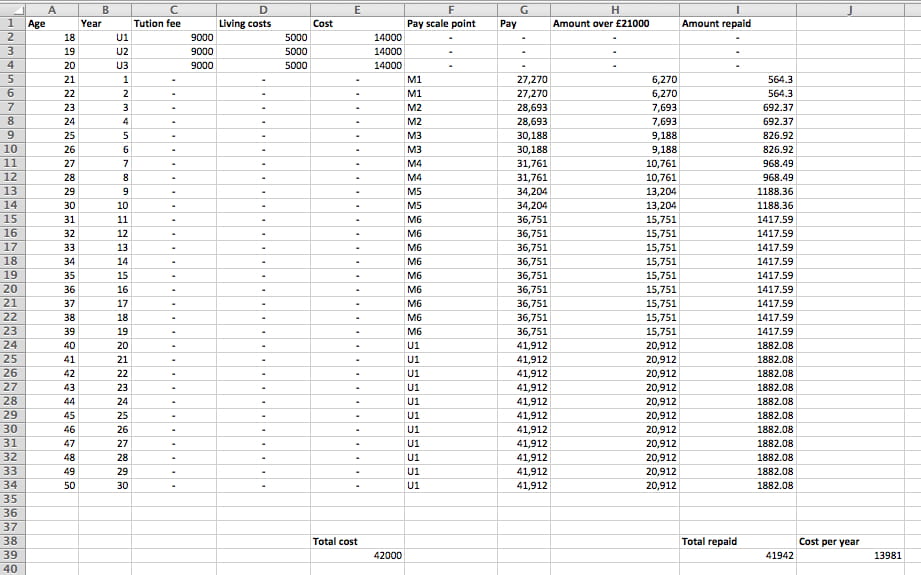
  • The teacher is promoted bi-annually (from M1 to M6 on the teacher pay scale) during their first ten years of service. They then remain on pay point M6 for the next 10 years (to age 40) and then move on to pay point U1 to age 50[1].

jerrimspreadsheet

Click on graphic to see a clearer version

 To highlight a few key figures:

  • This student (and prospective teacher) would accumulate a debt pile of around £42,000 by the end of their course.
  • They would repay their debt at age 50, just before the 30 year cut-off point where the outstanding balance is written off
  • The cost of their university education would therefore equal approximately £14,000 per year (including all tuition, books and living expenses).

This is of course just one single example. Many Oxbridge graduates will go on to enjoy much higher wages, incur substantial real interest on their debt, and will pay back substantially more. Others may decide to live outside of London, follow a different career path or work part-time, with university costing them substantially less.
However, one thing should be abundantly clear. Income contingency may mean that repayment of debt is manageable and reduces the financial risk of investing in a university degree. But for the majority of young people, the cost of attending one of England’s most prestigious universities is going to be quite high. Indeed, even more stark figures come from this cost calculator, which shows that even medium earnings graduates may make total repayments of more than £60,000.
Prospective students, as well as the Secretary of State, should remember this when thinking about higher education and the student finance system currently in place in England. They should be clear that going to a high status university is likely to cost quite a lot of money upon graduation. Furthermore, the Government must start to present figures for the total cost of higher education separately from the funding mechanisms (income contingent loans) that are designed to reduce risk and ease the upfront costs of attending such an institution.
You can find out more about John’s work at johnjerrim.com

People having a pop at PISA should give it a break…

By Blog Editor, IOE Digital, on 30 July 2013

John Jerrim

For those who don’t know, the Programme for International Student Assessment (PISA) is a major cross-national study of 15 year olds’ academic abilities. It covers three domains (reading, maths and science), and since 2000 has been conducted tri-annually by the OECD. This study is widely respected, and highly cited, by some of the world’s leading figures – including our own Secretary of State for Education Michael Gove.
Unfortunately not everyone agrees that PISA is such an authoritative assessment. Over the last month it has come in for serious criticism from academics, including Svend Kreiner (PDF) and Hugh Morrison (PDF). These interesting and important studies have been followed by a number of media articles criticising PISA  – including a detailed analysis in the Times Educational Supplement last week.
As someone who has written about (PDF) some of the difficulties with PISA  I have read these studies (and subsequent media coverage) with interest. A number of valid points have been raised, and point to various ways in which PISA may be improved (the need for PISA to become a panel dataset – following children throughout school – raised by Harvey Goldstein is a particularly important point). Yet I have also been frustrated to see PISA being described as “useless”.
This is a gross exaggeration. No data or test is perfect, particularly when it is tackling a notoriously difficult task such as cross-country comparisons, and that includes PISA. But to suggest it cannot tell us anything important or useful is very far wide of the mark. For instance, if one were to believe that PISA did not tell us anything about children’s academic ability, then it should not correlate very highly with our own national test measures. But this is not the case. Figure 1 illustrates the strong (r = 0.83) correlation between children’s PISA maths test scores and performance in England’s old Key Stage 3 national exams. This illustrates that PISA scores are in-fact strongly associated with England’s own measures of pupils’ academic achievement.
Figure 1. The correlation between PISA maths and Key Stage 3 maths test scores
pisa1
Source: https://www.education.gov.uk/publications/eOrderingDownload/RR771.pdf page 100
To take another example, does the recent criticism of PISA mean we actually don’t know how the educational achievement of school children in England compares to other countries? Almost certainly not. To demonstrate this, it is very useful to draw upon another major international study of secondary school pupils’ academic achievement, TIMSS. This has different strengths and weaknesses relative to PISA, though at least partially overcomes some of the recent criticisms, with the key point being – does it tell us the same broad story about England’s relative position?
The answer to this question is yes – and this is shown in Figure 2.  PISA 2009 maths test scores are plotted along the horizontal axis and TIMSS 2011 maths test scores along the vertical axis. I have fitted a regression line to illustrate the extent to which the two surveys agree over the cross-national ranking of countries. Again, the correlation is very strong (r = 0.88). England is hidden somewhat under a cloud of points, but is highlighted using a red circle. Whichever study we use to look at England’s position relative to other countries, the central message is clear. We are clearly way behind a number of high performing East Asian nations (the likes of Japan, Korea and Hong Kong) but are quite some way ahead of a number of low and middle income countries (for example Turkey, Chile, Romania). Our exact position in the rankings may fluctuate a little (due to sampling variation, differences in precise skills tested and sample design) but the overall message is that we are doing okay, but there are other countries that are doing a lot better.
Figure 2. The correlation between PISA 2009 and TIMSS 2011 Maths test scores
pisa2
Source: Appendix 3 of http://johnjerrim.files.wordpress.com/2013/07/main_body_jpe_resubmit_final.pdf
I think what needs to be realised is that drawing international comparisons is intrinsically difficult. PISA is not perfect, as I have pointed out in the past, but it does still contain useful and insightful information. Indeed, there are a number of other areas – ‘social’ (income) mobility being one – where cross-national comparisons are on a much less solid foundation. Perhaps we in the education community should be a little more grateful for the high quality data that we have rather than focusing on the negatives all the time, while of course looking for further ways it can be improved.
For details on my work using PISA, see http://johnjerrim.com/papers/

Confusion in the (social mobility) ranks? Interpreting international comparisons

By Blog Editor, IOE Digital, on 4 February 2013

John Jerrim 

Last Friday the Sutton Trust published a very interesting report questioning the validity of global educational rankings. Having written extensively on this subject myself I can only welcome this report as making an important contribution to policymakers’ understanding of international comparisons of educational attainment. Yet the report also brought to mind the robustness of cross-national comparisons of another area of great policy interest – social mobility.
Readers have probably heard that social mobility is low in the UK by international standards. A number of sensationalist stories have led with headlines such as “Britain has worst social mobility in western world and that “UK has worse social mobility record than other developed countries.
Leading policymakers have made similar statements. To quote England’s Secretary of State for Education Michael Gove: “Those who are born poor are more likely to stay poor and those who inherit privilege are more likely to pass on privilege in England than in any comparable country”.
But is this really the case? Are we sure social mobility is indeed lower in this country than our international competitors? Or is it the case that, just like global league tables of educational achievement, there remains great uncertainty (and misunderstanding) surrounding cross-national comparisons of social mobility?
The answer can actually be found by exploring a little further academic research that has been published on the Sutton Trust website. Figure 1 is taken from a Social Mobility Report published on 21 September 2012.
Figure 1: International comparisons of social mobility – Sutton Trust report 21st September 2012
sutton1

Saving the technical details for another time, the longer the bars in this graph, the less socially mobile a country is. Here we see a familiar story; Britain ties with Italy as being the least socially mobile.
Figure 2, however, tells a different story. This is taken from another report published by the Sutton Trust just three days later.
Figure 2: International comparisons of social mobility – Sutton Trust report 24th September 2012
sutton5
This graph plots a measure of income inequality (horizontal axis) against an economic measure of social mobility (vertical axis). Thus the closer a country is to the top of the graph, the lower its level of social mobility. Now, it appears that the UK may actually be more socially mobile than France, Italy and the US, and very similar to countries like Australia, Canada and Germany. Perhaps even more surprisingly, the UK is also similar to Sweden, Finland and Norway. Indeed, the only country that we can have any real confidence that the UK is significantly different to is Denmark.
Why is there such a contrast between these two sets of results? The trouble is, cross-national studies of social mobility have to rely upon data that are not really cross-nationally comparable. Rather, data of varying quality have been used in each of the different countries. Individuals are interviewed at different ages, using different questionnaires and survey procedures. Indeed, even different statistical analysis methods are used. No wonder, then, that social mobility in the UK can look very different, depending upon which dataset and method of analysis are used.
So although global rankings of educational attainment can be misleading, so can those of social mobility. In fact, problems with international comparisons of social mobility are often significantly worse. Yet this does not seem to stop journalists and policymakers making bold claims that “Britain has some of the lowest social mobility in the developed world“. Things are rarely so black or white in the social sciences – and social mobility is no exception. This uncertainty should be recognised when journalists and government officials report on social mobility rankings in the future. Otherwise, I fear for the credibility of this extremely important social issue.