Do Ofsted inspection outcomes differ between male and female inspectors?
By Blog Editor, IOE Digital, on 7 February 2023

Credit: Phil Meech for IOE.
John Jerrim, Sam Sims and Christian Bokhove.
This post is the first in a five part series on Ofsted inspections. Jump to: next.
We have published a new academic paper investigating how Ofsted inspection outcomes vary across inspectors with different characteristics. This has been supported by the Nuffield Foundation and uses data we have pulled together on approximately 30,000 school inspections conducted between September 2011 and August 2019.
You can read a full version of our academic working paper along with our responses to some FAQs about the research.
This first blog in our series focuses on differences between male and female inspectors.
Primary schools
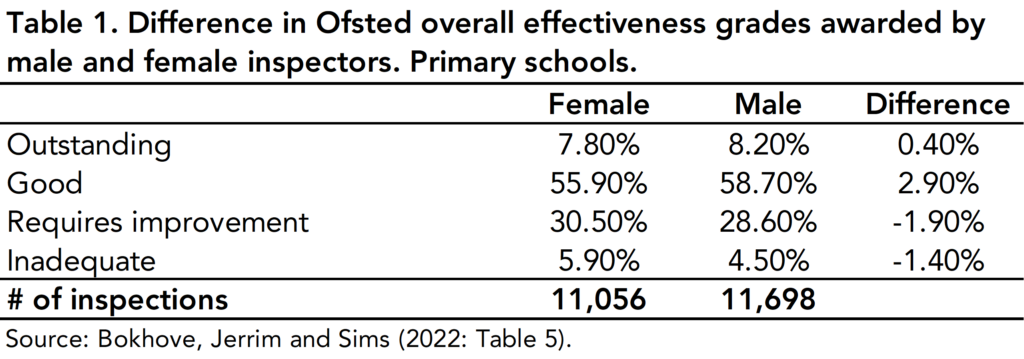
Table 1 below illustrates the distribution of Overall Effectiveness grades awarded to primary schools from inspections led by male and female inspectors. This suggests that the former tend to be more lenient in their judgements than the latter. In particular, 36.4% of primary inspections led by a woman led to a “requires improvement” or “inadequate” rating, compared to 33.1% of primary inspections led by a man. This difference of three percentage points is modest, though the large sample size means it is statistically significant (for what that’s worth).
The gender difference in awarding an inadequate grade is of particular note; primary schools are 1.3 times[1] more likely to receive this judgement when the inspection is led by a woman.

Table 1. Difference in Ofsted overall effectiveness grades awarded by male and female inspectors. Primary schools. Source: Bokhove, Jerrim and Sims (2022: Table 5).
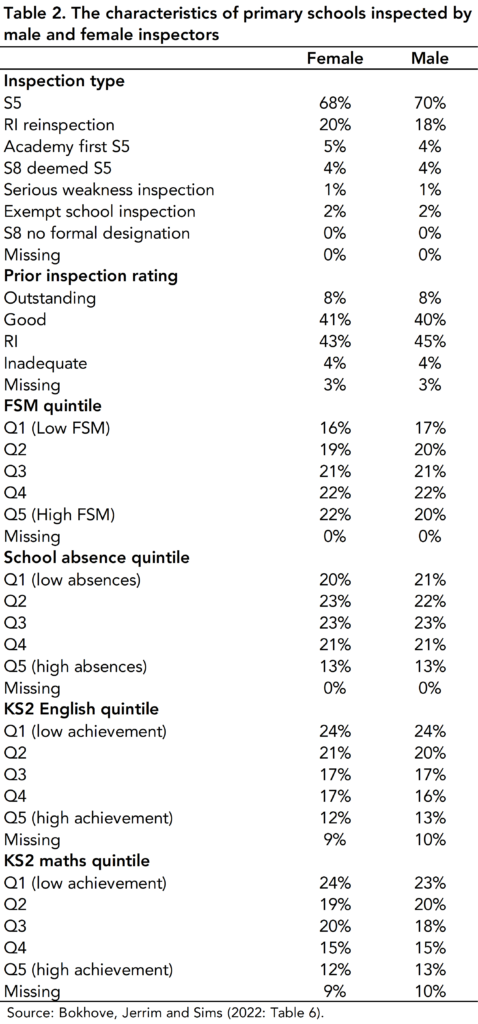
Might this gender difference be driven by male and female inspectors being assigned to lead different inspections? We think this is unlikely.
First, Table 2 below illustrates how the distribution of school background characteristics looks very similar for male and female inspectors.
Second, in our paper, we illustrate how the same pattern emerges amongst different sub-groups of inspectors (e.g. across several regions and different employment relationships with Ofsted).

Table 2. The characteristics of primary schools inspected by male and female inspectors. Source: Bokhove, Jerrim and Sims (2022: Table 5).
Third, we find a similar pattern for different inspection types. For instance, we also find female inspectors to make harsher judgements than men when conducting short inspections – though the difference is again relatively small.
Finally, we find almost no change to our results once we control for a wide set of background school, inspection and other inspector characteristics (if anything, the difference becomes a little bigger). For instance, although female leads are more likely be to Her Majesty’s Inspectors than male leads (33% versus 29%) a gender difference remains even after this factor has been controlled.
We hence believe that – although differences in primary school inspection outcomes between male and female inspectors are quite small – the finding seems quite robust.
Secondary schools
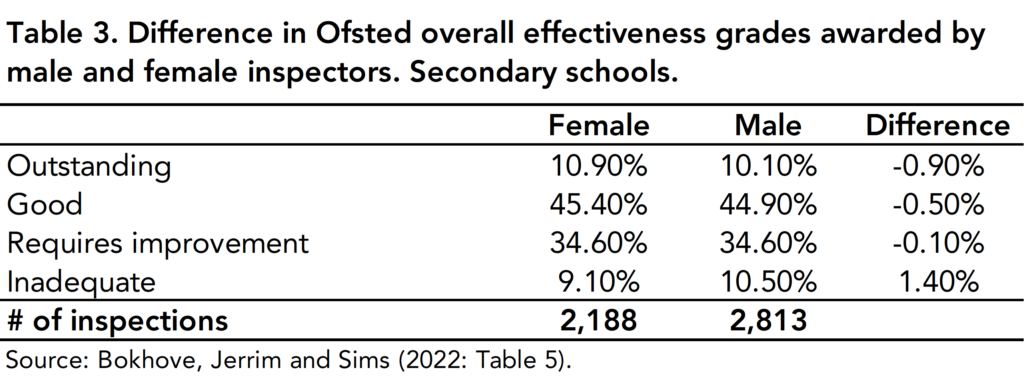
For secondary schools evidence of a gender difference in inspection outcomes is less clear cut. Table 3 provides the distribution of Overall Effectiveness judgements where, if anything, the opposite holds true (e.g. male leads are slightly more like to rate a school as inadequate than their female counterparts).
However, the much smaller sample size (around 5,000 secondary inspections, compared to more than 20,000 primary inspections) means we have much less confidence in this difference being a genuine result. The same pattern is also not observed for short inspections.
We thus feel that evidence of inspector gender differences for secondary school inspection outcomes is inconclusive.

Conclusions
What should we take from these findings?
Well, for primary schools, there might be some concern about a potential link between inspector gender and awarding of an Inadequate grade. Although differences are modest, the consequences of receiving Ofsted’s lowest rating can be severe.
At the same time, Ofsted’s inspection framework recognises that – in reaching their judgement – inspectors will “draw on all the evidence they have gathered and use their professional judgement” . Our results may hence reflect men and women having different professional views about what is important in primary schools.
Notes
[1]: This refers to the risk ratio, calculated as 5.9% / 4.5%
This post was previously published on the FFT Education Datalab blog. Dr Christian Bokhove is Professor in Mathematics Education at the University of Southampton.
 Close
Close


