 Close
Close

Did independent schools really ‘fiddle’ their A-Level grades more than other schools in 2021?
By Blog Editor, IOE Digital, on 23 August 2022
It’s August. And that can mean only one thing – results season is back!
Of course, when A-Level results were released last Thursday, one specific thing grabbed the headline – the sharp fall in 2022 grades compared to 2020 and 2021.
This was entirely predictable. And, actually, wasn’t that newsworthy. Ofqual told us that that 2022 grades would sit midway between those awarded in 2019 and 2021 almost a year ago.
But what also caught a lot of people’s attention was how the fall in grades differed between different groups and, in particular, different centre types.
For instance, Chris Giles from the FT tweeted the following graph along with the words “guess which type of school fiddled A-level grades when they graded themselves?”
Figure 1. Chris Giles tweet illustrating changes in A* grades between 2021 and 2022 by centre type. 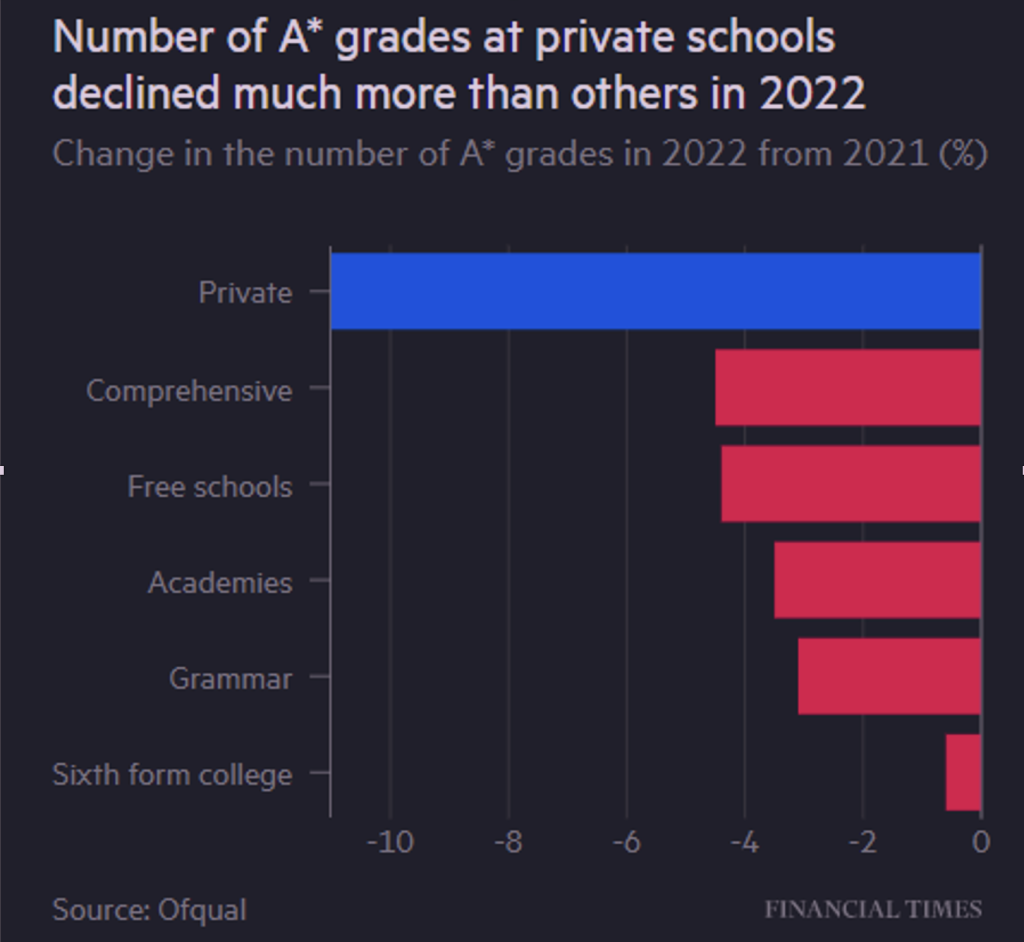 But did A-Level grades really fall by more at independent schools between 2021 and 2022 than in other centres? Well, it all depends upon how you measure it…
Absolute change
The figures that Chris Giles reported – and which many commentators picked up on – referred to the absolute difference in percentages achieving certain grades in 2022 compared to 2021.
So in Table 1 below – which reports the percent of entrants receiving A/A* grades – one simply takes the difference between the percentage for 2021 and 2022.
Table 1. The percentage of A-Level A/A* grades awarded between 2021 and 2022 by centre type.
| Sector | 2021 | 2022 |
| Academies | 42% | 35% |
| Free schools | 49% | 45% |
| FE establishment | 29% | 17% |
| Independent | 70% | 58% |
| Other | 52% | 30% |
| Secondary comprehensive | 39% | 31% |
| Secondary modern | 36% | 28% |
| Secondary selective | 57% | 50% |
| Sixth-form college | 35% | 32% |
| Tertiary college | 34% | 28% |
Figure 2 presents a visual representation of this absolute probability difference. It looks like independent schools (orange bar) are amongst those suffering the greatest declines. Yet there have been sizeable absolute falls elsewhere (e.g. at further education colleges – green bar) as well.
Figure 2. Absolute difference in the percentage of A-Level A/A* grades awarded between 2021 and 2022 by centre type.

Relative change
However, one can look at the same data a different way. Rather than focusing on the probability difference, one can look at the “relative risk”. Rather than taking the difference between the probabilities for 2021 and 2022 reported in Table 1, we look at the ratio instead.
Figure 3 illustrates the “relative risk” of getting an A/A* grade in 2021 compared to 2022 by centre type. This gives an idea of how many times more likely students were to receive an A/A* grade in 2022 than 2021.
In terms or relative risk, independent schools are somewhat middle of the road. Their students were around 20% more likely to receive an A/A* grade in 2021 than in 2022, but the same is pretty much true for academies, comprehensive schools and secondary moderns.
In fact, it is further education and “other” establishments where the relative change has been greatest; students in such centres were almost 80% more likely to receive an A/A* grade last year than this.
Figure 3. Relative difference in the percentage of A-Level A/A* grades awarded (2021 divided by 2022) by centre

So which measure should we use?
In a nutshell, both!
One can always cut and present data in different ways. And, most of the time, if you torture the data enough, you can probably get it to tell the story you want.
Its therefore often recommended that both relative and absolute measures are presented when comparing probabilities across groups or timepoints. This gives the most complete – and transparent – picture possible.
So did independent schools “fiddle” the grades more in 2021 than other centres?
Such claims seem a little harsh to me.
Whether the difference in grades between 2021 and 2022 is greater for independent schools than other centre types really does depend on whether one is talking in an absolute or relative sense.
And there does seem to be a reasonable case that further education colleges – which were left off Chris Giles’s chart – saw an even greater decline in A-Level grades between 2021 and 2022 than independent schools.

One Response to “Did independent schools really ‘fiddle’ their A-Level grades more than other schools in 2021?”
- 1

This sums it up perfectly for me:
“One can always cut and present data in different ways. And, most of the time, if you torture the data enough, you can probably get it to tell the story you want.”
And hence discussions on the above really interesting article can so easily flounder in front of e.g. a public audience who are not sufficiently aware of the mathematical or statistical niceties (imho).