 Close
Close

Questions about PISA 2018, part 1: In Scotland, were key changes taken into account?
By IOE Blog Editor, on 22 April 2021
How much can we trust government reporting of key statistics? Not just the headline findings, but the basic details underpinning them? Those things that it’s important for consumers of data to know if they want to form their own independent judgement about the strength of the evidence available?
In my new paper released today, and forthcoming in the Review of Education, I report what I consider to be a worrying lack of transparency surrounding some aspects of the reporting of the PISA 2018 data for the UK.
This blog is the first in a series posted today looking into some of the issues. It focuses upon the data for Scotland, where a number of problems have emerged.
Change of test month
Between 2006 and 2015, PISA took place in Scotland around March/April. This changed in 2018, with PISA taking place between October and December.
As Table 1 illustrates, this change has had an impact upon the composition of Scotland’s PISA sample. Whereas between 2006 and 2015 almost all pupils who took PISA in Scotland were in S4 (the final compulsory year of schooling), this changed in 2018 when roughly half the sample was in S5.
Yet this fact has not been commented upon by either the Scottish government or the OECD. And there seems little published evidence on the impact this may have had upon Scotland’s PISA results.
This of course then means one has to make a giant leap of faith when comparing Scotland’s PISA 2018 results to those from previous PISA rounds.
Table 1. The distribution of pupils participating in PISA across different school year groups in Scotland.

Notes: Author’s calculations using the PISA 2006 – 2018 data for Scotland. Green shading should be read horizontally, and refers to a greater proportion of pupils belonging to that school year group.
Scotland’s unusually high-level of ‘ineligible” pupils
As illustrated by Figure 1, another unusual aspect of the PISA 2018 data for Scotland was the very high number of ‘ineligible’ pupils. Specifically, around 9% of Scottish pupils originally drawn in the PISA sample were later considered to be “ineligible”. This is a much higher rate than in most other OECD countries (where the ineligibility rate is less than 2%).
Figure 1. The within-school and total exclusion rates in PISA 2018.

Notes: Dashed red lines refer to the thresholds according to the OECD technical standards. Figures for Scotland and UK as a whole illustrated by purple square markers. Data presented for all countries participating in PISA 2018 with data available. Source = OECD (2019: Chapter 11).
Neither the OECD nor the Scottish government have provided any comment as to why exactly Scotland is such an outlier. In fact, this high ineligibility rate was not even mentioned in Scotland’s reporting of the PISA 2018 results.
However, my investigations suggests that this is likely to be linked to the change in the PISA test date and due to pupils moving between schools.
Critically, many of these “ineligible” pupils may be lower academic achievers – given how higher levels of pupil mobility has previously been linked to lower examination grades in other countries.
Pupil non-response
PISA imposes certain “rules” upon countries about their sample. One is that at least 80% of sampled pupils must complete the PISA test – otherwise a “bias analysis” must be undertaken.
Did Scotland reach this 80% threshold? Well, it depends how the calculation is done!
In Scotland, a total of 3,767 pupils were meant to take part in PISA (after the dubious removal of “ineligible” pupils described above). In the end, 2,998 completed the assessment.
Now, I have never been that great at maths. But I calculate that gives a response rate of 79.6% – just below the 80% threshold that is meant to trigger a bias analysis.
Yet, if one goes to the official documentation, the response rate is quoted as 80.5%! With this then being used to justify why a bias analysis for Scotland was not required.
But how has this figure of 80.5% come about?
Well, it seems that if the pupil response rate is too low within an individual school, then the OECD removes it from the pupil response rate calculation. It turns out there were two schools in Scotland (with 80 sampled pupils) with a very low response rate (only 29 of the 80 completed the test).
Hence, the “official” response rate for Scotland becomes 2,969 / 3,687 = 80.5%.
Does this really matter? We are, of course, splitting hairs here!
What really matters is that Scotland had the second lowest pupil response rate anywhere in the world (in only Portugal did fewer of the sampled pupils respond).
It is therefore my view that the Scottish government should really go back to the PISA 2018 data and conduct such a bias analysis – something that really should have happened before the results were released.
Low overall participation rates in PISA anywhere in the world
As I argue in my paper, schools and pupils can get excluded from PISA in many different ways. It is not just a case of schools, parents or pupils refusing to participate – countries can also choose to exclude some pupils (e.g. pupils with Special Educational Needs).
What really matters therefore is the cumulative impact this has upon the PISA sample. Table 3 illustrates this cumulative impact for Scotland and the UK as a whole.
Through a combination of exclusions, ineligibility, withdrawals and non-response, roughly 40% of the target population ends up falling out of the PISA study. Such a high level of non-participation clearly has the potential to introduce bias into the PISA sample.
Table 2. The cumulative impact of exclusions, ineligibility, withdrawals and non-response on the PISA data for Scotland and the whole UK.
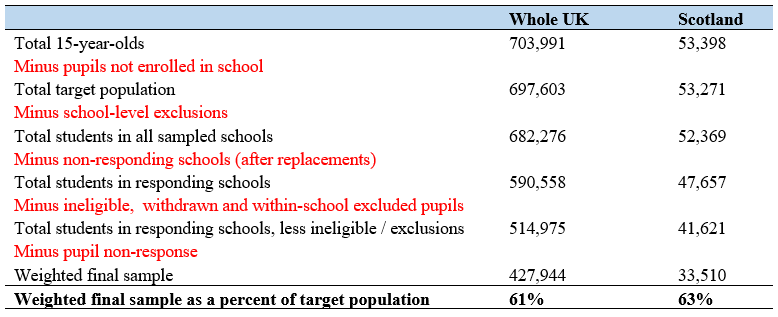
Notes: Figures refer to the estimated total population size. Source: OECD (2019: Chapter 11).
Moreover, as Table 4 illustrates, these figures do not compare favourably to elsewhere. Indeed, the UK has one of the lowest overall participation rates anywhere in the world.
Table 3. Cumulative impact of exclusions, ineligibility, withdrawals and non-response across countries.

Notes: Green / red shading indicates smaller / bigger cumulative impact. Figure for Croatia rounded down from 107% to 100% (likely due to inaccuracies in data on total population size). * indicates country had to conduct a non-response bias analysis. + indicates other issues with data “adjudicated” by the OECD (usually due to thresholds stipulated within technical standards not met).
Conclusions
In order to come to an informed opinion of what key education statistics like PISA show, it is vital that all the gory detail gets transparently reported and discussed. Where limitations with the data then emerge, these need to be clearly documented and thoroughly investigated.
This is, in fact, part of the UK Statistics Authority’s Code of Practice which clearly states how
“potential bias, uncertainty and possible distortive effects in the source data should be identified and the extent of any impact on the statistics should be clearly reported”.
This is not currently the case in PISA, with the standards of reporting by the Scottish government being particularly poor.
If public trust in the reporting of government statistics is going to be maintained, I feel this issue needs an urgent review, and for clear national guidelines put in place by the UK Statistics Authority to ensure the limitations of PISA are more clearly documented in the future.
More questions about PISA 2018
- Part 2: Did certain schools select out of the study in England and Northern Ireland?
- Part 3: How representative is the data for England and Wales?

