 Close
Close

How do GCSE grades relate to PISA scores?
By Blog Editor, IOE Digital, on 29 October 2019
When the reform to GCSEs was initially announced, under the watch of Michael Gove in 2014, the intention was to link performance on the new GCSE exams to the PISA test.
Now, as far as I am aware, this link between PISA and national examination standards has not been established. Instead we have the comparable outcomes policy [PDF] and the national reference test to ensure standards are comparable over time.
Yet the interesting question remains – how do the ‘currency’ of GCSE grades and PISA test scores translate?
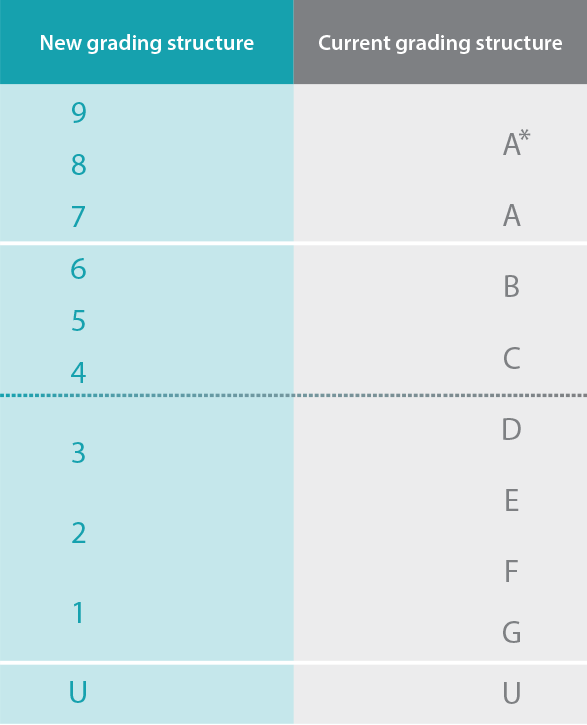
GCSE grades linked to PISA
The latest data currently available to look into this issue comes from PISA 2015, with that cohort of pupils sitting their GCSEs in May/June 2016. This group were the last to be tested fully under the old GCSE regime using alphabetic grades. Nevertheless, we can convert these into approximate ‘new’ 9-1 GCSE grades.
The table below compares GCSE mathematics grades and average PISA maths scores. It illustrates how a GCSE C grade (which translates to a grade 4 or a low grade 5) on average is roughly equal to a score of 473 on the PISA mathematics test.

A score at this level is some way below the OECD average (490) and roughly equivalent to a lowly 42nd place in the international rankings.
This perhaps illustrates why the Department for Education tried to raise the bar when introducing reformed GCSEs. Leaving the expected standard at grade 4 or above (grade C or above in old money) would not be considered ambitious enough. Hence a new a “strong pass” was introduced at grade 5 or above to bring the expected standard more in line with the international average.
By way of illustration, the equivalent score for a B (somewhere between a 5 and a 6) was about 50 PISA points higher, at 521 – equivalent to the average score of South Korea in 7th position.
The table below performs the same comparison for PISA reading and GCSE English language grades. Now, we probably have to be a bit more careful here, given that there are some quite significant differences in what these two tests are measuring. Nevertheless, the same holds true as for maths.

Having GCSE grade C (grade 4 and the bottom end of 5) as the target is not particularly ambitious: it is equivalent to only 488 on the PISA test – again below the OECD average and equal to the reading skills of the average teenager in Latvia.
On the other hand, teenagers who achieve a GCSE grade B (somewhere between a 5 and a 6) have the same reading skills as teenagers in Singapore (the top-performing PISA country).
In my opinion, if England’s policymakers want to be ambitious, there should be one pass mark only and this should be set at grade 5. Others will disagree with me though, as in the short-term at least there will be some limit on how many pupils could achieve this standard even if Ofqual allows some year-on-year growth in attainment.
PISA 2018 offers the first opportunity to benchmark new GCSEs internationally
Of course, all the analysis presented above is based upon a cohort of pupils who took the old GCSEs, prior to some of the recent reforms. Data from PISA 2018 linked to the National Pupil Database will offer the first opportunity to benchmark the new, reformed GCSEs (including the 9-1 formation of the grades) internationally.
This, in my view, should be a priority for future work by the Department for Education, so we can better understand how education standards in England compare to other countries across the world.
Other posts in this series can be found here, here, here, here, here and here.

6 Responses to “How do GCSE grades relate to PISA scores?”
- 1
-
2
Is PISA ‘fundamentally flawed’ because of the scaling methodology used? | IOE LONDON BLOG wrote on 5 November 2019:
[…] Other posts in this series can be found here, here, here, here, here, here and here. […]
-
3
Should we eat more fish or more ice-cream to boost PISA scores? | IOE LONDON BLOG wrote on 12 November 2019:
[…] Other posts in this series can be found here, here, here, here, here, here, here and here. […]
-
4
Is Canada really an education ‘superpower’? The evidence is not as clear-cut as you might think | IOE LONDON BLOG wrote on 19 November 2019:
[…] Other posts in this series can be found here, here, here, here, here, here, here, here and here. […]
-
5
Should England continue participating in PISA? | IOE LONDON BLOG wrote on 26 November 2019:
[…] Other posts in this series can be found here, here, here, here, here, here, here, here, here and here. […]
-
6
Five things to remember when the PISA 2018 results are released | IOE LONDON BLOG wrote on 2 December 2019:
[…] Other posts in this series can be found here, here, here, here, here, here, here, here, here, here and here. […]

This is very interesting, but becomes even more so if national IQs are included. Why wouldn’t you do this? My study of the CATs based Mossbourne Academy admissions system (Part 4 in my book ‘Learning Matters) reveals the issue.
Mossbourne had four quartile based admission bands
Band A – 110 & above
Band B – 100 – 109
Band C – 90 – 99
Band D – below 90
Mossbourne sets students for GCSE maths. It would be surprising if the CATs distribution in the four sets differed much from the admission bands.
But you couldn’t validly compare the quality of teaching in set 1 to that in set 4 from the raw results of any test, GCSE or PISA, could you?
This principle is the basis of my reworking of the 2015 PISA maths results, which has been endorsed by academics of international standing and has yet to be challenged.
https://rogertitcombelearningmatters.wordpress.com/2016/12/18/national-iqs-and-pisa-update/
These are the mean national IQs (with percentiles) for the countries listed in the article. These have been provided by Richard Lynn (see article for details and sources). While these data can be challenged for accuracy there is no doubt that significant differences on such a scale exist even though this fact may be a source of discomfort. The mean national IQ is given followed by the percentile and the corresponding Mossbourne Academy maths set
Singapore 109 (68th) set 2
South Korea 106 (66th) set 2
Israel 95 (39th) set 3
UAE 83 (12th) set 4
Georgia (not available)
Peru 85 (16th) set 4
Algeria (not available)
Dominican Republic 82 (12th) set 4
UK (PISA score 482) 100 (50th) set 2
US (PISA score 470) 98 (45th) set 3
The conclusions in my article still appear to be sound in that the performances of Singapore and South Korea are much less impressive when their high national IQs are taken into account and those of the UK and US are terrible however you look at them.
When you consider the GCSE column in the article it should not be surprising for students with CATs scores of 109 to get A/A* grades at GCSE