 Close
Close

Social mobility, education and income inequality: an overview in five graphs
By Blog Editor, IOE Digital, on 17 March 2016
Lee Elliot Major and John Jerrim.
The study of education inequality and social mobility increasingly feels like a small world. The British Prime Minister David Cameron hopes for improved educational opportunities for disadvantaged children. President Barack Obama has put the issue of inequality and social mobility at the heart of at least one State of the Union address. In fact most national leaders espouse similar aspirations. And at international gatherings the education challenges facing countries are strikingly similar: improving education in the early years; recruiting and developing good teachers; ensuring equitable access to leading universities.
But international comparisons matter precisely because of the differences they reveal between countries. We can indicate how well one education system or society is performing by comparing it against somewhere else (the assumption being that humans are basically the same across the world). At the same time good comparative data is devilishly hard to come by and offers mainly correlational not causal evidence. There are, however, five graphs that provide key insights into the levels and drivers of social mobility across the globe.
- Broken ladders of opportunity
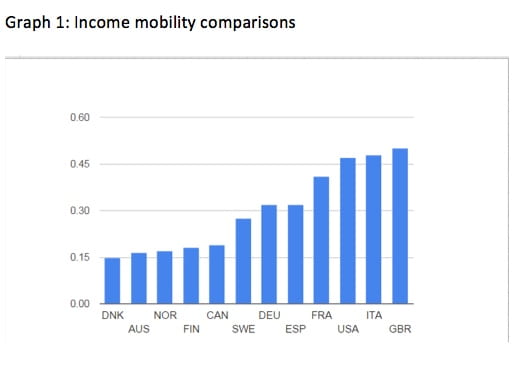
Income mobility varies by country and is lower than it could be in the UK and US
Social mobility was conceived originally as a measure of changing social class over a lifetime, but economists have exploited powerful datasets to produce estimates of mobility based on income. This measure assesses the strength of the link between income in childhood and income in adulthood. Measuring outcomes in monetary terms doesn’t tell us everything about an individual’s life achievements. But it is nevertheless a reasonable way of comparing social mobility across nations.
Below are comparisons of the persistence in income across generations for a range of developed countries. The higher the bars the less mobile nations are. Some caution is needed in reaching conclusions but a range of studies have produced similar findings. The graph shows that on this measure the UK has lower mobility than it could have; not only this but that we can do something to improve it. Other countries we can assume have broadly similar populations with the same genetic traits. There must be other factors – cultural, educational, societal – enabling children from lower income homes to break into different income brackets in later life as adults. According to this graph, we are wasting talent. The question is what are the factors driving social mobility and how can we change them for the better?
- The Great Gatsby Curve
More unequal societies are less mobile and the UK could be less mobile in the future
The graph below (originally produced by Canadian economist Miles Corak) compares two statistics for a number of rich nations. On the horizontal axis is the official Gini coefficient, which measures the level of income inequality at a point in time in a country. The higher the Gini coefficient, the bigger the income gap between the richest and poorest in society. On the vertical axis is what is termed ‘generational earnings elasticity’. This measure signals how sticky or immobile a society is comparing one generation with the previous one. The higher this number, the lower is social mobility.
Graph 2
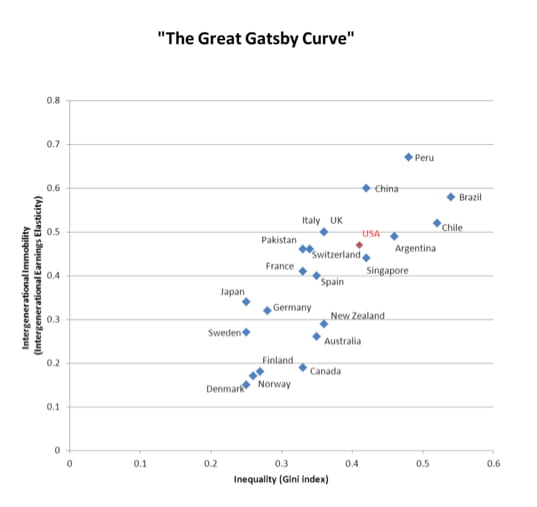
Put simply, when the rungs of the income ladder are wide, it’s more difficult to climb the ladder. One has to tread extremely carefully when inferring causation from such simple graphs (the controversy at the heart of the book, The Spirit Level). But President Obama’s senior economic adviser was so convinced that he named the graph the Great Gatsby Curve and used it to predict that income mobility will further decline in the United States over the next 25 years. Ominously, if the advisor Professor Alan Krueger is right then future British generations will also face lower social mobility. It’s fair to say that not everyone across the political spectrum agrees with Krueger’s claims as it suggests that the American dream has effectively died.
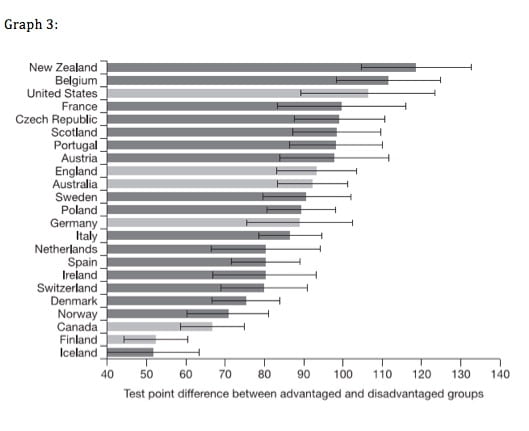
- Mind the Gap
Some education systems are better at narrowing the gap than others and the UK has a lot to learn from those performing well
It is perhaps the most universal and constant finding of educational research to date: there exists a stark and persistent gap in the educational achievement of poorer pupils and their more privileged counterparts. The table below shows that no country is without a gap. But what is noticeable is how much smaller it is in some countries compared to others.
The graph illustrates the difference in international reading test points between teenagers from the 20% of most advantaged homes and the 20% most disadvantaged homes. The gap is large in countries like Belgium, New Zealand and the United States (a difference of more than two school years or 100 PISA test points). Even in high performing nations like Finland and Iceland disadvantaged children remain more than one school year behind their more affluent peers (a difference of 50 PISA test points).
The OECD’s Andreas Schleicher is convinced that these differences cannot be explained by the different cultural or economic contexts outside the school gates in countries. He likes to point out that the poorest performers in Shanghai outperform even the highest achievers in many of the developed nations including the UK. Indeed even when comparing English speaking countries (Australia, Canada, the UK and the United States) the education gaps differ – despite obvious similarities in terms of language, political and economic systems and historical ties. What seems clear is that some education systems are better at delivering outcomes for all children and not just those from more privileged homes. It suggests that the UK could learn a lot from these countries.
- Education and the escalating arms race of social mobility
Education matters for mobility but may not act as the great social leveler we hope for
How much does education matter in shaping the life outcomes of people? The graph below demonstrates the extent to which social mobility is the result of differences in educational attainment for a range of countries. In most nations, education can explain up to 75 percent of the link between children’s family background and their outcomes in later life.
Indeed, in several countries, including Denmark, Finland, Norway, Sweden, Austria, Germany, Belgium, and the Netherlands, when educational achievement is taken into account, parental education has little additional impact upon the life outcomes of children. In other countries, including France, Japan, South Korea, and the UK, while education is still a big factor in determining outcomes, having graduate parents continues to impact on life prospects after education has been taken into account.
So we know that education matters. But the problem is that rather than acting as the great social leveller, it appears to interact with income inequality and aid the transmission of disadvantage from one generation to the next. In the UK this has been described as an “ever-escalating social mobility arms race”. As educational opportunities have expanded the wealthy have been better placed to seize these opportunities, and in the same period wage differentials according to level of education have risen, further advantaging those already better off.

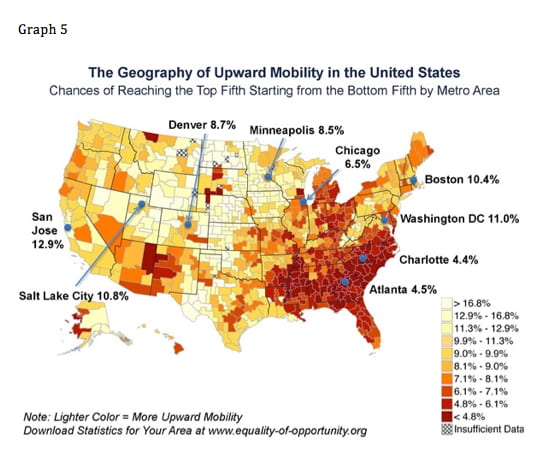
- The power of place
Social mobility varies within as well as between nations
We now also have some social mobility data within borders as well as between them. What is both surprising and illuminating is just how different social mobility levels are for apparently similar areas. Moreover, the same factors underpinning national levels of mobility also appear to drive them locally as well.
As the map below shows, in some US cities, including Pittsburgh, Seattle, and New York, your chances of climbing the income ladder are on a par with some of the most socially mobile countries in the world. For others however such as Atlanta and Memphis, levels of mobility are depressingly low. Lighter colours in the map represent regions of higher mobility, darker colours lower mobility.
These results chime with a social mobility map that ranks all parliamentary constituencies in England according to five measures of education. Looking at outcomes from the early years through to school results and entry into professional life, the data show how well each constituency is doing in improving prospects for their most disadvantaged young people. In this map, darker colours represent regions of higher mobility, while lighter colours highlight lower mobility.
The US researchers conclude that their findings can’t be explained simply by how poor different cities are, but point to some key characteristics associated with better life chances for poorer children. Regions with more social segregation and higher income inequality have lower upward mobility levels than elsewhere. Upward mobility is higher in regions with higher concentrations of two-parent families. And higher mobility levels are observed for areas where there are better schools. Not only this, the researchers suggest that these factors may be causal: young people who moved to ‘high opportunity areas’ in the US see their life prospects significantly improved.

4 Responses to “Social mobility, education and income inequality: an overview in five graphs”
- 1
-
2
gideonsappor wrote on 17 March 2016:
The issue of social mobility is too complicated for the ruling elite to understand. Attempts at improving it has been well meaning, yet it appears the full range of levers that needs moving to make a difference isn’t appreciated. Read my thoughts here:
The Quest for Social Mobility – the EastEnders effect http://wp.me/p5NSoM-2 via @wordpressdotcom -
3
On Social Mobility | My Blog wrote on 5 May 2016:
[…] it that we think of social mobility as related to poverty and the lower end of the Ladder of Life (read a great blog on the Ladder of Life)? It may be because all odds are stacked against moving up the ladder. Obviously, there is a […]
-
4
Social Mobility | My Blog wrote on 6 May 2016:
[…] it that we think of social mobility as related to poverty and the lower end of the Ladder of Life (read a great blog on the Ladder of Life)? It may be because all odds are stacked against moving up the ladder. Obviously, there is a […]

Really intersting blog and I wish i could add some of this to the article Tina Isaacs and I have done on the English system compared to comparable systems in the upcoming isse of Curriculum Journal.