 Close
Close

What’s in an A-level score? The new floor targets for post 16
By Blog Editor, IOE Digital, on 10 May 2013
Chris Husbands
The government is currently looking long and hard at the school accountability framework. In February, it published a thoughtful consultation document on Key Stage 4 accountability, and a similar document on Key Stage 2 is expected shortly: the headline performance measures for schools have always been the Key Stage 2 expectations for primary schools and the Key Stage 4 measures for secondary schools: the focus on Level 4 performance (at Key Stage 2) and threshold GCSE performance at grades C and above (at Key Stage 4) have simultaneously focused minds and energy whilst at the same time driving some behaviours in schools which mean that resource and effort is focused on marginal performance at critical boundaries. Nonetheless, the focus on floor targets has been a powerful driver for improved performance, especially in English and Mathematics.
With little fanfare, the government has now published minimum performance standards for ‘Key Stage 5’ – that is, for 16-19 providers. The performance standards are long overdue: there is too much poor and often unviable provision at 16-19, and comparatively little sustained scrutiny of performance across the sector. The government is right to develop common expectations covering schools and colleges, and to try to develop indicators which assess performance in A-Levels and other academic and vocational qualifications taken at level 3. But at the same time that it is consulting intelligently about key stage 4 accountability, it appears to have developed indicators which will drive some perverse behaviours at key stage 5. The KS5 minimum standard will describe a school sixth form or college as underperforming if its results show that fewer than 40 per cent of students achieve an average point score per entry in academic or vocational qualifications equal to the fifth percentile of providers nationally.
The key flaw is simple, but technical. The current KS5 performance tables present two sets of data on institutions’ achievement: an average points score per student, and an average points score per entry. The points score is derived from the national points tariff – 300 points for an A* at A-level, 270 for an A, 240 for a B and so on, and a parallel tariff for approved vocational qualifications. However, the KS5 minimum standard is set at an average points score per entry, not per student. The perverse incentives can be easily illustrated: imagine a student predicted to score CCE at A-level. She has an average points score per entry of 190 (570/3). But if the school were to counsel her to drop the subject in which she is predicted an E, her average score per entry rises to 210: the measure has shifted, but the performance of the school or college has not. In this instance, it’s not clear that the interests of the student (narrowing her curriculum) are best served by the tactic which is in the best interests of the institution. Of course, this is based on a single case, but some institutions are managing very small cohorts: almost 600 institutions have cohorts of less than 125 students. Given the indicator – the points score secured by fewer than 40% – institutional behaviour of this sort could make a difference.
The relationship between the average points score per student and the average points score per entry is strong: that is, schools and colleges which have high average points score tend also to have a high average score per entry. The graph sets out the relationship based on A-level scores in 2012, with the red line indicating the lowest quintile of institutions. This is partly a consequence of a strongly selective post-16 structure in which some institutions set relatively high entry requirements at GCSE – and note that the DFE KS5 floor target is a norm-referenced measure against the performance of the sector as a whole, rather than a progress measure from 16, for which the data does exist. But the relationship is not absolute, and is weakest in the lowest quintile of performers, again suggesting considerable scope for institutional response to perceived signals in the accountability regime.
Relationship between average A-level score per entry and average A-level score per student, 2012:
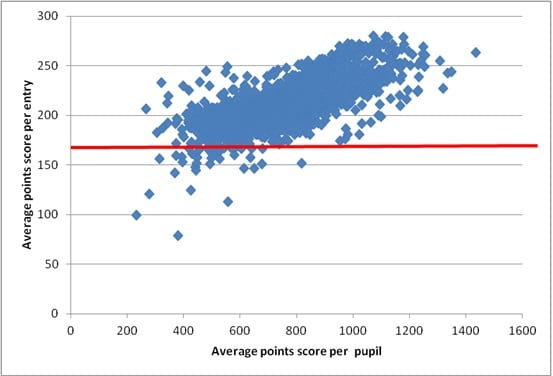
It would be relatively easy to replace the planned per entry indicator with a per student indicator. As the graph indicates, this would be neutral for most institutions, but it would send important signals to those institutions that may be at risk of receiving a notice to improve: it is students who matter.

5 Responses to “What’s in an A-level score? The new floor targets for post 16”
- 1
-
2
Chris Husbands wrote on 10 May 2013:
The quadrant idea is sensible and I’ll re-run the analyses to get the lines in place (though anyone can do this with the DFE data release). Clearly the resource constraints focus attention on the performance of individual students in the lower quadrant – are L3 qualifications fit for purpose for all candidates – but this is a question about the qualifications structure on which you have done first rate work
-
3
Chris Husbands wrote on 10 May 2013:
Tom: I have just cut the data as you suggest. The bottom quadrant includes 309 centres. It’s worth noting that the average size of these centres is 109 students; the average size of centres in the other three quadrants is 140. Clearly there are some very large centres and some very, very small ones.
-
4
Steve McArdle wrote on 12 May 2013:
Chris – I think from my reading of it there is a little more to it where AS and A level grades mix. Since all those completing significant courses are listed most A level students will appear twice, once each year. The first time they, or their entries score low points and the second time higher (although most currently with a narrower student level diet). This means that if a centre has a disproportionately larger ratio of AS/A2 students then it is more at risk of falling through the floor. Although on a positive note it might encourage retention I think this is a largely negative factor. It certainly makes taking on risky (aspirational) students or growth unattractive.
Looking at the certification or not of AS in future this new measure could be seen as a device to drive the schools away. If more schools move away from entering Year 12 or (measured by entry) cut the Year 12 course to 3 subjects, then the average drifts upwards and this will push more schools into the two year, linear, no credits option just to avoid the trap-door. I do not think that pushing to the three subject linear model will benefit students. -
5
Jennie Golding wrote on 24 May 2013:
I think it’s worse than Chris suggests, because it takes into account neither prior attainment nor relative difficulty (or value) of the A Level: grade Ds in Mathematics and Physics A Levels are valuable currency for a not-particularly academic student wishing to go into Engineering, and a real achievement from mediocre attainment at GCSE, as well as much-needed in terms of national supply. Under either of the measures discussed, there would be every incentive for centres to encourage such a student to look at ‘softer’ options – or non-A Level courses.

This is really interesting Chris. It seems to me we could have two indicators – a line against both axes. Providers would need to be in the top-right quadrant and it would be doubly problematic if they were in the bottom left. The points per student is flawed when over-entry is favoured to notch up points even if the quality of each entry is low… though financial constraints would keep that in check to a large extent.