X Close

Global Social Media Impact Study

Home

Project Blog

Menu

Quantitative data: Our figures take shape

By Daniel Miller, on 13 April 2015

Student in maths class

Getting to grips with the numbers (Photo by woodleywonderworks CC BY 2.0)

There is sometimes an assumption that while anthropology represents a unique commitment to qualitative research, with all our studies consisting of 15 months fieldwork, we somehow have an antipathy to quantitative data. Yet the very reason we spend so long in the field is testimony to our commitment to the highest level of scholarship and the sheer determination to accurately portray that population. For which purpose all information that helps us towards these goals is welcome, and most anthropologists do collect some quantitative materials.

But in a way the accusation is correct. We generally feel that quantitative data alone is deficient. Partly because the answers people give to survey questions may not reflect what they actually do. More because figures need to be interpreted in order for us to properly understand what they mean. Without that deeper knowledge of context they may mislead rather than illuminate. So we are suspicious of quantitative ‘news’ which often takes the form of correlations (for example, a population’s weight or life expectancy set against one aspect of their behaviour). Often this could be the result of dozens of different ’causes’ or combinations of behaviours other than the one claimed. We prefer to use quantitative data which comes from within ethnographic study, where we can hope to make an informed interpretation.

All our projects included three types of quantitative material: an initial survey of at least one hundred people at the beginning of fieldwork (Questionnaire A), a second survey of a different minimum one hundred people at the end (Questionnaire B), and whatever additional surveys each researcher found useful. Because of the importance of context, we will release our quantitative results alongside our eleven volumes of qualitative reports on 4 February 2016. But currently we are looking at the integration of these results. What follows is a sample of the kinds of results we will eventually publish.

In the case of my study of our English site – The Glades – my main additional survey was one of 2,496 school pupils at four secondary schools in the area. One of the intentions was simply to find out what which social media platforms these pupils were present on (see Table ‘Top of the class’). It was striking that these six stood out, with no other platforms emerging at above 10% overall.


Since this was also a response to my earlier blog post suggesting English schoolchildren were using Facebook, but that it was no longer ‘cool’, we also asked students what their three favourite platforms were. We found only 12.7% picked Facebook as their favourite social media, 8.4% as their 2nd favourite and 9.7% as their 3rd favourite.

Questionnaire B, by contrast, will be mainly released as a comparison across all of our nine sites.

These are illustrations of what is to come. Generally though, we would rather be patient and consider these in relation to our qualitative findings before we formally publish them.

On not resolving an issue with statistics

By zcsaf26, on 10 September 2014

By Ciara Green and Daniel Miller

Image by Giselle, Creative Commons

Image by Giselle, Creative Commons

For 18 months, we have worked together on the ethnography of The Glades. As part of this, we intend to write a joint paper focusing on the research we did within four local secondary schools on sixth formers aged 16-18. This will be concerned with the precise impact of new social media on relationships between school pupils, rather than schooling itself. It particular, we will examine relationships that have been discussed in terms of ‘cyber bullying.’ Much of this is dictated by policy concerns and as a result, tends to classify pupils, for example, into victims and bullies. By contrast, we want to situate such issues within the more general and now ubiquitous use of social media amongst this population, without diminishing our concern with the impact of such behaviour, including the potential for suicide. Our method will be to respect the way the pupils themselves discuss these issues, which suggests a much more ubiquitous culture of quarrelling such as the occurrence of what the school pupils refer to as ‘Twitter Beef’ within which many people play varying roles at different times. Our main contribution will be to try and isolate changes which seems unequivocally related to the specifics of social media, such as the use of ‘indirects’, the expansion of communication from within school to potentially 24 hour access, and the idea that people are more inclined to problematic communication when ‘hiding behind a screen’.

We cannot, however, ignore a huge popular debate on whether social media makes the lives of these pupils in some ways better or worse. In particular, there are more sensationalist newspaper articles that imply a massive increase in cyber bullying with major consequences for pupils. In response to this we found we had different perspectives. Ciara is of the generation that experienced this activity and was subsequently more inclined to see social media as exacerbating problems and wants to ensure we don’t detract from this experience of harm. Danny, considering the ubiquity of such issues in periods prior to social media, was more conservative. We both, of course, recognise that the term cause is too simplistic and social media is part of much wider contexts. We will see changes that some regard as negative such as indirects and ubiquity and also ones the pupils regard as positive such as increased access to social support.

Nevertheless, we felt as good scholars we should supplement our interpretation of our pupil interviews with any other data that might be relevant. It seemed worth knowing, for example, whether the period of social media adoption coincided with any change in incidence in behaviour such as teenage suicide, eating disorders, cutting and self-harm. After spending a considerable amount of time on this issue and consulting with a statistician we soon found that good intentions were not enough. We find the statistical data is inconsistent and sometimes related to factors such as reporting self-harm which may not be the same as incidence. The academic papers based on such data are themselves constantly divided in the negative and positive gloss they put on such figures. Meanwhile, accounts in mainstream media tend to use such data to make eye-catching claims, such that the more ‘objective’ the data, the less objectively it seems to be used.

In turn, we have our own ambivalence about our qualitative data. Danny would see teachers’ suggestions that things were just as bad before social media as confirmation of his position, while Ciara sees it as confirmation that teachers are less close to the actual experience of pupils than they think. So where does that leave us? In practice, it leads us back to our starting point. What we can do is write clearly about which specific factors the pupils themselves believe has exacerbated negative consequences. We can also provide an important corrective to the policy directed classifications by using the pupils’ descriptions to give greater nuance that is usually found in terms such as ‘cyber bullying’. We can hope that precisely because we have differing perspectives we can, in combination, provide a fair reading of our extensive findings. Our discussions were not in fact enlightened by this wider enquiry. But, after all, even if the statistics had been clear as to trends, we would still have had plenty to debate around any assumption as to whether the material from our study accounts for any statistical correlation as opposed to many other possible factors. But then no one said academic writing is easy.

Between walls: methodology for comparing Chinese and non-Chinese social media

By Tom McDonald, on 27 July 2014

Comparing two walls: QZone is often referred to as the 'Chinese Facebook', but there are important differences between the two platforms (Photo: Tom McDonald)

Comparing two walls: QZone is often referred to as the ‘Chinese Facebook’, but there are important differences between the two platforms (Photo: Tom McDonald)

Recently our team has been doing a statistical analysis of  our particpants’ social networking use in our different fieldsites around the world. In the future this data will be one of the key ways we will compare between the fieldsites. For most of the fieldsites, the analysis takes place on Facebook using clever computer programs created by Shriram that helps to automate the data collection and make sure that the same techniques are used between all the fieldsites.

But our two fieldsites in North and South China pose a unique problem in terms of methodology. Facebook is inaccessible here in China, and most people use QQ or WeChat as their main social networking platform. Both these platforms are quite different to Facebook in terms of layout and functionality, and neither of them have proper, full APIs that allow you to run the kind of automated statistical analysis we have been attempting on Facebook. This raises an important methodological question: how is it possible to do a comparison between fieldsites when the thing that you are comparing is not the same?

It’s something I have felt that our team has struggled with throughout this project, and often when we have met as a group to discuss the project and our methodology, QQ seems to get pushed into the background. It often feels like Chinese social networks are this great, dark unknown. For a start, their appearance is incredibly different from Facebook, and the fact that many of them only support Chinese language versions makes them almost impenetrable to people who don’t understand the language. Our group’s internal fieldwork manuals, which contain comprehensive instructions that guide the rest of the team through how to research a particular question, are often reduced down to a single sentence for our China fieldsites: “Tom and Xinyuan will have to use local resources.”

This is not a complaint. Rather, it is a testament to how different Chinese social media is from the rest of the world. Also, it is a challenge to think through the comparisons we are trying to make; what kind of data they will provide us with and, most importantly, what conclusions we hope to make from them.

For example, one of the things we are analysing is who are the people who interact (i.e. like, comment) the most with our friends in the fieldsite on their wall. On Facebook this is simple enough, however on QZone we have to count these interactions manually on a wall-like feature called ‘His/Her Happenings’ (ta de dongtai). This is further complicated by the fact that users very rarely use their real name on their account, with most adopting creative pseudonyms such as ‘Lonely cigarette butt’. Also because people tend to repost many more memes on QZone than on Facebook, the ‘likes’ of friends can sometimes get lost between thousands of other likes, which can make it very confusing to count which of the likes come from a participant’s QQ friends.

I am not suggesting that this makes the data derived from our Chinese and non-Chinese fieldsites incomparable to each other. Rather, it points to the fact that any statistical figures that we come up with need to be treated as just one part of the puzzle, and that the very process of trying to produce such statistics highlights the important material differences between the platforms, which are begging to be documented and explained. Such accounts will help to make Chinese social media a little less of a ‘dark unknown’, and will tell us quite a lot about Chinese culture and life in the process.

Furthermore, these differences highlights the danger of simply looking at statistical data, and assuming it demonstrates an ‘absolute truth’. Reality is often more complicated that a simple percentage. Any statistical comparison needs to be tempered with the qualitative data we have been gathering through interviews and participant observation in each of our fieldsites that help to understand how social media is embedded into people’s lives.

Comparison is never simple or easy, especially so with a large global project like this. But I feel certain that the challenges such comparisons involve, and the opportunities they present for cultural understanding make it all the more important to try.

How are numbers important?

By Razvan Nicolescu, on 30 September 2013

Photo by Gabriela Nicolescu

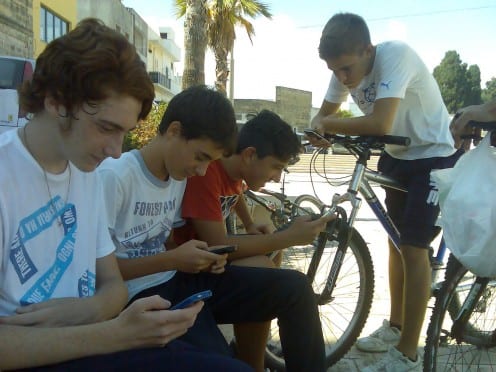
Young people in the Italy fieldsite using mobile phones (Photo by Gabriela Nicolescu)

This blog post is about some of the significances of the huge difference in the usage of social media between teenagers and other people in the Italian fieldsite. If we are looking at the average usage of social media, we could easily identify a few groups that are corresponding to different age groups. The first group is constituted by teenagers aged up to 16-18 year old who use social media, and especially Facebook, quite intensively. This means that most of them have around 1,000 online connections and if they are not always-connected through a smartphone than they may spend a few hours a day or every few days on different social media.

This definitely contrasts with the rest of age groups. Young people between say 20 and 30 year old use social media in a more nuanced way. Even their subscription to the service is more unpredictable. If most of the young people who use some sort of social media have on average around 200-300 online connections, there are individuals, like the ones described in my previous post, who near 1,000 connections and have very precise strategies for online communication. At the other end of the spectrum around 20% of young users who have a few tens of connections and engage sporadically in any social networking activity. The way these people think about online media is actually very close to the way young people who refuse to subscribe to any social media at all motivate their resistance. At the same time, the way young people use Facebook or Twitter is much more heterogeneous than in the case of teenagers: it ranges from a few minutes a week to a few hours a day and from random to constancy. It is interesting that most of the time this usage is quite consistent for any given individual and does not necessarily depend on the time of the year or on the work schedule.

Then, for adult population figures drop dramatically, from around 30-40% of young adults who are active on at least one social media to around 20% in the case of adults. Old people use social media rarely, and usually in relation to some younger relatives who live elsewhere and actively encourage this usage. Most of the time this media is skype, that seems to respond better to the exigencies of this particular kind of distant relationship. The reasons are many, from its synchronous character, the possibility of high quality video conversations, to the ease of its usage which is a highly important issue for old people who usually have relatively poor computer expertise.

Therefore, we have this highly unequal distribution of knowledge and practice in relation to social media across the town population. As most of the literature in this area focused on teenagers and different affluent, and influent, people or social groups, our project objectives aim to cover other segments of population as well as some particularly overlooked social issues. However, before doing that we need to understand the important differences in terms of penetration and usage that seem to exist in most of the sites in this project.

The questions that have arisen from the preliminary survey on the usage of social media that we undertook in the Italian fieldsite are many. I will discuss here just one aspect: the very different numbers and intensity of usage in relation to social media among the various age groups together with the complex social relations between people belonging to these age groups seem to indicate the fact that it would be completely meaningless to focus exclusively on social media. That is, social media could not account but for a particular part of the society and the relationships that are at work here. At the same time, social media seems to be a very helpful lens through which we, as anthropologists, could make sense of these relationships exactly because they are objectified in a very transparent and accessible medium. In particular, I suggest that the numbers presented in this post point not to an inequality between different age groups, but rather to a very specific mutual completion of these.

Some of the ways society understands to use the numbers related to social media are more obvious: for instance, the educational systems’ inefficient attempts to adapt themselves to the impressive request and consumption of new technology and media. These attempts seldom imply massive public spending on initiatives that are at least questionable, such as the new-technology-for-the-disadvantaged or the ones promising the migration of sensitive schooling processes on different IT infrastructures. These are examples of ‘big numbers’ taken ad litteram, with little, if any, attempts of critical interpretation. As fieldwork shows, whenever ‘big numbers’ are judged independently from ‘small numbers,’ important misunderstandings happen. The simple reason is that either one of these two groups could easily be irrelevant when not considered in relation with the other or when this relation is taken for granted.

Even a Prime Person who is not Odd can read this

By Shriram Venkatraman, on 12 November 2012

Photo: cogdogblog (Creative Commons)

Ok! This post is just a quick example on how a purely statistical Facebook Analysis might be of least value to a Social Science Researcher.

The following is numerical information produced based on the number of Facebook friends for a team of eight internet researchers (from information obtained on 11 November 2012).

  1. 87.5% had even number of friends
  2. While the minimum number of friends and the maximum number of friends are even numbers, the 81.25th percentile rank is an odd prime number.
  3. The Average number of friends and the median number of friends are Odd numbers. While the average is a prime number, the median is not.
  4. The sum of the total number of friends is 2939, which is again an odd prime number (goes with the simple Arithmetic rule that if you add an even number and an odd number then you end up with an odd number). But the chance of it being a prime number is impressive.
  5. When the odd prime number of friends was added to every other even number of friends to see if the sum would be an odd prime, it resulted that there was only a 25% possibility.
  6. None of the number of friends constitutes a Perfect Square
  7. None of the number of friends constitutes a Perfect Cube
  8. The sum of the difference between the closest perfect square to each of the person’s friends was an odd prime number.
  9. The Range is an even number and is not a perfect square.

Furthermore, the number of facts in this post is an Odd Perfect Square!!!

Questions matter, and the way you ask them matters too

By Xin Yuan Wang, on 15 October 2012

Man walking infront of question mark

Photo: An untrained eye (Creative commons)

I always think that it is the strong and inherent curiosity about people that has lead me down the academic path of anthropology. In the past five weeks, working with a group of passionate, intelligent, and curious people has been such an enjoyable experience for me. I can not tell exactly how many potential research questions we have posed, but it feels like a huge amount, much more than we can hope to answer for the moment. However, even this makes the project more exciting and worth studying.

The current eight week intensive discussion tends to build up collective “common sense” for every researcher on the project before they go off to their individual field sites. This should help to make sure that we will all come back with comparable data, which will help to constitute a ‘big picture’ of the global appropriation of social media. To that extent, we decided to have a “to-do” list of questions that everybody is supposed to work on whilst carrying out their fieldwork.

This list comprised, first of all, of basic questions, such as “How many SNS accounts do you have?”; “What phone do you have and what plan?” or “How many SNS friends do you have?” These questions are short and concrete, making sure that ethnographers will collect basic statistics.

“Clever question” comprise the second level of questions, which means addressing a particular research question in a clever way. The way a question is presented to the participant will significantly affect the answer that they give. To put it in a simple way, the questions you want to ask matter, and the way you ask them matters just as much. For example, instead of asking people vaguely ‘what do you think of online privacy?’ a more specific but ‘purpose-hidden’ way of asking might be ‘what kind of information you will never post online?’ or ‘do you want your mother to be your Facebook/QQ friend?’. These questions are more likely to reveal a more nuanced truth. Clever questions can be very open ended, which are likely to lead to more detailed inquiries and in-depth discussions.

Built on ‘clever questions’, the third level of questions is even more profound and comprehensive given the possible situation that there will be several key informants with whom the ethnographer spends a huge amount of time and has abundant opportunities to conduct participant observation whilst in their company. In which case, these questions will not be confined to the previous structure and go deep into either specific issues, or develop into more portrait-like stories of the informant.

We have been amazed at the diversity and richness of the three-level questions everyone in the group has been contributing, which not only inspires each other but also guarantee the depth and width of our collective thinking. Generally speaking, anthropologists don’t have much reputation in ‘team work’. A lonely wanderer in an alien place is more like to exemplify an archetypal anthropologist. Also, some would argue that participant-observation of anthropology does not necessarily require any question. However, given the scale of this ambitious project we feel it would be useful to apply a well-organized framework and think about questions seriously to guarantee a comparative structure, whilst still retaining a degree of individual autonomy for each fieldworker.