X Close

GEE Research

Home

Research in Genetics, Evolution and Environment

Menu

Archive for the 'Research' Category

Handicaps, Honesty and Visibility
Why Are Ornaments Always Exaggerated?

By Claire Asher, on 23 October 2014

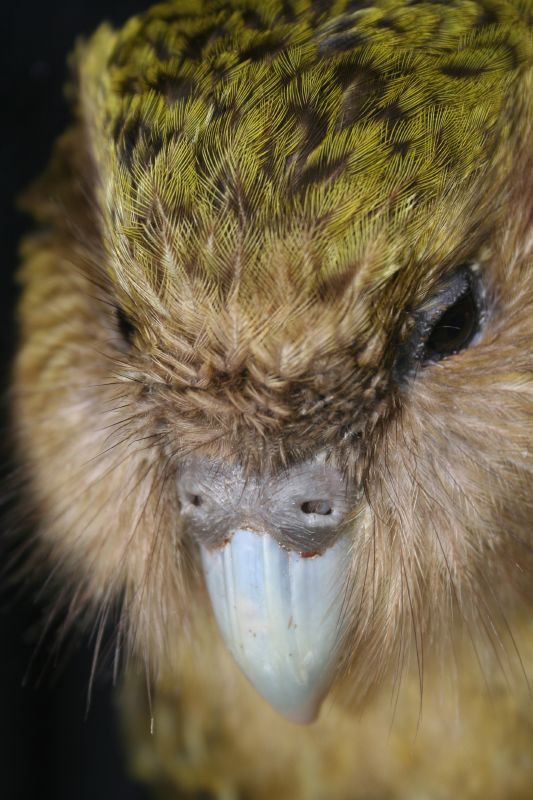
Sexual selection is a form of natural selection that favours traits that increase mating success, often at the expense of survival. It is responsible for a huge variety of characteristics and behaviours we observe in nature, and most conspicuously, sexual selection explains the elaborate ornaments such as the antlers of red deer and the tail of the male peacock. There are many theories to explain how and why these ornaments evolve; it may be a positive feedback loop of female preference and selection on males, or ornaments may signal something useful, such as the genetic quality of the male carrying them. One way or another, despite the energetic costs of growing these ornaments, and the increase risk of predation that comes with greater visibility, sexually selected ornaments must be increasing the overall fitness of individuals carrying them. They do so by ensuring the bearer gets more mates and produces more offspring.

Theory predicts that sexually selected traits should be just as likely to become larger and more ostentatious as they are to be reduced, smaller and less conspicuous. However, almost all natural examples refer to exaggerated traits. So where are all the reduced sexual traits?

Runaway Ornaments

Previous work by GEE researchers Dr Sam Tazzyman, and Professor Andrew Pomiankowski has highlighted one possible explanation for this apparent imbalance in nature – if sexually selected traits are smaller, they are harder to see. Using mathematical models, last year they showed that differences in the ‘signalling efficacy’ of reduced and exaggerated ornaments was sufficient to explain the bias we see in nature. Since the purpose of sexually selected ornaments is to signal something to females, if reduced traits tend to be worse at signalling, then it makes sense that they would rarely emerge in nature. Their model covered the case of runaway selection, whereby sexually selected traits emerge somewhat spontaneously due to an inherent preference in females. It goes like this – if, for whatever reason, females have an innate preference for a certain trait in males, then any male who randomly acquires this trait will get more mates and produce more offspring. Those offspring will include males carrying the trait and females with a preference for the trait, and over time this creates a feedback loop that can produce extremely exaggerated traits. Under this model of sexual selection, differences in the signalling efficacy can be sufficient to explain why we so rarely see reduced traits.

Handicaps

However, this is just one model for how sexually selected ornaments can emerge, so this year GEE Researchers Dr Tazzyman and Prof Pomiankowski, along with Professor Yoh Iwasa from Kyushu University, Japan, have expanded their research to include another possible explanation – the handicap hypothesis. According to the handicap principle, far from being paradoxical, sexually selected ornaments may be favoured exactly because they are harmful to the individual who carries them. In this way, only the very best quality males can cope with the costs of carrying huge antlers or brightly coloured feathers, and so the ornament acts as a signal to females indicating which males carry the best genes. This is an example of honest signalling – the ornament and the condition or quality of the carrier are inextricably linked, and there is no room for poor quality males to cheat the system.

Using mathematical models, the authors investigated four possible causes for the absence of reduced sexual ornaments in the animal kingdom. Firstly, like the case of runaway selection, differences in signalling efficacy might explain the bias. Under the handicap hypothesis, ornaments act as signals of genetic quality, so it would be little surprise that their visibility or effectiveness at conveying the signal would be important. Smaller ornaments may simply be worse at attracting the attention of females, meaning that the benefits of the sexual ornament don’t outweigh the costs. Similarly, the costs for females of preferring males with reduced ornaments may be higher than for exaggerated ornaments, because it is easier to find males with exaggerated traits. Again, this could theoretically tip the balance of cost and effect away from selecting for reduced ornaments. An alternative explanation is that the costs of the ornament itself are different for reduced and exaggerated traits. This seems quite likely in many cases, since a large ornament would require more resources to grow. But in this case selection would be more likely to produce reduced ornaments with lower costs! In order to replicate the excess of exaggerated traits we see in nature, reduced traits would have to cost more – much less biologically plausible. However, if large ornaments tend to be more costly, then they may be more likely to be condition-dependent, a key tenant of the handicap principle. Exaggeration may be more effective at producing honest signalling and exaggerated traits may therefore be more useful to females as a signal of quality.

Honest Signals

The results of modelling highlighted two key ways in which exaggerated traits might be favoured by the handicap process. In the model, when exaggerated traits have a higher signalling efficacy or are more strongly condition-dependent, exaggerated traits tend to be more extreme than reduced traits. The model still predicts that reduced traits are equally likely to evolve, just that they will tend to be less extreme examples of ornamentation. The other two possible explanations – higher costs to females that prefer small ornaments or the males that carry them, failed to consistently produce the observed lack of reduced ornaments. Both explanations were able to produce this outcome under certain circumstances, but in other circumstances they produced the opposite effect. Exaggerated ornaments, therefore, may be more common because they are more effective signals that are more likely to be honest.

Based on this and previous work by Dr Tazzyman and colleagues, asymmetries in the signalling efficacy of reduced and exaggerated traits is sufficient to explain the lack of reduced traits in nature. Whether ornaments evolve via runaway selection or the handicap process, asymmetrical signalling efficacy tends to favour exaggerated traits. However, in the case of the handicap process, asymmetries in condition-dependance of the trait may also be involved. These two explanations are not mutually exclusive, and it is likely that in reality many factors are involved.

Importantly, for both explanations and for both type of sexual selection, the models still predict that exaggeration and reduction will be equally likely. The differences emerge in terms of how extreme the ornament will become. Thus, this work predicts that there are many examples of reduced ornaments in nature, perhaps we just haven’t found them yet. This is especially likely if reduced traits that might be less noticeable anyway also tend to be less extreme. Alternatively, there may be other asymmetries not yet considered that make reduced ornaments less likely to emerge in the first place.

Where Next?

The authors suggest some very interesting avenues for future research. Firstly, they suggest that more complex models investigating how multiple different asymmetries may act together to produce sexually selected ornaments will get us closer to understanding the intricate dynamics of sexual ornamentation. Secondly, these models have only considered cases where evolution of the trait eventually settles down – at a certain ornament size, the costs and benefits of possessing it are equal, and the trait should remain at this size. However, in some cases the dynamics are more complex, and traits undergo cycles of exaggeration and reduction. Research into the impact of asymmetries in condition-dependence and signalling efficacy in these ‘nonequilibrium’ models would yield fascinating insights into the evolution of sexual ornaments.

Original Article:

() Evolution

nerc-logo-115ERCepsrc-lowres

This research was made possible by funding from the Natural Environment Research Council (NERC), the Engineering and Physical Sciences Research Council (EPSRC), the European Research Council (ERC)

PREDICTS Project: Land-Use Change Doesn’t Impact All Biodiversity Equally

By Claire Asher, on 13 October 2014

Humans are destroying, degrading and depleting our tropical forests at an alarming rate. Every minute, an area of Amazonian rainforest equivalent to 50 football pitches is cleared of its trees, vegetation and wildlife. Across the globe, tropical and sub-tropical forests are being cut down to make way for expanding towns and cities, for agricultural land and pasture and to obtain precious fossil fuels. Even where forests remain standing, hunting and poaching are stripping them of their fauna, degrading the forest in the process. Habitat loss and degradation are the greatest threats to the World’s biodiversity. New research from the PREDICTS project investigates the patterns of species’ responses to changing land-use in tropical and sub-tropical forests worldwide. In the most comprehensive analysis of the responses of individual species to anthropogenic pressures to date, the PREDICTS team reveal strong effects of human disturbance on the geographical distribution and abundance of species. Although some species thrive in human-altered habitats, species that rely on a specific habitat or diet, and that tend to have small geographical ranges, are particularly vulnerable to habitat disturbance. Understanding the intricacies of how different species respond to different types of human land-use is crucial if we are to implement conservation policies and initiatives that will enable us to live more harmoniously with wildlife.

Red Panda (Ailurus fulgens)

Habitat loss and degradation causes immediate species losses, but also alters the structure of ecological communities, potentially destabilising ecosystems and causing further knock-on extinctions down the line. As ecosystems start to fall apart, the valuable ecosystem services we rely on may also dry up. There is now ample evidence that altering habitats, particularly degrading primary rainforest, has disastrous consequences for many species, however not all species respond equally to land-use change. The functional traits of species, such as body size, generation time, mobility, diet and habitat specificity can have a profound impact on how well a species copes with human activities. The traits that make species particularly vulnerable to human encroachment (slow reproduction, large body size, small geographical range, highly specific dietary and habitat requirements) are not evenly distributed geographically. Species possessing these traits are more common in tropical and sub-tropical forests, areas that are under the greatest threat from human habitat destruction and loss of vegetation over the coming decades. The challenge in recent years, therefore, has been developing statistical models that allow us to investigate this relationship more precisely, and collecting sufficient data to test hypotheses.

There are three key ways we might chose to investigate how species respond to land-use change. Many studies have investigated species-area relationships, which model the occurrence or abundance of species in relation to the size of available habitat. These studies have revealed important insights into the damage caused by habitat fragmentation, however they rarely consider how different species respond differently. Another common approach uses species distribution models to predict the loss of species in relation to habitat and climate suitability. These models can be extremely powerful, but require large and detailed datasets that are not available for many species, particularly understudied creatures such as invertebrates. The PREDICTS team therefore opted for a third option to investigate human impacts on species. The PREDICTS project has collated data from over 500 studies investigating the response of individual species to land-use change, and their database now includes over 2 million records for 34,000 species. Using this extensive dataset, the authors were able to model the relationship between land-use type and both the occurrence and abundance of species. One of the huge benefits of this approach is that their dataset enabled them to investigate these relationships in a wide range of different taxa, including birds, mammals, reptiles, amphibians and the often neglected invertebrates.

Modelling Biodiversity

Sunbear (Helarctos malayanus)
image used with permission from
Claire Asher (Curiosity Photographic)

The resulting model included the responses of nearly 4000 different species across four measures of human disturbance; lang-use type, forest cover, vegetation loss and human population density. The vast dataset, the PREDICTS team were able to compare the responses of species in different groups (birds, mammals, reptiles and amphibians, invertebrates, between habitat specialists and generalists and between wide- and narrow-raging species. Their results revealed a complex interaction between these factors, which influenced the occurrence and the abundance of species in different ways.

In general human-dominated habitats, such as urban and cropland environments, tended to harbour fewer species than more natural, pristine habitats. Community abundance in disturbed habitats was between 8% and 62% of the abundance found in primary forest, and urban environments were consistently the worst for overall species richness. In these environments, human population density and a lack of forest cover were key factors reducing the number of species. Human population density could impact species directly through hunting, or more indirectly through expanding infrastructure. However, these factors impact different species in different ways, so the authors next investigated different taxa separately.

Birds appear to be particularly poor at living in urban environments, most likely because they respond poorly to increases in human population. Forest specialists and narrow-ranged birds fare especially badly in urban environments; only 10% of forest specialists found in primary forest are able to survive in urban environments. Although the effect was less extreme, mammals were also less likely to occur in secondary forest and forest plantations than primary forest, and forest specialists were particularly badly affected.

Urban Pests
Although many species were unable to exist in disturbed habitats, those species that persisted were often more abundant in human-modified habitats than pristine environments. This isn’t particularly surprising – some species happen to possess characteristics that make them well suited to urban and disturbed landscapes; these are often the species that we eventually start to consider a pest because they are so successful at living alongside us (think pigeons, rats, foxes). These species tend to be wide-ranging generalists, although sometimes habitat specialists do well in human-altered habitats if we happen to alter the habitat in just the right. Pigeons, for example, are adapted to nesting on cliffs, which our skyscrapers and buildings inadvertently mimic extremely well. The apparent success of some species in more open habitats such as cropland and urban environments might also be partly caused by increased visibility – it’s far easier to see a bird or reptile in an urban environment than dense primary forest! This doesn’t explain the entire pattern, however, and clearly some species are simply more successful in human-altered habitats. They are in the minority, though.

Do Reptiles Prefer Altered Habitats?
One interesting finding was that for herptiles (reptiles and amphibians), more species were found in habitats with a higher human population density. This rather unexpected relationship might reflect a general preference in herptiles for more open habitats. Consistent with this, the authors found fewer species in pristine forest than secondary forest. However, upon closer inspection the authors found that herptiles do not all respond in the same way. Reptiles showed a U-shaped relationship with human population density – the occurrence of species was highest when there were either lots of people or no people at all. By contrast, amphibians showed a straight relationship, with increases in human population density being mirrored by increases in the number of species present. This highlights the importance of investigating fine-scale differences between species in their responses to human activities.

Filbert Weevil (Curculio occidentis)

Consistent with previous studies, the traits of species were very important in determining whether a species was found in human-altered habitats. Narrow-ranging species were much less likely to occur in any habitat than wide-ranging ones, but this difference was particularly clear for croplands, plantation forests and urban habitats. The extent of human impact was also a key factor determining the occurrence of species in different habitats. Forest cover, human population density and NDVI (a measure of vegetation loss taken from remote sensing) all reduced the number of species present. Measures of disturbance and species characteristics do not act in isolation – the best models produced by the PREDICTS team included interactions between these variables. Invertebrate numbers were lowest in areas of high human population density and high rates of vegetation loss.

This study is the first step in more detailed, comprehensive analyses of the responses of species to human activities. The power of this study comes not only from it’s large dataset and broad spectrum of taxonomic groups, but also from it’s ability to directly couple land-use changes with species’ traits such as range-size and habitat specialism. The authors say that the next major step would be to incorporate interactions between species in these models – the community structure of an ecosystem can have profound effects on the species living in it, and changes in the abundance of any individual species does not happen in isolation from the rest of the community.

Check out the PREDICTS Project for more information!

Original Article:

() Proc. R. Soc. B

nerc-logo-115new-bbsrc-colour

This research was made possible by funding from the Natural Environment Research Council (NERC), and the Biotechnology and Biological Sciences Research Council (BBSRC).

Applying Metabolic Scaling Laws to Predicting Extinction Risk

By Claire Asher, on 25 September 2014

The Earth is warming. That much were are now certain of. A major challenge for scientists hoping to ameliorate the effect of this on biodiversity is to predict how temperature increases will affect populations. Predicting the responses of species living in complex ecosystems and heterogenous environments is a difficult task, but one starting point is to begin understanding how temperature increases affect small, laboratory populations. These populations can be easily controlled, and it is hoped that the lessons learned from laboratory populations can then begin to be generalised and applied to real populations. Recent research from GEE academics attempted to evaluate the predictive power of a simple metabolic model on the extinction risk of single-celled organisms in the lab. Their results indicate that simple scaling rules for temperature, metabolic rate and body size can be extremely useful in predicting the extinction of populations, at least in laboratory conditions.

Current estimates suggest that over the next 100 years we can expect a global temperature rise of between 1.1°C and 6.4°C. This change will not be uniformly distributed across different regions however, with some areas expected to experience warming at twice the global average rate. Temperature is known to be a crucial component in some of the most basic characteristics of life – metabolism, body size, birth, growth and mortality rates. These characteristics have been shown to scale with temperature in an easily predictable way, formalised in the Arrhenius equation. This equation yields a roughly 3/4 scaling rule, so that as temperature increases, metabolism increases around 75% as fast. This relationship appears to hold true for a variety of taxa with different life histories and positions in the food chain. Models based upon this rule can be designed that are very simple, which makes it easy for scientists to collect the data needed to plug into the model. But are they accurate in predicting extinction?

Recent research conducted by GEE and ZSL academics Dr Ben Collen and Prof. Tim Blackburn, in collaboration with the University of Sheffield and The University of Zurich, investigated the predictive power of simple metabolic models on extinction risk in a single-celled protist Loxocephallus. They first collected data on the population and extinction dynamics of a population held at constant temperature. This data was fed into a model based on scaling laws for metabolic rates and temperature, which in turn attempted to predict extinction risk under different temperature changes. The researchers tested how real protists responded to temperature changes – for 70 days they monitored populations of the protist Loxocephallus under either decreases or increases in temperature. Populations began at 20°C and increased to 26°C or decreased to 14°C at different rates (0.5°C, 0.75°C, 1.5°C or 3°C each week). Most populations eventually went extinct, but these extinctions happened sooner in hotter environments, and mean temperature showed a strong correlation with the date at which the population went extinct. Extinction tended to happen sooner in populations subjected to more rapid warming.

None of this is particularly surprising, but what the researchers found when they ran their models was that, even with relatively minimal data to start out with (population dynamics under constant ‘normal’ conditions), and using only simple scaling laws to predict extinction, their model was able to accurately predict when populations would go extinct under different warming or cooling conditions, with an accuracy of 84%. One important factor was the specifics of the temperature changes that were input into the model – using average temperature across the experiment rather than actual temperature changes produced much less accurate results.

This research is a first step in creating models that may help us predict the future extinction dynamics of wild populations subjected to unevenly distributed climatic warming over coming decades. It is a long way from a simple model of a laboratory population to a model that can accurately predict the future of complex assemblages of wild animals that are also subject to predation, disease and a healthy dose of luck. But the fact that these models can work for simple systems in laboratory conditions is a great first start – if they didn’t work for these populations, we could be fairly sure they wouldn’t generalise to natural populations. This shows that simple phenomenological models based on basic metabolic theory can be useful to understand how climate change will effect populations.

Original Article:

nerc-logo-115

This research was made possible by funding from the Natural Environment Research Council (NERC).

The Importance of Size in the Evolution of Complexity in Ants

By Claire Asher, on 16 September 2014

Ants are amongst the most abundant and successful species on Earth. They live in complex, cooperative societies, construct elaborate homes and exhibit many of the hallmarks of our own society. Some ants farm crops, others tend livestock. Many species have a major impact on the ecosystems they live in, dispersing seeds, consuming huge quantities of plant matter and predating other insect species. One of the major reasons for their enormous success is thought to be the impressive division of labour they exhibit. Theory suggests that, during the evolution of ants, increases in colony size drove increases in the complexity of their division of labour. However, there have been few previous attempts to test the hypothesis. A recent paper by GEE’s Professor Kate Jones and Phd student Henry Ferguson-Gow tested this hypothesis across the Attine ants, a large neotropical group including the famous leaf-cutter ants.

Ants, along with other social insects such as some bees, wasps and termites, are eusocial. This means that reproduction in their societies is dominated by just one or a few queens, while most of the colony members never reproduce, but instead perform other important tasks such as foraging, nest construction and defence. This system initially puzzled evolutionary biologists, because it poses the question, “how do non-reproductive workers pass on their genes?”. More specifically, “how can genes evolve to generate different morphology and behaviour in workers if they never reproduce and pass those genes on?”. This question was resolved in the 1960s, when W.D. Hamilton proposed the concepts of inclusive fitness and kin selection. He pointed out that although members of the non-reproductive worker caste do not directly pass on their genes, they are helping to ensure the survival of their siblings. Closely related individuals, such as siblings, share a large percentage of their genetic information, so by helping relatives, you are indirectly passing on your genes. Inclusive fitness is a measure of the total reproductive success of an individual, including direct fitness (gained by producing your own offspring) and indirect fitness (gained by helping relatives to reproduce). Kin selection, a form of natural selection, can therefore favour genes that cause sterility in the worker caste through it’s positive effects on the reproductive success of relatives.

When eusociality first began to evolve, colonies were probably small and although the worker caste likely refrained from reproduction most of the time, they weren’t completely sterile. In small colonies, keeping your reproductive options open makes a lot of sense – if the queen dies you may have a good chance of taking over the colony and reproducing yourself. Through evolutionary time, however, colony size increased in some lineages, and it is thought this may have driven increasing specialisation and commitment of individuals to their queen and worker roles. As colony size increases, your chances for gaining any kind of direct fitness start to decrease very rapidly. As a worker it’s a much better bet to do what you can to maximise your indirect fitness benefits in large colonies, and this can be achieved by becoming increasingly specialised for your particular role. Increases in division of labour, for example, as individuals specialise more in particular tasks, may lead to increase colony efficiency and success. In turn, this may allow for the evolution of larger colonies, resulting in a positive feedback loop whereby increases in colony size lead to increases in division of labour which lead to increases in colony size, and so on. This force may have lead to the evolution of ant species with enormous colonies – over a million workers can be found in some leaf-cutter colonies!

GEE Researchers Professor Kate Jones and Henry Ferguson-Gow, along with colleagues at the University of East Anglia and the University of Bristol, produced a phylogenetic tree for the Attine Ants (a group containing over 250 species), and mapped social and environmental data onto this tree in order to test for the effects of colony size and environment on the evolution of more sophisticated division of labour. The Attini are a good group of ants to test this hypothesis in, as they show large variation in colony size and the extent of morphological divergence between the queen and worker caste.

They collected published data on social traits (colony size, worker size, queen size) and environmental conditions (daytime temperature, seasonality in temperature and precipitation) for over 600 observations of populations for 57 species of Attine ant, including every single Attine genus. Using supertree methods, they constructed a phylogeny for the attine ants, which enabled them to control for evolutionary relationships and to estimate the speed at which evolutionary changes occurred.

Colony size ranged from 16 to 6 million individuals, with the largest colonies exhibited by the fungus growing leaf-cutter ants Atta and Acromyrmex. The authors found that increases in colony size through evolution are strongly associated with increases in both worker size variation (representing division of labour within the worker caste) and queen worker dimorphism (representing reproductive division of labour). Colony size showed a positve correlation with variation in size within the worker caste, and a weaker, but positive correlation with queen-worker dimorphism. Environmental factors such as temperature, rainfall and seasonality did not have any effect on colony size, indicating that climate and other environmental variables have not been an important factor in driving the evolution of increased colony size.

This study finds strong support for the size-complexity hypothesis, which suggests that during the evolution of eusociality, increases in colony size both drove and were driven by increases in division of labour and in specialisation of the queen and worker castes to their respective roles. This pattern may have also occurred during other major transitions in evolution, such as the evolution of multicellularity, which shares many similarities with the evolution of eusociality (e.g closely related group members, division of labour). The relationship between group size and complexity may therefore have been a crucial force in the evolution of complex life, and in the major evolutionary innovations that have generated the diversity of life we see today.

Original Article:

() Science

nerc-logo-115

This research was made possible by funding from the Natural Environment Research Council (NERC).

Understanding Catfish Colonisation and Diversification in The Great African Lakes

By Claire Asher, on 5 September 2014

Why some regions or habitats contain vast, diverse communities of species, whilst others contain only relatively few species, continues to be the subject of scientific research attempting to understand the processes and conditions that allow and adaptive radiation. The Great African Lakes exist as freshwater ‘islands’, with spectacularly high levels of biodiversity and endemism. They are particularly famous for the hyperdiverse Cichlid fish, but they are also home to diverse assemblages of many other fish, such as catfish. Recent research in GEE investigated the evolution of Clatoteine catfish in Lake Tanganyika, to investigate the forces driving evolutionary radiations in the Great African Lakes. Their results suggest that evolutionary time is of key importance to catfish radiations, with recently colonised groups showing less diversity than long-standing species.

Lake Tangayika is the World’s second largest freshwater lake, covering 4 countries in the African Rift Valley (Tanzania, the Democratic Republic of the Congo, Burundi and Zambia). It is home to the highest diversity of lake-dwelling catfish on Earth, however the evolutionary history of these catfish is not fully understood. GEE academic Dr Julia Day and PhD Student Claire Peart, in collaboration with colleagues at the Natural History Museum, London and the South African Institute for Aquatic Biodiversity, investigated the evolutionary history of nocturnal Claroteine catfishes in Lake Tangayika. This group of catfish offers an excellent opportunity to investigate the influence of different factors in evolutionary diversification, as it includes multiple genera with varying range sizes and habitat types.

The Drivers of Diversification

Previous research has suggested a number of factors that are important in enabling adaptive radiations that can produce extremely high levels of biodiversity – deep lakes that experience lots of sunlight tend to favour evolutionary diversification. Diversification is also more common for species that have had a lot of evolutionary time in which to diverge and that experience high levels of sexual selection. Interestingly, although lake depth is important, the total size of the lake does not appear to be so important for diversification. A large geographical area to diversify into may influence the duration of adaptive radiations, however, with river-dwelling species showing more consistent species-production through time. This data suggests that adaptive radiations may be, to some extent, predictable, however much previous work has focussed on key model groups such as the Cichlid fish, and these hypotheses need to be generalised to other species and locations.

Molecular Phylogeny of Claroteine Catfish,
showing independent colonisation of
Chrysichthys brachynema

The authors sequenced nuclear and mitochondrial genes from 85 catfish covering 10 of the 15 species of Claroteine catfish, in order to construct an evolutionary tree for the sub-family. Estimates of the relationships between species and the evolutionary timescales of colonisation and divergence allowed the authors to distinguish between the possibilities of single or multiple colonisation events, and the processes driving diversification. The results indicated that most Claroteine catfish in Lake Tangayika originate from a single colonisation of the lake between 5 and 10 million years ago, followed by evolutionary radiations to produce the variety of species present today. One species, Chrysichthys brachynema was the exception to this rule, having independently colonised the lake around 1 – 2 million years ago. This species has not shown adaptive radiation since colonisation, probably because of the relatively short time it has been present in the lake. These results support previous work that has suggested that time is an important factor in producing highly diverse species assemblages.

Original Article:

() Molecular Phylogenetics and Evolution

nerc-logo-115

This research was made possible by funding from the Natural Environment Research Council (NERC), the National Council for Scientific and Technological Development (CNPQ), the National Geographic Society, and the Percy Sladen Memorial Trust Fund.

Sex Differentiation Begins During Early Development

By Claire Asher, on 27 August 2014

Males and females look different from each other, and these sexual dimorphisms are the result, largely, of sex differences in the expression of certain genes. Typically, scientists have studied sexual dimorphism in sexually mature adult animals, as this is the lifestage where differences are most apparent. However, many sex-specific phenotypes arise from sex-biased development, so sex-biased gene expression should be expected to begin during development. Recent research from GEE reveals complex patterns of sex- and stage-dependent gene expression, resulting from differing evolutionary pressures on difference sexes. In fact, sex-biased gene expression is actually most evident during early development.

Although there are some genetic differences between males and females, found on the sex chromosomes (Y in mammals, W in Birds), these contribute relatively little to the physical and behavioural differences between the sexes. Further, some animals (such as many reptiles) don’t possess a sex chromosome at all, instead determining sex based on environmental factors such as temperature. Scientists therefore believe that the majority of sexually dimorphic characteristics are generated from differences in the expression patterns of a shared set of genes, and there is now plenty of evidence for this in a variety of different species. In fact, sexual phenotypes appear to exist along a continuum, with some individuals in certain species exhibiting intermediate traits (e.g. subordinate male Turkeys).

The fruit fly,
Drosophila melanogaster

In most species, sex differences are less apparent during development and appear or become more pronounced at the onset of sexual maturity. This makes sense, since that’s generally when the sex-specific traits are useful. Nevertheless, the groundwork for producing these traits in adulthood must be laid during development, so we might expect to see sex-biased gene expression in juveniles as well. A recent paper by GEE academics Professor Judith Mank and Dr Peter Harrison, and Dr Jennifer Perry (University of Oxford) investigated gene expression patterns during larval development in the fruit fly, Drosophila melanogaster.

Juveniles Show Sex-Biased Gene Expression

The authors compared gene expression patterns in pre-gonad tissue in larvae and pre-pupae with gonad tissue in adult flies. Using transcriptome sequencing, which sequences all expressed genes, they were able to detect differences in gene expression between sexes at different developmental stages. By using a single tissue, the authors hoped to gain a clearer picture of gene expression in relation to sex and development, as tissue-specific gene expression can cloud the picture. Gonad and pre-gonad tissue was the obvious candidate, since this tissue forms sperm and eggs and is therefore likely to be under strong selection for sex-biased gene expression.

Despite the long-running assumption that sex-biased gene expression should not be prevalent in juveniles, the results of this study indicated that most genes show sex-bias in at least one pre-adult stage! Over 50% of genes showed at least 2-fold differences in gene expression between the sexes during larval or pre-pupae developmental stages. Sex was still the most important factor, however, with individuals within a sex showing greater similarity in gene expression patterns than individuals within a developmental stage.

. Venn diagrams of the number and percentage of genes showing sex-biased gene expression in larvae, pre-pupae, and adults. Image from open access article.

Venn diagrams of the number and percentage of genes showing sex-biased gene expression in larvae, pre-pupae, and adults. Image from open access article.

Continuity and Sex Differences

The majority of sex-biased genes showed expression patterns that remained consistent throughout development, however a significant minority (~25%) of genes showed varying sex-bias according to developmental stage. For example, a gene that showed lower expression in females during the larval stage might then show higher expression in females during adulthood.

In the majority of previous studies have found that more genes show male-bias in adults. By contrast, this study showed that in larval and pre-pupal stages of development in Drosophila melanogaster, more genes show female-biased gene expression. Females were also more likely to show stage-dependent sex-biases in gene expression. The exception to this was genes showing very extreme sex-bias, which tended to be male-biased. This is consistent with the finding that the overall magnitude of gene expression differences tended to be higher in male-biased genes.

The Rate and Form of Evolution

The authors then investigated the evolutionary dynamics that lead to these patterns of gene expression. Genes showing the most rapid recent evolution were those that showed male-biased expression continously throughout life, and those that showed female-biased expression in the larval stages. The evolutionary pressures in male- and female-biased genes were different for each sex. For female-biased genes expressed in larvae, rapid evolution was the result of a relaxation of purifying selection for stage-dependent genes (natural selection that removes harmful mutations), whereas rapid evolution in consistently male-biased genes was a result of stronger purifying selection on stage-dependent genes.

This study reveals complex and intricate relationships between sex, age, development and gene expression in the fruit fly, Drosophila melanogaster. Despite minimal visible differences between the sexes during larval and pre-pupal development, there were vast differences in terms of gene expression. Although this is contrary to previous assumptions about the nature of sex-biased gene expression, it is consistent with the fact that many sexually dimorphic traits exhibited by adults must by necessity begin to develop before adulthood. It is therefore not surprising that sex-biased gene expression is evident in juveniles, however the extent of this bias is quite a surprise. More research is needed to understand the evolutionary dynamics shaping development- and sex-specific gene expression, and how these patterns vary across different tissue types.

Original Article:

() The Ontogeny and Evolution of Sex-Biased Gene Expression in Drosophila melanogaster Molecular Biology and Evolution

Further Reading:

ERC

This research was made possible by funding from the European Research Council (ERC), the Elizabeth Hannah Jenkinson Fund and the John Fell Oxford University Press Research Fund

Extinction and Species Declines:
Defaunation in the Anthropocene

By Claire Asher, on 18 August 2014

We are in the grips of a mass extinction. There have been mass extinctions throughout evolutionary history, what makes this one different is that we’re the ones causing it. A recent review paper from GEE’s Dr Ben Collen discusses the current loss of biodiversity and suggests that our main concerns are species and population declines, which alter ecosystem dynamics and threaten our food, water and health. Understanding the drivers of local declines is more complex than understanding species extinction, but may be more pertinent to our ongoing health and survival.

The history of life on Earth has been punctuated by five mass-extinction events; from the Ordovician-Silurian extinction that killed 85% of sea life 443 million years ago, to the famous Cretaceous-Tertiary extinction that wiped out the dinosaurs 65 million years ago, mass extinctions have been a part of life. However, we are now in the middle of the sixth mass extinction event, and we’re the ones who are causing it. The last 500 years has seen humans cause a wave of extinctions of such speed and magnitude that it rivals the big five extinction events of the past.

Defaunation in the Anthropocene

Like other mass extinctions, the Anthropocene extinction event is affecting all taxonomic groups, although some are being hit harder than others. Since 1500, over 300 terrestrial vertebrates, 90 fish and nearly 400 are known to have been driven to extinction (although the real figures are likely much higher!). A conservative estimate suggests that we may be losing anywhere between 10,000 and 60,000 species each year. Many of these species go extinct before we ever even get a chance to identify them. Extinction is not evenly distributed, though – amphibians appear to be worse affected than birds, for example. Perhaps more worrying, many remaining species are suffering severe population declines. Globally, terrestrial vertebrate populations show declines of 25%, and 67% of monitored invertebrate populations are declining by 45%! The loss of species from ecosystems, either through local population declines or species extinction, will undoubtedly disrupt ecosystem function and the key ecosystem services humans rely on for survival and well being.

Scientists have coined the term ‘defaunation’ to include the extinction of species and populations as well as local declines in abundance. Defaunation can be thought of as deforestation for animals. It is an important point to make that although species extinctions are conspicuous and striking, the real damage to ecosystem function happens a long time before the final extinction event. Declines in populations will alter community composition far more than the final loss of the few remaining individuals of a population, and further, population declines have the potential to be reversed, if we act quickly enough!

Predicting Patterns of Defaunation

If we are to halt or even slow the current mass extinction, we need to identify both the causes of defaunation and the traits that make certain species so vulnerable to human disruption. The main drivers of defaunation are overexploitation of species, habitat destruction and introduced invasive species. These threats have all increased in severity over the past decade and look set to continue. In addition to these long-term threats, climate change is rapidly becoming the biggest threat to biodiversity. Most threatened species are under pressure from multiple human threats, but our understanding of the complex interactions and feedback loops between different threats is still in it’s infancy. It’s clear though that these threats do not act in isolation; a species trying to track suitable habitat as it moves with climate change will find that task much harder if habitat loss and fragmentation is also occurring.

Researchers have highlighted a number of life history and biological traits that tend to make species more vulnerable to human impacts. For example, species that have a small geographic range, large body size and produce just a few offspring after a long-development process, are more likely to be threatened with extinction due to human activities. However, our understanding of the traits that influence species’ extinction risk doesn’t help conservation as much as you might expect, because the relationship between these traits and extinction risk is often idiosyncratic and highly context-dependent. These relationships may also be more variable and weaker for individual populations than for whole species, making population declines more difficult to predict than whole-species extinctions. Defaunation, ultimately, is a synergistic function of the traits a species possess and the nature of the threat(s) it is exposed to.

Disrupting Ecosystems and Communities

The loss of biodiversity through defaunation is not just a concern because of the aesthetic appeal of an individual species, or of a world rich in diversity in general. It is also a major concern because defaunation will likely have a negative impact on the ecosystem goods and services upon which we rely upon for our wellbeing and survival. In fact, biodiversity loss is thought to be comparable to other threats such as pollution in terms of it’s impact on ecosystem function. Defaunation can be expected to have a negative impact on our food, water and health, as well as our psychological wellbeing.

Food

Insect pollination is required for the continued production of 75% of the World’s crops, and is responsible for 10% of the economic value of the entire World’s food supply. Declines in pollinators are now a major problem, particularly in Northern Europe and the USA, and have been linked to declines in insect-pollinated plants. Biodiversity, particularly of small vertebrates, is provides crucial pest control services, valued at around $4.5 billion a year in the USA alone. Declines in small vertebrate populations are linked to cascading changes in the whole ecosystem which allow increases in pest abundance and, consequently, a loss of plant biomass. If the plant in question is a crop or food source, the results can be catastrophic.

Nurtient Cycling and Decomposition

Invertebrates are also very important for their roles in decomposition and nutrient cycling. Defaunation can reduce these important services, and cause changes in the patterns of nutrient cycling that can have knock-on effects on a huge variety of ecosystems. Likewise, large vertebrates that roam large home ranges are important in connecting ecosystems and transferring energy between them, and yet these species are often the most severely impacted by human activities.

Water

Another key ecosystem service is the provision of clean, fresh water. Research has shown that declines in amphibian populations can result in increases in algae, reduced nitrogen uptake and changes to oxygen availability in the water. This too will likely have major knock-on effects for other species (including ourselves!).

Health and Medicine

Finally, we can expect defaunation to negatively affect our health. Species that are more robust to human disturbance are often also better at carrying and transmitting zoonotic diseases (diseases that are carried by animals and transferred to humans), and altering ecosystem dynamics can change behaviours that influence transmission rates. Defaunation is likely to also reduce the availability of pharmaceutical compounds and alter the dynamics of disease regulation. All of this may mean that defaunation leads to an increase disease and a reduction in the availability of therapeutic compounds.

The impact of defaunation is less about the absolute loss of biodiversity and more about the local shifts in species composition and functional groups, which alter ecosystem function and ultimately, our food, water and health. However, reductions in species exploitation and land-use change are two feasible actions that can be achieved rapidly and may buy us enough time to address other drivers of defaunation such as climate change. Globally, we need to reduce and more evenly distribute our consumption if we are to change current trends in defaunation, and open the possibility for refaunation.

Original Article:

() Science

nerc-logo-115JNCCLogo
NSF

This research was made possible by funding from the Natural Environment Research Council (NERC), the National Council for Scientific and Technological Development (CNPQ), the Foundation for the Development of UNESP, the Sao Paolo Research Foundation, the Joint Nature Conservation Committee (JNCC), the National Science Foundation (NSF) and the National Autonomous University of Mexico/a>.

Evolving Endemism in East Africa’s Sky Islands

By Claire Asher, on 8 August 2014

The World’s biodiversity is not evenly distributed. Some regions are hot spots for species richness, and biologists have been trying better to understand why these regions are special and what drives evolution and diversification. A recent paper by GEE’s Dr Julia Day and recent PhD graduate Dr Siobhan Cox, investigated the diversification of White-Eye Birds in East Africa’s Afromontane Biodiversity hotspot. Their results indicate that speciation in these birds has likely been driven by adaptation to a gradient of environmental conditions.

The East Afromontane Biodiversity Hotspot (EABH) is one of the most biodiverse regions on Earth, but it is under constant threat from increasing urbanisation in the area, which is predicted to continue over coming decades. It is therefore crucial to quantify what biodiversity is found in this hotspot, and understand the evolutionary processes that have made it a hotspot. The geography in this region is quite special, and is thought to have been a key factor driving high levels of species richness here. The Afromontane region is formed of a chain of ancient massifs (mountains created by faults and flexures in the Earth’s crust) and relatively young volcanoes. The low-lying regions between these peaks are covered in arid savannah, but montane forests appear on the peaks above about 800m. These forests exists as “ecological islands”, isolated from each other since the early Oligocene around 33 million years ago. Before this, conditions in the region were less arid and continuous forests covered the mountains and the valleys. As the forests retracted and fragmented, their inhabitants became isolated from one another, and this may have led to the emergence of new species, unique to each isolated montane fragment.

A Brief Introduction to Speciation
The processes by which new species arise depend upon the circumstances. Traditionally, speciation was thought to occur as a result of geographic separation of populations of a single ‘parent’ species. Once isolated and unable to interbreed, the two populations would slowly diverge from each other both due to random genetic change and adaptation to differing conditions. If enough time passed before the two populations came into contact with each other again, then they would eventually be so distinct that they were unable to interbreed even if they were reunited, and therefore should be classified as separate species. This is the standard model of speciation, known as allopatric speciation. It is now appreciated that new species can arise even without geographical isolation in a process known as sympatric speciation, often this can be caused by isolation of other kinds, such as behavioural isolation or through selective mate choice. It is generally accepted, however, that speciation requires, at least, a massive reduction in the rates of interbreeding between two populations or subspecies. Interbreeding will tend to restrain divergence as it mixes genes between the populations.

Evolving Endemism
There are two main hypotheses for how the extraordinarily high levels of endemism arose on the montane forest ‘islands’:

  1. The Montane Speciation Model suggests that montane ‘islands’ became refugia for species as they tracked suitable conditions up the mountain. This idea is based on a general theory for speciation and divergence known as ‘niche conservatism’, which suggests that geographical isolation of populations is driven by an inability to adapt to changing conditions. Once isolated, populations begin to diverge from one-another and over time this generates very high species richness.
  2. The Gradient Speciation Model by contrast, hypotheses that new species emerge as a result of adaptation to different conditions along a gradient. In this model, adaptation and niche divergence drive speciation, and we expect to find related species living in adjacent habitats.

The EABH is home to over 1300 described species of bird, of which 110 are known to exist nowhere else on Earth. In a recent paper in Molecular Ecology, Dr Day, along with colleagues at the Natural History Museum (Tring, Hertfordshire), the Technical University of Munich and the National Museums of Kenya, investigated the pattern of divergence in African montane white-eyes (Zosterops), a group of small, gregarious birds. Each montane forest fragment houses a single, endemic species, while other species live on real islands, and others live in other habitats on the mainland. This makes them an ideal group to test the competing hypotheses of niche conservatism and niche divergence.

The authors collected mitochondrial and genomic DNA samples for 148 birds from 15 species found across the EABH and elsewhere. They estimated the evolutionary timing of each species’ divergence based on both geological and molecular data, to investigate whether the montane taxa speciated in their current habitat or elsewhere, and whether they speciated before or after the climatic changes that isolated forest fragments.

A Late Pleistocene Colonisation
Based on molecular data, the authors estimate that White-eyes colonised Africa in the late Pleistocene, around 1.55 million years ago, and then exhibited brief pulses of diversification from 0.9 million years ago until around 0.3 million years ago. The genus Zosterops therefore colonised the region long after the montane forest habitat had fragmented into ecological islands, discounting the montane speciation hypothesis. Montane species diverged from their lowland sisters around 1 million years ago, during the last major wet phase. In some cases, montane species were found to be older than species found in neighbouring lowland areas, indicating colonisation in the other direction. They found no evidence that diversification of the White-eyes corresponded with volcanic activity in the region, which has previously been suggested.

They found that many of the so-called ‘species’ of Zosterops in fact include multiple sub-species, and they found strong support for already identified subspecies. This suggests that different species and subspecies independently colonised the montane habitat, and have remained more or less the same since. That the lowland savannahs that exist between the montane islands is a strong barrier that isolates montane populations is strongly supported by their results – species on neighbouring sky islands are very different from each other genetically, indicating they have not interbred for a great deal of evolutionary time. This is similar to the pattern of colonisation and diversification seen in White-eye species that live on real islands, which likely present similar evolutionary pressures to the ecological islands found in fragmented habitats.

Overall, their results support a niche divergence explanation of speciation in Montane White-Eyes, consistent with the gradient hypothesis, and ruling out niche conservatism models, such as the montane speciation hypothesis. However, the authors point out that their results do not distinguish between the gradient hypothesis and similar alternative, the vanishing refugia model, which suggests that speciation occurs through adaptation to less favourable habitats as suitable habitat contracts and refugia become unable to maintain viable populations. Further research is needed to conclusively distinguish between these models. The relative climatic stability of the highland montane habitats, couples with frequent climatic fluctuations in low-land areas may have played a key role in diversification in White-eyes, and may be a key driver of endemism in this region.

Original Article:

nerc-logo-115

This research was made possible by funding from the Natural Environment Research Council (NERC).

Predicting Extinction Risk:
The Importance of Life History and Demography

By Claire Asher, on 28 July 2014

The changing climate is no longer simply a concern for the future, it is a reality. Understanding how the biodiversity that we share our planet with will respond to climate change is a key step in developing long-term strategies to conserve it. Recent research by UCL CBER’s Dr Richard Pearson identifies the key characteristics that are likely to influence extinction risk due to climate change, and shows that existing conservation indicators such as the IUCN red list may contain the data necessary to make these predictions.

Human activities have been negatively impacting biodiversity for centuries, and conservationists have developed a number of different indicator lists which attempt to classify species’ extinction risk. However, these lists were created to measure human impacts such as as habitat loss, hunting and introduction of invasive species. These impacts will continue to be a major issue for biodiversity, but may be dwarfed in the future as climate change takes hold. Can the indices and data we already have be used to predict extinction risk from climate change? Or does climate change represent a new type of threat, needing new indices?

Studies have previously identified the ecological and biological traits that are characteristic of threatened or declining species. However, it is not clear how well these traits predict the future risk of climate-induced extinction. In February this year, GEE’s Dr Richard Pearson, in collaboration with colleagues at the American Museum of Natural History, Stony Brook University and the University of Adelaide, published a paper in Nature which attempted to address these questions. Most studies that have considered the impact of climate change on species’ extinctions have attempted to predict changes in the distribution of suitable habitats and measure extinction risk in terms of whether the species is likely to be able to find habitat to live in. However, such studies rarely consider how a species’ traits such as life history and spatial characteristics will influence their ability to persist through changes in climate. In this study, Pearson and colleagues coupled ecological niche models with demographic models, and developed a generic life history method to estimate extinction risk over the coming century.

Modelling Extinction
The authors then tested their models on ecological and spatial traits for 36 reptile and amphibian species in the USA. Using commonly available life history variables, they found that their models could accurately predict extinction risk between 2000 and 2010. They then utilised the same traits and models to predict future extinction risk under two climate models – a high emissions scenario and a policy scenario aimed at curbing emissions. Average extinction risk for the 36 species studied was 28% under the high emissions scenario, dropping to 23% under strict policy intervention. This seems like a very small difference for a significant intervention – it’s important to note that the same estimates indicated an average extinction risk of just 1% in the absence of any climate change at all.

One of the most important determinants of extinction risk in reptiles and amphibians was occupied area, which represents the range of climatic and habitat conditions the species can survive in. Species with a larger occupied area tended to be more robust to climate change, presumably because they are already adapted to a wider range of habitats and climates. Other key variables influencing extinction risk include population size and generation length. In many cases, traits interacted to determine species risk, for example extinction risk was strongly influenced by interactions between occupied area and generation length. Including many different traits can therefore greatly improve the accuracy of predictions. Recent trends tended to be less informative than spatial, demographic and life history traits, particularly under the high emissions scenario, suggesting that the impacts of climate change we have observed so far are likely to become less and less relevant as climate change accelerates.

The majority of variables that showed a significant impact on extinction risk are already included in major conservation assessments and indices, meaning that data and monitoring programs already in place may be better at predicting extinction risk under climate change than we might have expected. Climate change may not be fundamentally different from other human threats such as habitat loss and hunting, at least in terms of our ability to assess extinction risk. Conservation initiatives should focus on species who currently occupy a small and declining area and have a small population size. Regardless of the policy future, conservation actions will need to consider and account for climate change if they are to prove effective.

Original Article:

() Life History and Spatial Traits Predict Extinction Risk Due to Climate Change Nature

Nasa-logoARC

This research was made possible by funding from the National Aeronautics and Space Administration (NASA) and the Australian Research Council

It Pays to Be Different:
Evolutionary Distinctiveness and Conservation Priorities

By Claire Asher, on 15 July 2014

The world is currently experiencing an extinction crisis. A mass extinction on a scale not seen since the dinosaurs. While conservationists work tirelessly to try and protect the World’s biodiversity, it will not be possible to save everything, and it is important to focus conservation efforts intelligently. Evolutionary distinctiveness is a measure of how isolated a species is on it’s family tree – how long ago it split off from its nearest living relative. A recent paper co-authored by UCL GEE’s Dr David Redding, published in Current Biology, assessed how effective evolutionary distinctiveness is a tool for identifying bird species of conservation priority. Current conservation efforts are missing some of the most evolutionarily distinct species.

Evolutionary distinctiveness (ED) is measured as the distance along the evolutionary tree from one species to it’s nearest relative. It can be used as a measure of how much evolutionary ‘information’ would be lost if this species were to become extinct. We have good estimates of these distances for birds as we have been able to put dates on the evolutionary tree based on fossil records and molecular data. A recent analysis of nearly 10,000 known bird species, by researchers at Yale University, Imperial College London, University of Sheffield, Simon Fraser University, University of Tasmania and University College London, showed some patterns we might have expected, for example, evolutionary distinctiveness is highest in isolated regions (e.g. Australia, New Zealand and Madagascar) and regions with higher species richness tended to have more evolutionary distinct birds. However, there were also some unexpected results. For example, ED wasn’t strongly related to latitude, a pattern predicted by the idea that the tropics act as a ‘museum’ for ancient lineages, nor was ED related to a species’ range-size, which has previously been predicted theoretically.

Evolutionary distinctiveness showed little relationship with conservation status – some of the most threatened distinct species are found outside of biodiverse regions that are usually the target of conservation efforts. This means that, when we consider only species richness or total biodiversity to identify regions to conserve, we may be missing a great deal of evolutionary information. Instead, basing areas of conservation priority on the evolutionary distinctiveness of their flora and fauna may offer a more efficient and effective way to maximise the evolutionary variation we keep.

The paper also released the first formal list of ‘EDGE birds’ – EDGE stands for “Evolutionary Distinctive and Globally Endangered” and is a metric combining ED with the IUCN Red List. The list includes the Giant Ibis, the New Caledonian Owlet-Nightjar, the California Condor, the Kakapo, the Philippine Eagle, the Christmas Island Frigatebird and the Kagu, all of which are listed as either Critically Endangered or Endangered.

The most evolutionary distinct birds include both common species and rare species, both isolated and wildly distributed species, and are found in almost every environment on Earth. Current conservation efforts that focus on tropical regions with high species richness may be neglecting many evolutionary distinct species, whose extinction would represent the loss of a great deal of ‘evolutionary information’. Evolutionary distinctiveness could offer a powerful tool to supplement current criteria for identifying conservation priorities.

Original Article:

() Current Biology

nerc-logo-115nsf1nserc_logo_eNasa-logo

This research was made possible by funding from the Natural Environment Research Council (NERC), the Natural Sciences and Engineering Research Council (NSERC), the National Science Foundation, and the National Aeronautics and Space Administration (NASA)