Energy Analysis with Google’s Public Data Explorer
By Seyed Mohammad Mehdi Mohaghegh Ahmadabadi, on 4 March 2013
Some weeks ago, I was surfing the Internet when I suddenly came across Google’s Public Data Explorer. At first glance, it looked like a simple data set, but I found it to be very interesting and spent over two hours just playing with the facts and figures! This is a public platform that demonstrates the public data and forecasts from a range of international organizations and academic institutions, which include OECD, World Bank, etc.
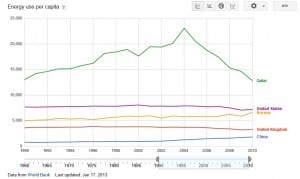
There are different types of indicators including economic and financial sectors, environment, infrastructure, and social development. Users can interactively select from these categories. Also, these indicators can be compared for different regions or countries. Because of my own interest, I selected Energy Use Per Capita, which means the primary energy use before transformation to other end-use fuels in kilograms of oil equivalent per capita. Then I compared several countries using this indicator. I chose China because of its high rate of economic growth during recent years and I placed Qatar and Norway on the graph since they are among the top fossil fuel exporters. I selected the United Kingdom because I currently reside there and, finally, I chose the United States because I have heard that energy efficiency is defined differently over there! Also, I set the years 1990-2010 for the time period. The picture below shows the energy consumption per capita among these countries:
As we can see, the energy consumption in China has doubled during 8-10 years. Also the energy consumption in the United States and the United Kingdom has decreased since 2008. This can be due to the financial recession or optimistically viewed as a result of energy efficiency measures!
The biggest surprise for me was the energy consumption in Qatar, which is 300 % more than for the United Kingdom. At first glance, it seems that the reason for this could be the high demand for cooling in Qatar during the summer or for seawater desalination. In relation to the high demand for cooling in Qatar, there is a high demand for heating in the United Kingdom. So, I think air conditioning cannot be the main cause of this huge increase in energy usage. I personally believe this requires socio-economic research to investigate the reasons causing this difference.
Also, to have a rough idea about the energy efficiency in these countries, I selected carbon emissions per capita as an indicator. The graph below shows the results:
We can see that CO2 emissions follow the same pattern as energy consumption in these countries.
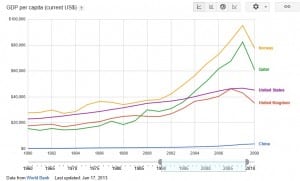
Afterwards, I thought that it would be interesting to compare the GDP in the above-mentioned countries. It seems the share of manufacturing and services in GDP can be an important parameter. Among the experts, causal relationships between energy consumption and economic growth are controversial. In the below graph we can see the GDP comparisons in these countries.
In the above graph, the effect of the surge in oil prices can be easily seen in the GDP of Norway and Qatar. Also, the effect of the financial recession in 2008 is obvious. The only exception is China, which had a constant growth during the past years.
As I mentioned, the investigation of the energy demand on national levels requires a multi-criteria platform, which also considers the social and economic aspects.
Thanks to the Google’s Public Data Explorer, there is easy access to analyse these data. I am convinced that 20 years ago such an investigation would not have been possible without spending several months on the project! I suggest that everyone try it! It actually creates the graphs on demand!
2 Responses to “Energy Analysis with Google’s Public Data Explorer”
- 1
-
2
Ehsan Abbasi wrote on 2 April 2013:
Thank you very much, Mehdi. This has to be one of the best findings I’ve come across on the web, of late. Great of you to share it with us..
 Close
Close


I’m fascinated that you can do so much with Google’s Public Data Explorer – I never knew it existed until now!