 Close
Close

Digital Adventures in Vilnius
By rebecca.wilson, on 24 April 2024
Working in the Digital Skills Development team it is a pleasure to teach creative media sessions to students and staff at UCL, but how exciting to be able to share our sessions at Vilnius University in Lithuania.

Vilnius University campus Credit: Rebecca Wilson
I was invited to work with Dr Michelle Cannon, Lecturer in Digital Arts and Media in Education, UCL Institute of Education, to help plan and deliver agile film making, Soundscape creation, and stop motion animation workshops. We arrived late at night in Vilnius airport, our luggage full of iPads, stands, lights, art materials and our heads full of ideas.
Our colleagues in Vilnius University were Associate Professor Sandra Kairė, Director of the Institute of Educational Sciences and Gintė Žulytė, Education Co-ordinator of Meno Avilys (the Institute of Documentary Film Vilnius). Meno Avilys is a Lithuanian NGO, committed to promoting film and media cultures, and related educational programmes. We worked collaboratively to plan targeted workshops for their students. Our Vilnius colleagues audited the sessions with a view to further development for their new Media Education module for Erasmus students next year.
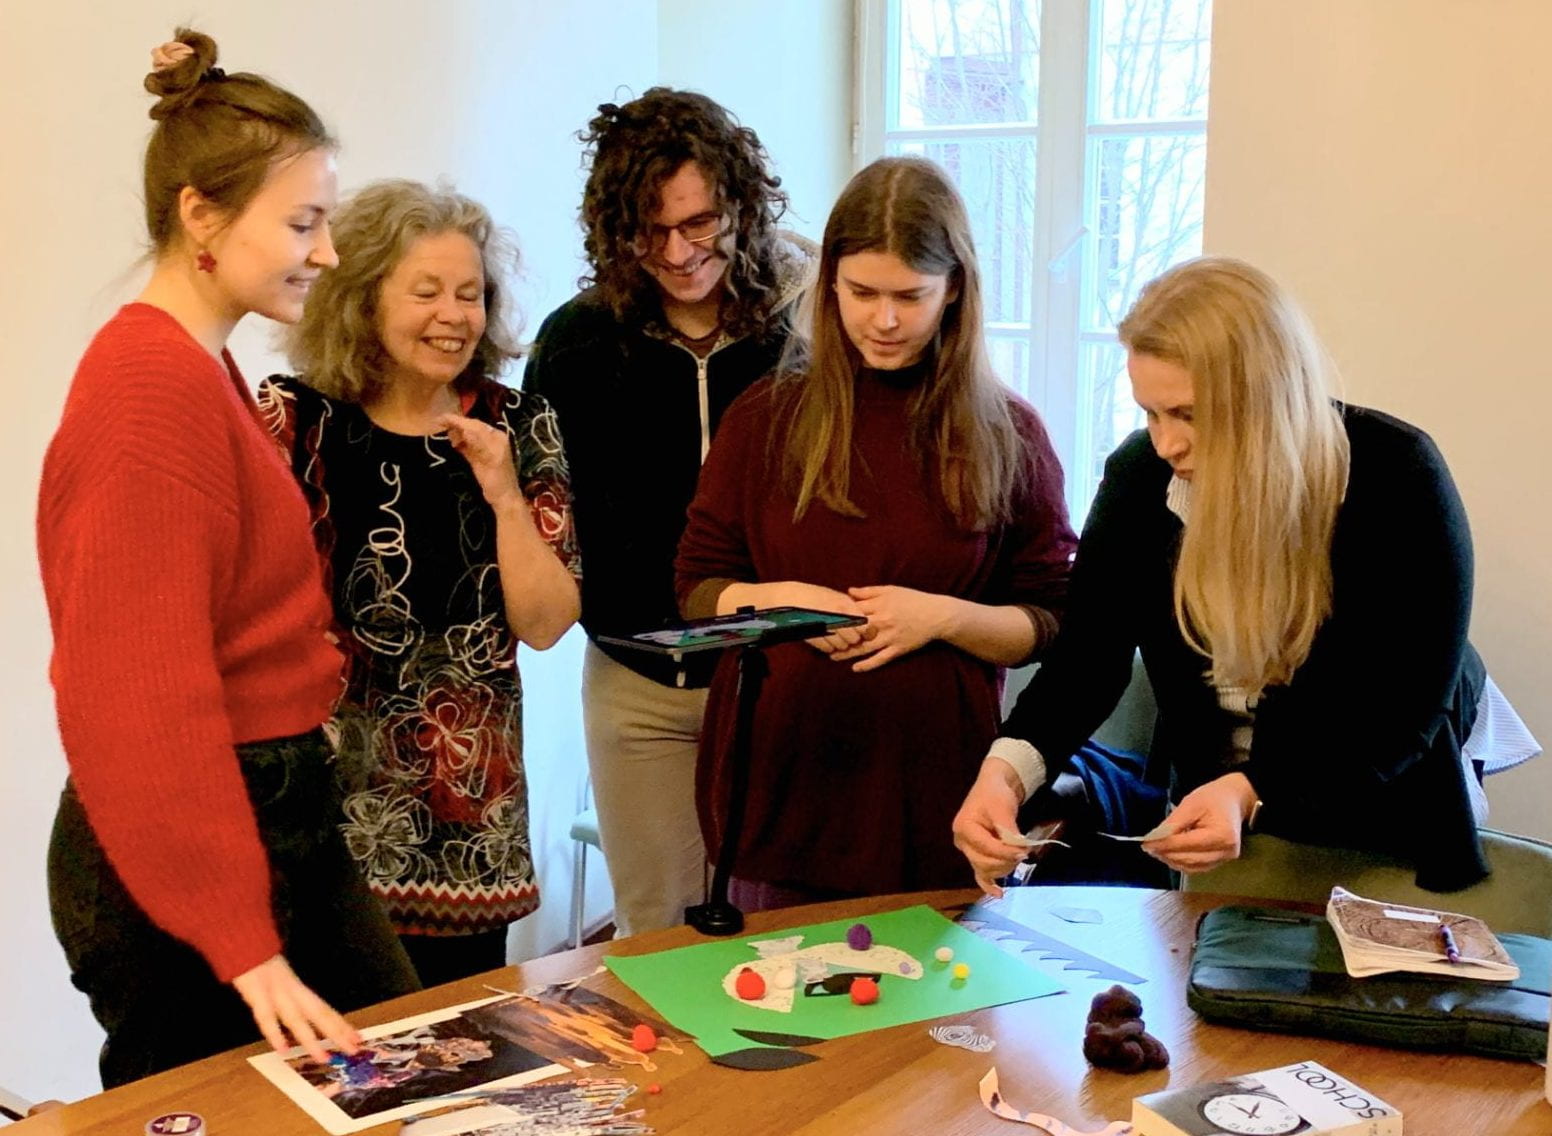
Animation workshop Credit: Michelle Cannon
The literary stimulus we chose was Shaun Tan’s graphic novel The Arrival. Reflecting first on a text as a stimulus roots the activity thematically and conceptually and provides a springboard for creative production. The student brief was to make a 30 second film using stills, video and sound to create a moving montage inspired by themes from the text such as dislocation, longing, loneliness and wonder.
English was no barrier to communication and students were gathered from a range of disciplines including Primary Education, Childhood Pedagogy and Psychology. None of the students were familiar with practical media-making as part of their university curriculum. It was both moving and inspiring to experience the students’ enthusiasm for creative digital making.

Film editing Credit: Rebecca Wilson
In a short space of time, students learnt film making techniques, how to edit and incorporate sound, and how to share and critique their work. They also learnt stop motion animation techniques; making a collage of artwork to create an animated abstract visual sequence. We also shared ideas and examples using ‘Audacity’ software to demonstrate mixing layers of sound to craft engaging Soundscapes.
We facilitated a whirlwind few days of creative making and it was a pleasure to work with such articulate, creative and enthusiastic students. Our visit was a great opportunity to collaborate internationally with like-minded academics and staff to promote creative Media Education and practice-based learning experiences.
Moodle Exam guard
By Eliot Hoving, on 19 April 2024
UCL Moodle has been updated with a new feature called Exam guard.
What is it?
Exam guard will prevent users from editing their course from 10 minutes before the start of a Moodle quiz until 10 minutes after the quiz has finished. Exam guard does this by looking at the “open the quiz”/ “close the quiz” setting when a Moodle quiz is created. The course editing freeze will only apply where the Moodle quiz is open for less than 5 hours as it is designed to target Moodle quizzes being used for controlled condition exams.
A banner will appear at the top of your course when Exam guard is in effect.

Why is this required?
In the past, when users have attempted to edit and save changes to a Moodle course while a quiz is underway, it has caused serious performance issues while Moodle tries to refresh caches and implement the changes. This issue is particularly bad where a large cohort (300+) are taking the quiz, and has caused exams to be disrupted.
What do I need to do?
Exam guard will work automatically and should have no impact on the majority of workflows. Staff can still post to forums, and mark submissions in other assignments. They can also add user overrides for late minute ECs and SORA students to a quiz.
Staff will not be able to edit course settings or create or edit activities in their course while the exam is running.
Staff will no longer be able to manually release a Moodle quiz by making the quiz visible at the exam start time. This workflow is not recommended or required. A better approach is for staff to set the Moodle “open the quiz” setting to the exam start date and time when creating the quiz. Students will see the quiz item on Moodle but aren’t able to access the questions or begin the quiz before the open date and time so there is no risk your exam is released early.
MyPortfolio and Moodle integration
By i.niculescu, on 15 April 2024
You can now set up and mark MyPortfolio assignments using Moodle! MyPortfolio is UCL’s e-portfolio system, which is now integrated with Moodle assignments. This allows tutors to create assessments where students submit portfolios or pages from their MyPortfolio accounts directly via Moodle Assignments.
Staff can:
- Set up MyPortfolio as a submission type in Moodle Assignments
- Mark MyPortfolio entries and leave feedback through Moodle
Students can:
- Submit a link to their MyPortfolio work via Moodle Assignments
- Get their marks and feedback through Moodle
Important information:
1. Re-submitting MyPortfolio pages or collections after making changes
- Tutors only get access to a copy of the portfolio via Moodle Assignments. This process ensures that changes made after the deadline are not reflected in the Moodle Assignment submission.
- Students must re-submit their portfolios after editing them, as they currently need to do with all other Moodle Assignments e.g. MS Word files.
2. Using MyPortfolio across a whole academic year and/or only for formative work
- Please encourage your students to share their MyPortfolio work through Mahara. In this way you will always be able to access the latest version of their work. Because the Moodle MyPortfolio integration creates a copy of a page or collection, you will not be able to see any updates unless students re-submit their work via Moodle every time they add something or make any changes.
- If you need to mark the portfolio at the end of the year, please set up an assignment using the MyPortfolio Mahara LTI only at the end of the course, once students have completed their work.
3. Step-by-step guides
- Staff guide: how to set up and mark a MyPortfolio assignment using Moodle Assignments
- Student guide: how to submit a MyPortfolio assignment using Moodle
- Staff and students: guidance for using MyPortfolio
- Please note that ‘MyPortfolio’ will appear as ‘Mahara’ in Moodle.
If you have any questions, please email digi-ed@ucl.ac.uk.
Important Notice: Moodle groups
By Kerry, on 12 April 2024
Groups with “Hidden” or “Only see own membership” visibility are designed by Moodle to be secure so as not to disclose sensitive information.
It recently came to our attention that as a result they cannot be used when filtering assignments for markers.
If you do require groups that are filterable for markers, you will need to create new groups with group visibility set to “visible” or “only visible to members” and avoid naming them anything that could disclose they are for SORA or another specific group of students. This is because students within such a group can see who else is a member.
Any questions, please contact digi-ed@ucl.ac.uk
Half the struggle with digital knowledge is knowing what it’s for
By Jim R Tyson, on 10 April 2024
Sometimes I hear an announcement about an update or improvement to some technology or ‘app’ (as the youngsters say) that sounds exciting and eminently worth investigating. When I start sifting through Google results to find out more, I can spend a day or two sometimes working out what’s going on. That’s OK, it’s part of my job to do this and then, if what I’ve learned is useful, to find ways to communicate it to other people.
For example, Excel now allows users to create ad hoc and custom functions using lambda(). Now, if you are a computer scientist, mathematician, philosopher or linguist, you will probably have heard of the lambda calculus, an important mathematical invention of the twentieth century that influenced all those disciplines. It provided a way to formally characterise computation as function application and abstraction (roughly, don’t quote me on this – it was a long time ago). Now, even students of computer science may sometimes encounter the calculus and end up wondering ‘OK, but what’s it for?’
Well, one way to demonsrate its practical use is by introducing the world of the lambda() function in Excel: it allows you to formally define new Excel functions. I immediately spotted some uses for this.
Descriptive statistics for sub-populations
Excel provides all the most common and useful statistical calculations as basic functions such as count(), average(), var(), stdev() and for some functions there are conditional versions countif(), averageif(),which allow for subsetting your data. So, it might be that you have two columns of data, the first is some interesting measure (temperature? height? resting bpm?) and the second some characteristic such as ethnicity or gender.
It might be that you want to know what is the average resting heart rate (for example) of the male participants in your study. You can do this using averageif(): =averageif(B1:B100, “male”, C1:C100). Assuming that the sex data are in the range B1:B100 and the resting heart rate data are in C1:100. In fact, Excel has an averageifs() to help with cases with multiple selection criteria. So that’s good for data analysts using Excel because it’s a common analytical approach.
However, this only works for averageif(), countif(), maxif(), minif() – there is no conditional var(), stdev(), skew() or kurt(). Well, for variance and standard deviation, we can construct a pivot table to get the subpopulation analysis we want and that’s great. But occasionally (probably not that often) we want to calculate the skew in resting heart rate for all male participants, and maybe even the kurtosis. And here, after that long lead in, is where the lambda() function proves it’s worth. First, lets look at how we would caculate the kurtosis in some measure as a function of gender, using a combination of built-in Excel formulas: Given a data table where column A is the categorical (eg gender) variable and B is the measure of interest:
| 1 | A | B |
| 2 | 1 | 56 |
| 3 | 1 | 62 |
| 4 | 1 | 48 |
| 5 | 1 | 58 |
| 6 | 1 | 58 |
| 7 | 1 | 55 |
| 8 | 1 | 42 |
| 9 | 1 | 54 |
| 10 | 1 | 47 |
| 11 | 2 | 52 |
| 12 | 2 | 59 |
| 13 | 2 | 56 |
| 14 | 2 | 45 |
| 15 | 2 | 63 |
| 16 | 2 | 52 |
| 17 | 2 | 44 |
The formula we want is kurt(if(A1:A17=1,B1:B17))
So there are three parameters, the first is the range to which we apply the second (the selection criterion value (here, 1 = male)), the third is the range where the kurt() function will be applied. I tested this formula and it works fine, it’s just a bit clunky to use compared to the built-in averageif() etc. So, I decided to reconstruct it using the lambda() function, to produce my own kurtif() function. In an empty cell, we put the lambda expression:
=LAMBDA(a,n,b, KURT(IF(a = n, b)))
with the three parameters represented (arbitrarily) by a, n and b. A moments reflection and we see the relation between the lambda expression and our previous Excel formula. From a practical point of view, the lambda expression tells us where in the calculation to plug in the values a, n and b to get our result.
When you enter this expression in a blank cell and hit return you will see the warning message
| #CALC! |
which is Excel recognising that the cell contains a lambda expression. The next step is to name the new function kurtif(). Copy the new lambda expression to the clipboard (highlight and control-c) then from the formula tab on the ribbon select and open the name manager. In the dialog that this opens press the new button; give kurtif as the name for the new function and then paste the lambda expression from the clipboard then OK and close the name manager dialog.
Now you can carry out the computation as:
=kurtif(A1:17,1,B1:B17)
which is simpler and has the advantage of looking very like averageif() and the other, similar functions.
A missing significance calculation in Excel
Excel has a very simple to use function that will calculate a correlation coefficient (R) from two arrays of data: =correl(Array1,Array2). It is a minor annoyance that this calculation doesn’t return a p value for R, allowing us to test the null hypothesis that the true correlation between Array1 and Array2 is zero. So, let’s assume that we have calculated r for two columns of data each and we know that n is just the count of one array, and the result is in cell H1 (for no particular reason).
Now, it’s a fairly simple trick to calculate a t value based on the correlation coefficient. The formula is
![]()
and since we have just calculated r, it is simple to calculate t with the formula (and put the result in H3):
=H1*(sqrt(count(Array1)-1))/sqrt(1*-H1^2)
The last (and for now separate) step is to find the significance for this t score with the two-tailed t distribution function with n-2 degrees of freedom
=t.dist.2t(H3, count(Array1)-2)
And there we have it. So, it would be useful to have a little helper function we could apply simply, to calculate t from r. Here is the lambda function code:
=LAMBDA(r,n,(r*SQRT(n-2))/SQRT(1-(r^2)))
and we can name it and use it as before. I named mine ‘convertRtoT’ and used it like this with the correlation coefficient in H1 and n = 30:
convertRtoT(H1,30)
So now we know what the lambda() function is for. The example is perhaps a little obscure, but the principle – that half the struggle with digital knowledge is knowing what it’s for – holds for far more mundane cases: I’ve been learning Power BI, and while there are simple answers – power BI is for visualisation – it’s only after I’ve been through a few hours of tutorials that I’m really understanding what it’s about.
Homework
If you want to check out the example calculations, please go ahead. I checked them all in Excel (and for the t to r conversion, I checked my result against R), but it’s always possible to make a bluder when copying and pasting. But finding and fixing errors is good practice. If you want more practice, then I would suggest creating a function skewif() that works like kurtif(), taking two arrays ( a score and a selection criterion) a gives the skewness for the cases selected by the criterion. Good luck.
(this blog post was supported by the music of Iannis Xenakis, “Six Chansons No 1, ca sent le musc”)
Up Up and Away! (guest post)
By Janina Dewitz, on 19 March 2024
The following is a guest post by Lucy Porte who is studying for an MSc in Health Informatics at UCL. In January, Lucy travelled all the way from Manchester to join us at #LearnHack in London. Here is her report:
Up Up and Away!
I had the best weekend recently at #LearnHack 7.0, sponsored by the UCL Centre for Engineering Education and hosted by the School of Management. A distance-learning student, I could not resist the temptation to do a research based hackathon from the centre of Canary Wharf and so headed down to London for the weekend. When we got to the 50th floor of One Canada Square, I knew my decision had payed off.

One Canada Square. Credit: Janina Dewitz
The themes this year were Generative AI and assessment and feedback, to tie into #LearnHack’s overall focus on innovation in a research and education setting. There were so many different parts of the event, from board game sessions to brainstorming workshops, pizza breaks to Brewdog pints, an evening seeing the winter lights display and even a competition to see who could make the best AI-generated artwork. This was all alongside the main activity, the creation of our #LearnHack artefacts, which we would get to present at the end of the three days.

Everyone having fun. Credit: Janina Dewitz
Having only attended one hackathon before and being fairly out of my depth, I was quite apprehensive about this element. Luckily there was a range of amazing project topics to choose from, including game design, UX design, qualitative research pipelines, a tool to perform automated marking and a tool to summarise biomedical research papers. I really struggled with choosing one of these, and spent a lot of the first two days discussing projects with people and gathering ideas for implementation. In the end I chose the last project because it tied into my studies in Health Informatics.

Protocol Optimiser. Credit: Amy Li
Amy, Jenny and myself soon got to work creating a prototype for our idea. Thanks to Amy’s extensive background work, we were quickly able to focus on our objectives and train a ChatGPT to extract method steps from biomedical papers according to a framework we had found online. Because of ChatGPT’s learning capacity we could iteratively improve the tool to create better results and even evaluate its own performance. We were all very surprised to be granted first prize, which included $1000 of AWS tokens and UCL Changemakers funding to continue the project!

The team! Credit: Janina Dewitz
We are going to be presenting a poster about our idea at the BCSWomen Lovelace Colloquium in April, and can’t wait to see what comes out of the Changemakers funding, but will be sure to feed back! I honestly didn’t realise I could get so much out of one weekend with the Digital Education team, and would encourage everyone to subscribe to the #LearnHack mailing list, so you can be first in line for next year!
Lucy Porte