X Close

Digital Education team blog

Home

Ideas and reflections from UCL's Digital Education team

Menu

Archive for the 'Learning analytics' Category

MyFeedback is now available to all UCL staff and students

By Jessica Gramp, on 17 October 2016

The MyFeedback dashboard is now available to all UCL students and staff.

MyFeedback is a new tool in UCL Moodle allowing students to view grades and feedback for any assessed work across all their Moodle courses, in one place. Personal Tutors can view the dashboard for each student to allow them to track progress and to help to inform discussions in personal tutorials.

Watch the video on how students can use the MyFeedback report:

The report helps students (supported by their personal tutors) to better understand the variety of feedback they receive, draw ties between different assessments and modules, and allow them to reflect on their feedback to see how they can improve in future assessments. It also allows module tutors and assessors and departmental administrators to see how their students are progressing within the modules they teach and support.

MyFeedback Feedback Comments tab

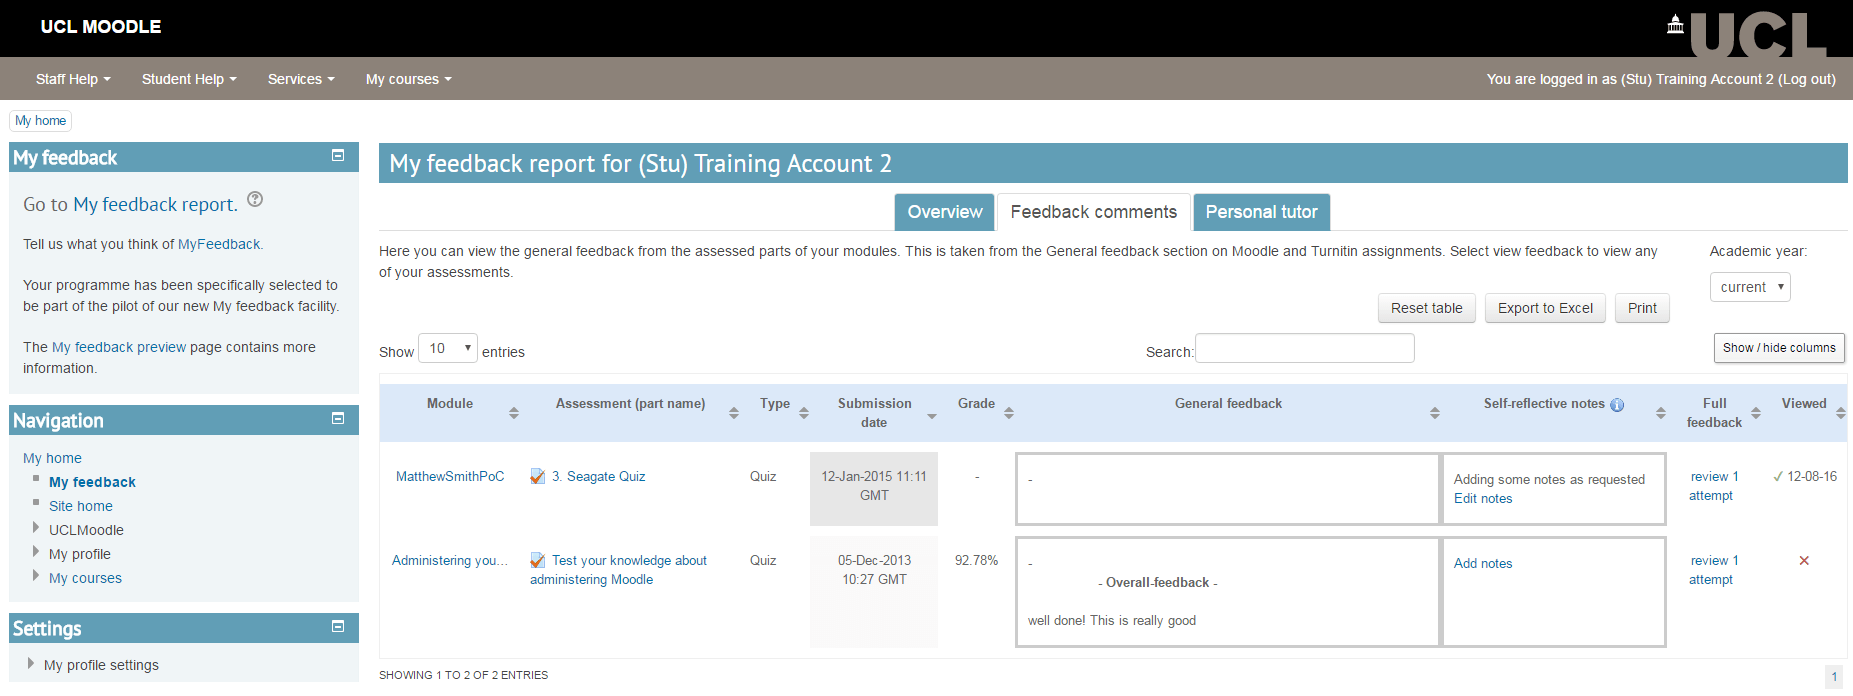
^ Click the image to view a larger version of the Feedback Comments page.

MyFeedback is available to students, personal tutors, course tutors and departmental administrators.

  • Students can view feedback and grades from their assessments across all their UCL Moodle course. They can also add self-reflective notes and copy & paste feedback from Turnitin into their report.
  • Personal tutors can see their tutees’ full MyFeedback reports across all the modules their students are studying. Note: personal tutors will not be able to link through to assessments on courses they do not have tutor access to.
  • Module tutors can see MyFeedback reports for their students containing assessment information for any modules they teach. They will not see any assessments for modules they do not teach (unless they have been granted tutor access to those Moodle courses).
  • Departmental administrators can see MyFeedback reports for all the Moodle courses within categories where they have been assigned departmental administrator access in Moodle. Categories in Moodle will either be for the entire  department, or might be broken down further into undergraduate and postgraduate modules. Staff requiring this access will need to ask their department’s current category level course administrator to assign them this role.

Sign up to the Arena Exchange MyFeedback workshop on 28th November 2016 to learn how to use this tool with your students.

You can navigate to your own MyFeedback reports via the MyFeedback block on the UCL Moodle home page.

Other institutions can download the plugin from Moodle.org.

Find out more about MyFeedback…


From Bricks to Clicks: the potential for learning analytics

By Steve Rowett, on 9 February 2016

I’ve blogged previously about the work that Jisc are doing in the field of learning analytics. Whilst there are some good case studies within the sector, informal conversations have indicated that most institutions are really only at the start of their analytics journey, or even simply keeping a watching brief on how the sector as a whole will act. Where institutions do have systems in place, they are often based on quite limited data sources (typically attendance data, VLE usage or library usage) rather than more holistic data sets covering a range of student experiences.

A comprehensive picture of the current state of play is provided by From Bricks to Clicks: the Potential of Data and Analytics in Higher Education, a Higher Education Commission report which summarises the field and provides recommendations to institutions. A small number of pioneering institutions (Nottingham Trent, Open, Edinburgh) feature heavily as case studies, but the general argument is that universities are generating significant amounts of data about learning but are not yet in a position to use this data to support student success.

At UCL, early discussions around the use of analytics have started. Our retention rates are generally good, but there is a feeling that students may leave their course due to social or economic factors – perhaps living in poor accommodation, feeling isolated, having financial difficulties or commuting into London. We think we might need quite a large dataset to model these parameters (if they can be modelled at all) although it is possible that attendance would be a good proxy for them. Certainly our journey into learning analytics is only just beginning.

Two and a half days into the future

By Clive Young, on 6 November 2015

Can you see the UCL logo in this video?

Like it or not, many of the trends, technologies and issues in learning technology often drift eastwards across the Atlantic, so it is useful to attend a US conference occasionally to hear the emerging debates.

EDUCAUSE is by far the biggest US conference of IT in education, last week attracting seven thousand IT, library and learning tech professionals to a very rainy Indianapolis. Popular topics were cybersecurity, the cloud, digital libraries, organisational change and generally managing an ever more disintegrated IT environment. Learning technologies were also well represented.

It is certainly not true that US universities are universally “ahead” of UK and European counterparts in educational IT. Many of the issues arising were depressingly/comfortingly familiar but in a few areas there were interesting differences, reminding me of the famous William Gibson quote, “the future is already here – it’s just not evenly distributed“.

A striking example was learning analytics, the monitoring of student performance, attendance and so on. In the UK collection of such data, the focus of a large Jisc project, is generally seen as benign. Some US universities however are much further down this path, trying to link performance to lecture attendance, library use, time spent in the VLE and so on. This data can be used to trigger interventions from tutors, but some questions had already arisen as to reductionism and even ethics of “profiling” students in this way. The fundamental question raised was who is this monitoring actually for; the student to improve study practices or the institution to reduce dropout statistics?

Not surprisingly several sessions attempted to identify key future trends. Number one was growing US student debt, commonly described as a “crisis”. One response may be a refocusing on competency-based education, short vocational for-credit courses from both new and traditional providers. Promoted as more affordable and career-friendly, credit accumulation enables flexible study paths (often online) and timeframes. The traditional three/four year residential degree was described as “over-engineered”, i.e. too long, too expensive, too unfocused, for increasing numbers of cost-sensitive, more consumer-minded students. The growth of “sub-degree education” and alternative HE-level providers is becoming more noticeable in the UK, too.

Whether this leads to the long-predicted decoupling of study paths and accreditation remains to be seen. In this new diverse environment universities, while still maintaining their elite status for the moment, were now “not the only game in town” and maybe not the automatic choice for a future generation of aspirational students.

Meanwhile on traditional US campuses the student demographic was subtly remixing. Students were on average older, more culturally diverse and ever more demanding of student services. Wellbeing and psychological support were becoming critical components of learning. Universities, we were told,  should take adult non-traditional learners far more seriously. I heard a frequent critique of the US trend of over-investing in glossy, expensive residential campuses at the expense of building a more agile, future-proofed and hybrid infrastructures. Distance education, it was claimed, would soon become the delivery norm in US higher education.

As mentioned above the pervasive connectivity of modern student life presents a major challenge to conventional IT services and roles as well as to academic colleagues who often struggle to accommodate the impact of technical changes, and often associated changes in discipline practices, into traditional programmes.

Maker culture” inspired by consumer-level 3D printers, coding schools and the “internet of things” should continue to impact across the curriculum, with libraries possibly playing a major role in providing maker spaces and opportunities for self-publishing. Optimists felt all this may produce the “next-generation workforce” ready for high-tech and distributed advanced manufacturing enterprises, where creativity and design will be as important as traditional attributes

It may be a bumpy ride, though. One EDUCAUSE keynote was MIT futurologist Andrew McAfee who predicted a rapid growth in machine intelligence as the effect of Moore’s law kicked in to mainstream computing. His thesis was that in many areas machines would soon be able to make better predictions and decisions than experts, and the market are already demanding that they do.

Postscript: If this futurology seems  a bit far-fetched back here in London, note a Guardian article this week; Robot doctors and lawyers? It’s a change we should embrace. But don’t worry, a recent BBC Tech article Will a robot take your job? reassured us that we Higher Education teaching professionals have only a 3% likelihood of automation!

Update on Jisc Learning Analytics

By Steve Rowett, on 23 October 2015

On Monday 19th November Steve Rowett attended the 4th Jisc Learning Analytics Network meeting in Bradford.  Jisc have been running their leaning analytics  R&D project for just over a year now and their plans are really starting to take shape. The aim is to provide a learning analyitics service for the HE/FE/skills sector that – at least at a basic level – institutions can take off the shelf and start using. There are also likely to be more sophisticated premium offerings from the vendors involved. The components of this solution are becoming well defined and I report on these below.

The architecture of their system looks quite complex, but focuses on different elements for storing, processing and displaying back data to various audiences. For many of the components they are working with multiple vendors to offer alternative options.

Already produced are a number of documents including a state of play review, literature review and code of practice – all available from http://analytics.jiscinvolve.org/wp/

Now, the technical systems are in development. Michael Webb from Jisc focused on systems for student and staff use rather than back end processing, and include:

The staff dashboard or ‘student insight tool’

This is currently 98% ready and due to be launched in November 2015. The tool has a simple purpose: to predict withdrawals and dropouts amongst the student cohort. The system is pre-programmed with 3 years of student data which it analyses to predict the metrics that increase probabilities of withdrawal. It then applies this model to current trends. 

The interface starts at programme level, and allows drill-down to modules and then to individual students giving a ‘withdrawal risk score’ for each. The types of data that that system can handle are:

  • enrolment and demographic data (essentially things the student can do nothing about): previous exam results, education history, school/college, demographic data
  • engagement (things the student can change): library/campus visit activity, books or journals used, VLE data, attendance data, student society membership, submission time before deadlines
  • academic performance (the outcomes): coursework and exam performance.

Current estimates are that the predictions are about 70% accurate although this will need to validated by early institutions and maybe improve as the models get further developed.

Alert and Intervention system (the ‘Student Success Planner’)

Currently 70% ready, expected to launch in Q1 2016. This system provides alert to nominated contacts (typically a student’s personal tutor or welfare officer) based on pre-determinted criteria. The alert is reviewed and any appropriate intervention can then be taken. It is expected that around 10 criteria would be sufficient for most cases. At the moment the focus is on intervening to support students in difficulty, but it could also be used to offer reward or praise mechanisms for behaviour likely to lead to successful outcomes. 

Learning records warehouse (‘Learning locker’)

Nearly complete, launch imminent. Back end system which stores learner activity in a simple but powerful form: X verb Y at time Z. For example ‘Paul visited library’ or ‘Irrum completed coursework’. This provides a the data used to build the models

Student app 

Currently still being designed. Borrowing concepts from fitness apps the student app provides feedback (“you are in the top 25%” etc.) and encouragement, allowing students to set targets and monitor progress (“I will complete 10 hours reading this week”). Also allows self-declared data such as demographics or even general happiness to be added.


The presentations from the event will shortly be on the Jisc Learning Analytics blog, and they have also developed some Moodle courses with more information – self register and find the LA-prefixed courses.

My thoughts were that Jisc is moving quickly here, and these products are really taking shape. However much of the day focused on the legal, cultural, ethical issues around learning analytics; the technical readiness of our institutions to integrate so many different data sources; and the (perhaps) high levels of variability in the types of models that would best predict outcomes in very different institutions. The technology looks fairly straightforward, but every institution that wishes to adopt these tools will need to choose their own focus and rules of engagement that works best for them and their students.

Update: Notes and presentations from this event are now available, along with a fuller description of other presentations and activities during the day.