If analytic data suggests there is a ‘heartbeat’ of online activity should this inform learning design?
Background
Planning for f2f teaching is largely led by institutional limitations and personal habits. Rooms are booked in 1-hour slots and sessions can only be so-many-hours long. As people can’t stand and talk for hours plus few would sit there and listen for the same period. There’s also only so much time in the day, especially ‘core working hours’. Time for education gets murkier when considering flexible learning, say clinicians who must be in practice between certain times or evening-study students.

Chrono-based design is as old as time itself
In all walks of education, from homework to dissertations, teachers set activities to be completed in student’s own time. Time planning for f2f education is often based on teaching time, set in rooms, schedules, people, slots. Time for learning has to fit into this schedule and is otherwise completed out of these normal hours. Students are expected to complete a substantial amount of personal learning hours – often tied to readings or assessment activities.
Programmes at higher education institutions are increasingly moving into online environments, many of which are still taught in traditional ways. There remains a large focus on face to face teaching and learning activities such as lecture, seminar, lab & essay led teaching. An increasing number are using online learning environments to provide some supportive or supplementary educational value. Some are ‘blended learning’ where elements of the course must be completed online by the learners. Contact time is altered where some is face to face and an amount is also online. A smaller number are fully online, where the online environment is driving the course, delivering a structured programme of study via resources and activities.
Building for these environments is often a process which involves a significant amount of investment for the teachers and learners.
Teachers
- Often going alone, designing what works best for their teaching style, their students and making best use of their knowledge of the available tools .
- Sometimes they may ask for support or advice on best practices, examples, tips and tricks and other approaches improve their original ideas.
- Some invest additional resource to make larger changes.
- Courses will always be refreshed over the years, often this comes with a partnership of moving more content online and reworking the existing online content to improve it.
Learners
- Need to adapt to different approaches of teaching. One part of their course may be very traditional, others may be more online.
- Method of delivery may influence enrolment decisions.
- Work/life/study balance & looking for flexibility built into courses.
- Increasingly using online environments in their daily life.
- There’s a digital divide between some individuals, some generations and their digital literacies.
Through the techtonic [sic] shifts in education the definition of ‘how people learn’ and ‘good teaching’ remains quite similar to that of 50 or 2000 years ago, and yet still quite hard to define. Many have tried, such as Bloom, Dewey, Paiget, Vygotsky, etc & we should embrace their work. However, it remain somewhat marred by the findings and the reality that most teachers are significantly impacted in how they were taught, and would still reflect this back in their own teaching. (Which is an opportunity for the expansion of innovation, if good teachers influence more good teachers.)
Technology in education has looked at converting the ‘sage on the stage’ to the ‘guide on the side’ for some time. If a good educational experience is about providing agency for individuals to become the best learners they can be, then we need to also reflect that in the design for learning.
Interaction and engagement are often driving factors
The design of online teaching and e-learning is often reserved for academic developers, educational technologists and teachers. Designs often cover what will be taught, intended learning outcomes, design of activities, overall structure & any resources required. Design is often overlooked, and many go directly past the planning phase in favour of the building/development phase. This is perfectly acceptable, especially if on a path over a number of years, increasingly using the affordances of e-learning tools to complement their teaching and learning.
Often skipped, or under-resourced are the steps within the planning phase for a blended or fully online course. This may have more substantial repercussions as skipping design can lead to greater issues later on, which may need to be revisited. Luckily, cyclic design methodologies (whether intentional, or not) are no bad thing. It’s a little chicken & egg and the lack of planning is often due to lack of time across the sector/universe.
Designing a good structure for the course is often one of the first tasks needed. The rest of the course should hang off the back of a good structure:
- The structure will, particularly with a fully online course, define what needs doing, and when.
- This is the guide for the students, the stick, the planner, the measure of success and the motivator to stay on track.
- When thinking of how much time students will spend on tasks, and when they do the task may have been overlooked.
- A course overview/week-by-week structure is often where the planning of the chronology of the course starts, stops and the rhythm within.
Learning design to incorporate time as a critical factor?
Not factoring in when a learner will engage in an online environment could increasingly become a bigger issue. In an attempt to identify the importance of this issue, this blog post was written.
Chrono-what?
- Chrono – time
- Gogy – lead
- Pedagogy – to lead the child
- Chronogogy / chronogogical – to lead by the time, time-led
I felt that this might have significance, and anything of that nature would require promotion within the relevant fields for others to rip it apar, to build retaliating endurance into the concept. After looking for time-influenced learning design in conference proceedings, journals and blogs I found nothing on the subject of time-based instructional/learning design or impact. I had to put a term down to then build upon. Sorry if you don’t like it.
Using captured analytic data to measure ‘visit’ hits & drawing crazy ideas off the back of it
Learning analytics is an emerging field within education where data is used to inform the success, design and evaluation of online learning. In a simplistic model used here, we have taken Google analytics visitor data for one month to attempt and identify if we can see any trends with correlation to learning design. It’s a crude example, but the whole post is based on answering my ‘is this a thing?’ question (it’s bothered me for around six months).
- Website 1 – Learning Circuits – an interactive educational resource for 8-10 year old children (I made this a decade ago, still going)
- Website 2 – UCL Moodle – an institutional online teaching and learning environment
- Website 3 – UCL.ac.uk – the main UCL website, hosting information about the university.
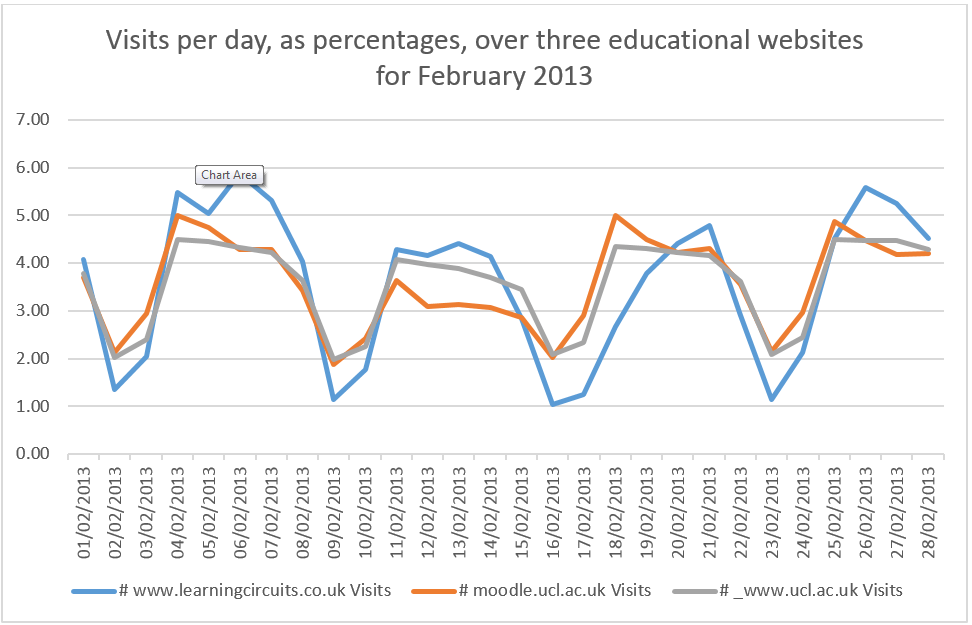
These data show a regular path of activity for the number of visits to websites across the February time period. The websites are all of an educational nature, but differ in their intended target audiences. Y-axis shows the percentage of the monthly number of visits for that day. X-axis shows the day of the month. The chart clearly shows a rhythm in visits, going up and down in a pattern.
The websites were selected for two reasons
- This is an educational observation (but it may be of interest to others if it rung true on other domains)
- These websites were the ones the author had access to for analytical information
We can study these data and make several observations across all three domains:
- There is a distinct shape in visits.

M-shape of activity
- There is a regular drop in the weekend, both days seeing less than half of the weekday visits
- Saturday is the lowest point every week. Sunday is rarely much higher.
- There is a slight drop on Wednesdays.
- This month shows a heartbeat shape to the number of visits.
- There is a slight shaping of an M over the weeks, where single websites, or all together, still create this rough M-shape (shown best in blue)
- Sunday is the beginning point
- Monday/Tuesday is the first highest
- Wednesday shows some drop
- Thursday marks the second peak
- Friday is often slightly lower that a Monday or Tuesday counter-part, but still holds up the M-shape
- Saturday is the lowest point of the week.
Repeating in other months?
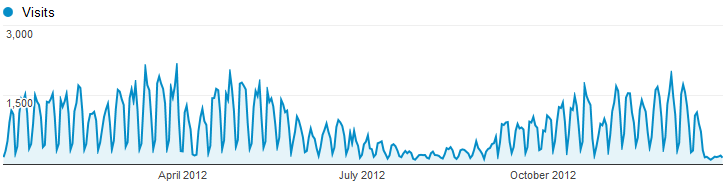
February was chosen as a month in the year as it showed steady visits across three educational, but different sites. Each site has a different busy period, as shown below:
Overview of the number of users for UCL Moodle and activity over the year.

Overview of the number of users for UCL Moodle and activity over the year
Overview of the number of users for Learning Circuits and activity over the year
Overview of the number of users for Learning Circuits and activity over the year
(Sorry no raw data for UCL.ac.uk)
Note: the M-shape persists across these charts.
Sticking with February we looked at the same month for the past five years:
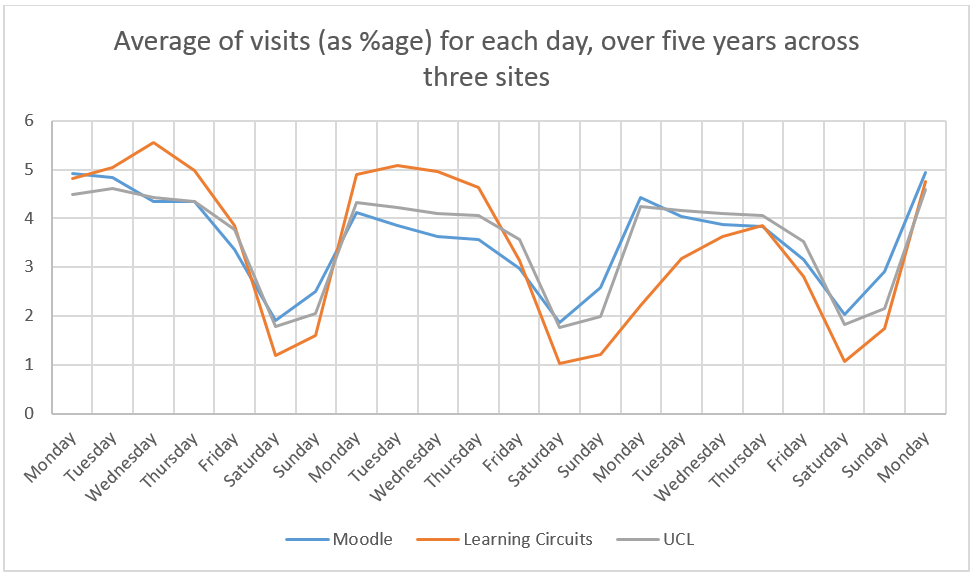
Average of visits, as a percentage, for each day, over five years across three sites
This chart shows the percentage of the visits per day of the week, for three websites, over a five year period. The purpose of this chart is to see if the data shown in the first chart, for February 2013, would be repeated over a longer period. The chart is done by day, and not date & the chart runs over fewer days as the first Monday of February would fall on different days, thus shortening the timeframe to evaluate. The chart shows Saturday having the lowest number of visits over the week, with Sunday resulting in a similar number. The M-shape is less common with Wednesday gaining more visits over a longer time period. The heartbeat over the week, with peaks around Monday/Tuesday and Thursday/Friday remain to show the highest number of visits, especially when compared to weekends.
Out of Winter, across the year
Look across a whole year, in this example 2012, we can see if the data is true across all months and not just February.
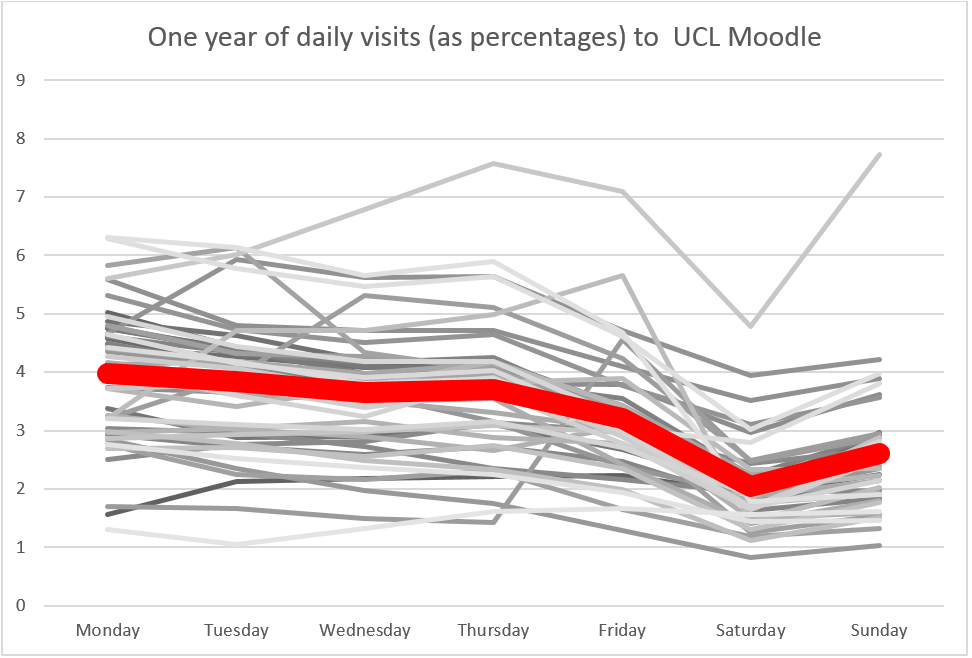
One year of daily visits, as percentages, to UCL Moodle
And for Learning Circuits
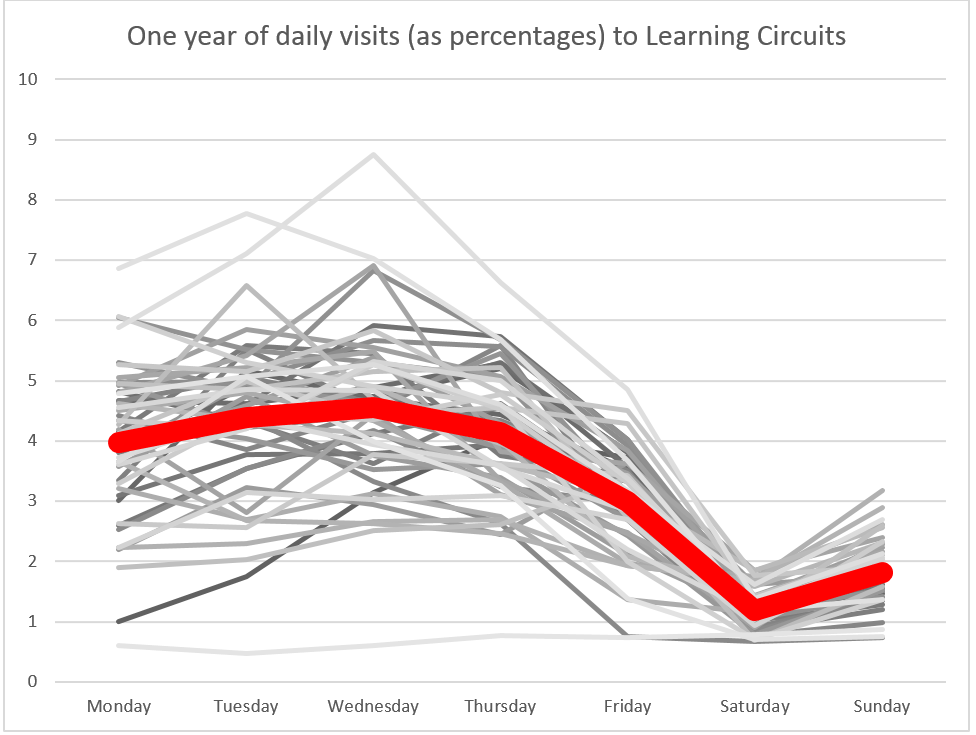
One year of daily visits, as percentages, to Learning Circuits
These two charts show the average (as red) of the percentage of visits over the week. There is no longer an M-shape but do continue to show Saturday and Sunday as the lowest number of visits during the week. Wednesday becomes an increasingly common day over the year for number of visits and for Learning Circuits becomes the most popular day. (This might not have been helped by using Mean numbers and a handful of disproportional and high plots in around week 40 in the year.) UCL Moodle has a similar pattern, with one result much higher above than all others – this is the first week of term in September where the average for the month is very low initially, so on comparison that week is substantially higher. No chart exists for UCL.ac.uk – sorry.
Each of these two charts show the number of visits across two of the sites over a one year period (2012). The intention here is to primarily show that the ‘heartbeat’ of online activity is regular across the year. There are low and high points, but when matched up to the charts above, showing each week’s average, they show that the data analysis, in particular Saturday and Sunday being quiet days, remains true across the year for both domains.
Quantitative vs qualitative
I wonder how long you’ve been thinking ‘he’s not measuring this data very well’. Firstly, I accept all contributions to this. Secondly, this is a desk-based observation, not a research proposal. Any next step would be to review a longitudinal study with an online course, proper data analysis and a real methodology. This is just an idea-incubated post I’m afraid.
Discussion point
Much like the National Grid boost up the power networks when an advertisement break is coming in the nation’s favourite soap operas, could the same be said for a course designer planning their online learning? Perhaps not providing a boost, but instead being aware, and planning for, peaks of online activity?
IF, for example, I were planning an asynchronous activity for my learners would I want to set it for Friday and hope it’s completed by Monday? When would be the best time to plan this?
Most at the moment just set up a week-based activity and hope learners can manage their time effectively around this. However, if the data above can be read into, then more people will be online during the week rather than the weekend. Therefore, it would be best planned over the week, but does this depend on the type of task? What about synchronous activities?
I appreciate this is half-baked but I wanted to share a few simply observations:
- Activity online is clearly displayed in analytical review of web access logs
- This activity seems to indicate a pattern of peaks and troughs, of a ‘heartbeat’ of online visitor activity (measured in days)
- Has time-led instructional design (I like the terms chronogogy of learning design, chronogogical instructional design or chronogogically informed teaching and learning) been undervalued/overlooked in past learning design models for online education?
- Does this have a wider impact for online education, including distance learning and MOOCs?
Next steps
I’ve got a few ideas:
- Talk to fellow educators, technical and less so, ask them if this really has an impact
- Review course design, basic principles, feed into them the idea of time-based / chronogogical learning design
- Expand upon this. We have a ‘Moodle archive’ – find a course with an activity like discussion forums and try to match up stored data with analytics information. Does anything correlate?
- Build it into a platform and measure the data points over a period of time, for a selection of courses
- Fester in a basement for six years completing a part-time research project and slowly lose my mind over a somewhat trivial matter.
Closing
If analytic data suggests there is a ‘heartbeat’ of online activity should this inform learning design? I’d like to hear your feedback, as I think should. I’m going to keep looking into it, I just wanted to share some early thoughts with the internet and its people.
edit: sorry, a grammatically-correct friend provided me some advice on lead vs led. People are reading at least!
Filed under CPD, Distance Learning, e-Learning Publications, Matt's Musings, MOOCs
Tags: chronogogical, chronogogy, course, design, instructional, learning, MOOC, online, time-led
3 Comments »
 Close
Close