 Close
Close

Lecturecast: Viewed and understood?
By Samantha Ahern, on 16 April 2020
For many staff and students Lecturecast is a regular feature of their teaching and learning experience. With the transition to remote provision, it has become one of the core tools. Either via new captures using Lecturecast Universal Capture Personal or the release of previous captures to current cohorts.
How are students interacting with these captures and what could this tell us about their understanding?
The Active Learning Platform (ALP)
Lecturecast is UCL’s internal branding of Echo 360, the service that we use for lecture capture. The Echo 360 Active Learning Platform, ALP, provides a range of features, not just the hosting of lecture recordings.
The interactive features of the platform include:
Recently a number of UCL academic colleagues, Prof Andrea Townsend-Nicholson, Prof John Mitchell and Dr Parama Chaudhury, took part in the webinar Live Panel Discussion: Is it Time for the University Lecture to Evolve?. During the discussion the system’s interactive features are touched upon.
These features can help students manage their learning, but can also provide you with an insight into your students’ understanding. Most of these features can be used for re-released and personally captured content, they do not neccesarily rely on a live teaching event.
More information is available in the ALP Resource Centre.
Analytics Reports
The Active Learning Platform, much like Moodle, collects a lot of data about interactions with the platform. There are a number of analytics reports available to you as the course instructor.
These are:

Example: Video analytics and heat map
Particularly useful information is the unique number of views, average view time and the heatmap overlay. The heatmap identifies the most commonly viewed segments of the video.
Course analytics – Classes data
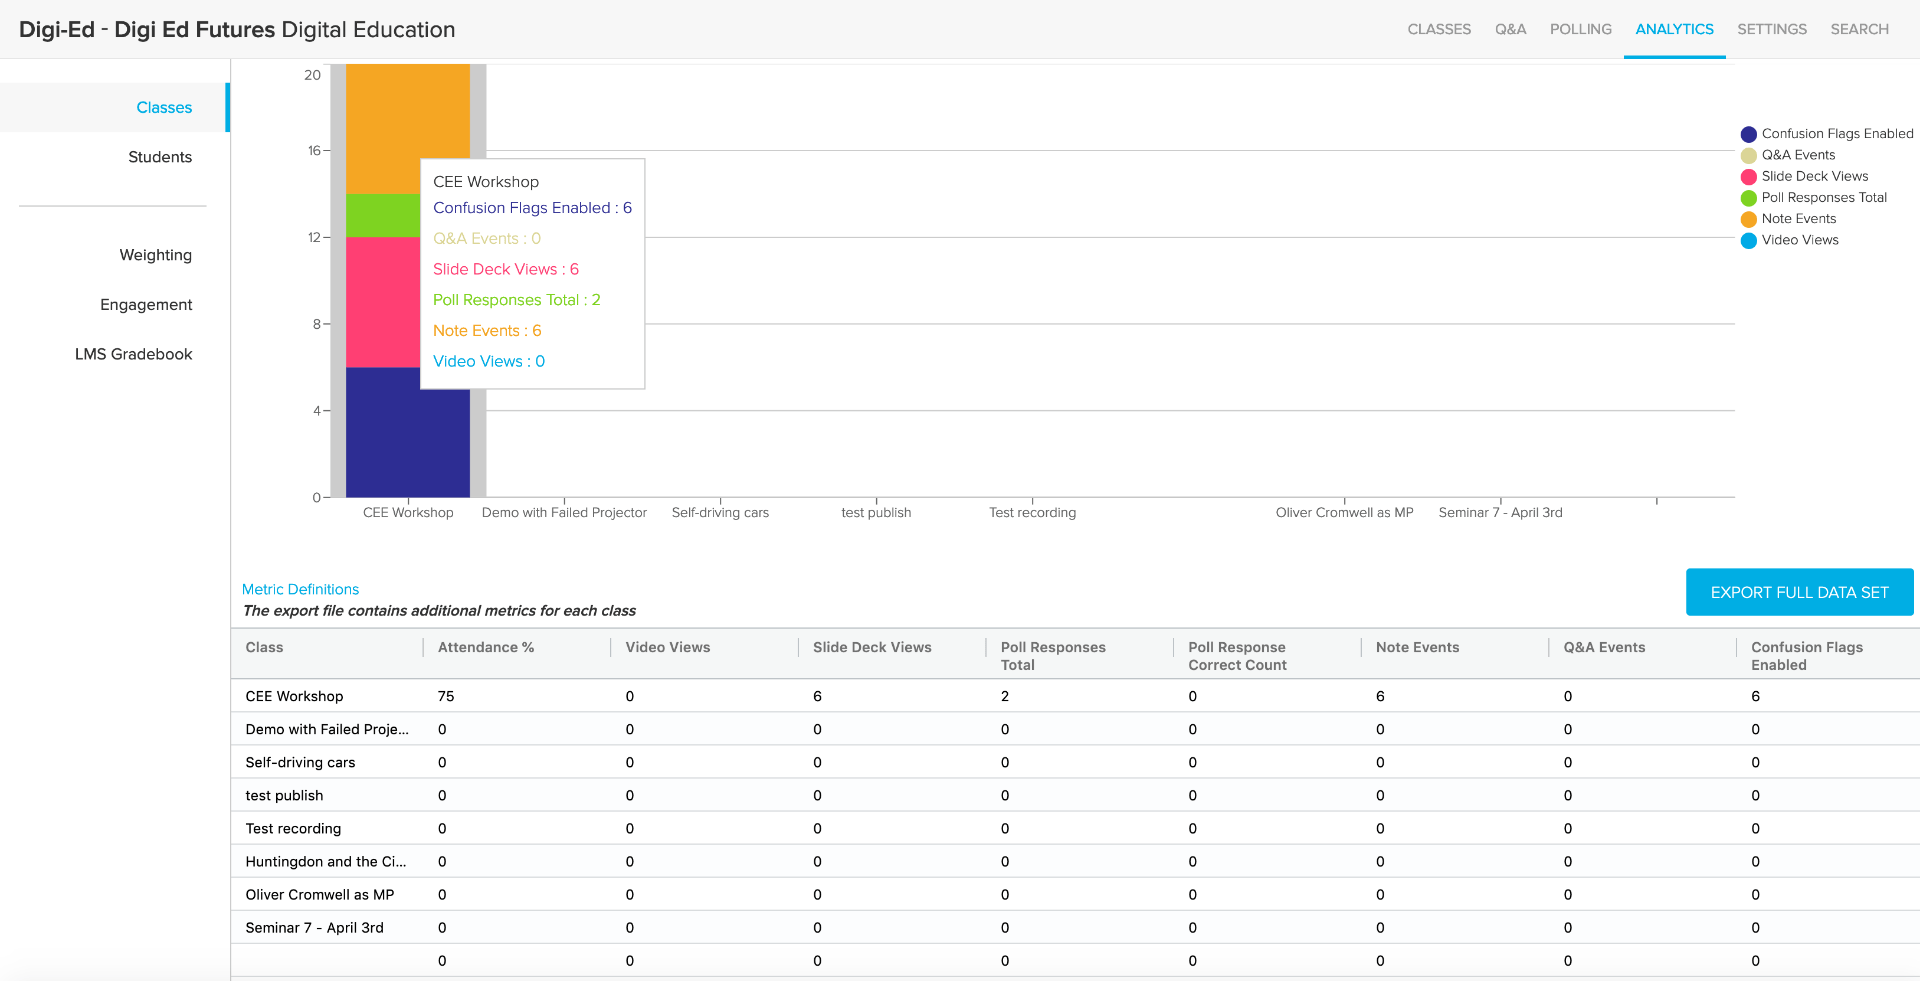
Example: Course analytics – Classes data
This gives an overall view of video and slide deck views, student interactions and confusion flags enabled. The confusion flags are particularly useful as it allows you to gain an insight into what students are potentially not understanding. You are also able to review students’ performance in embedded polling activity. These could then be used to inform future sessions or the provision of additional resources.
Course analytics – Student data
The same information as for the class, but for individual students.
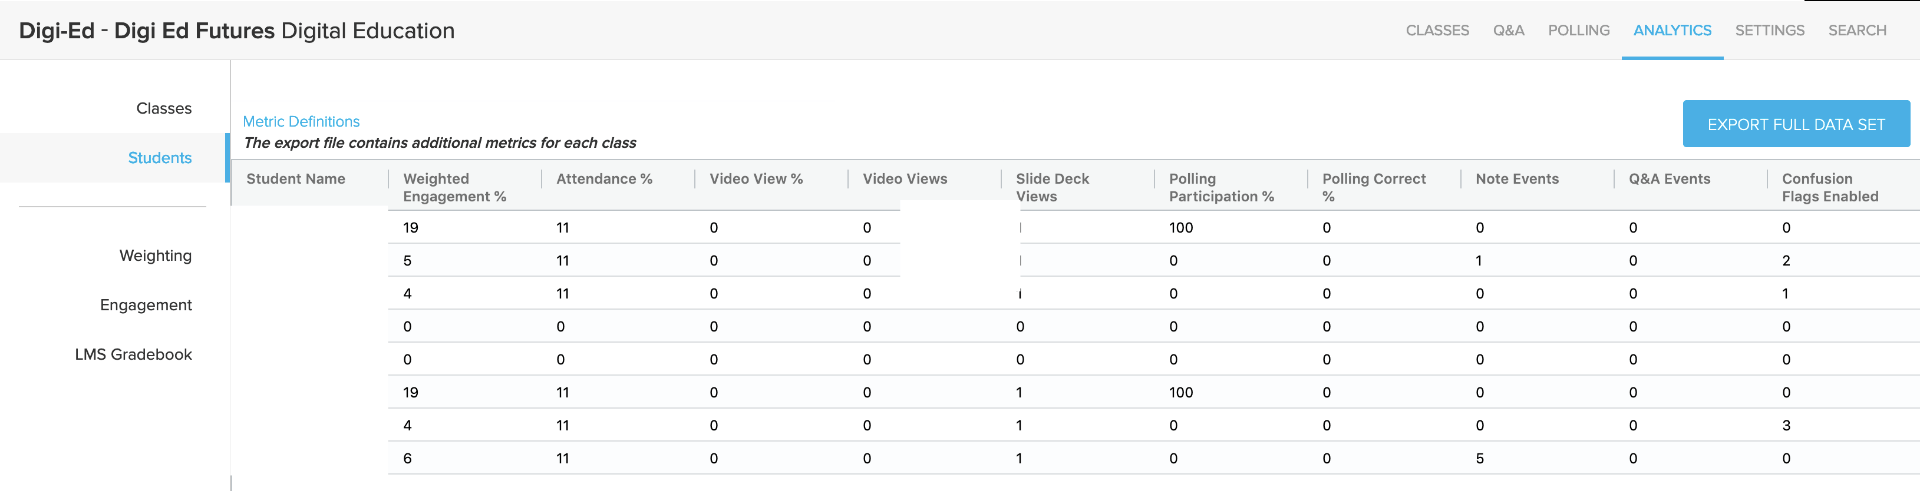
Example: Course analytics – Student data
Insight?
All of these data will enable you gain an insight into how your students are interacting with resources and potentially identify any sticky topics. However, as always they only tell part of the story and should be used with caution. For more guidance on using these analytics please review Digital Education’s Lecturecast Data Analytics Guides.