 Close
Close

Google image results and gender: fair play or own goal?
By Oliver W Duke-Williams, on 5 July 2019
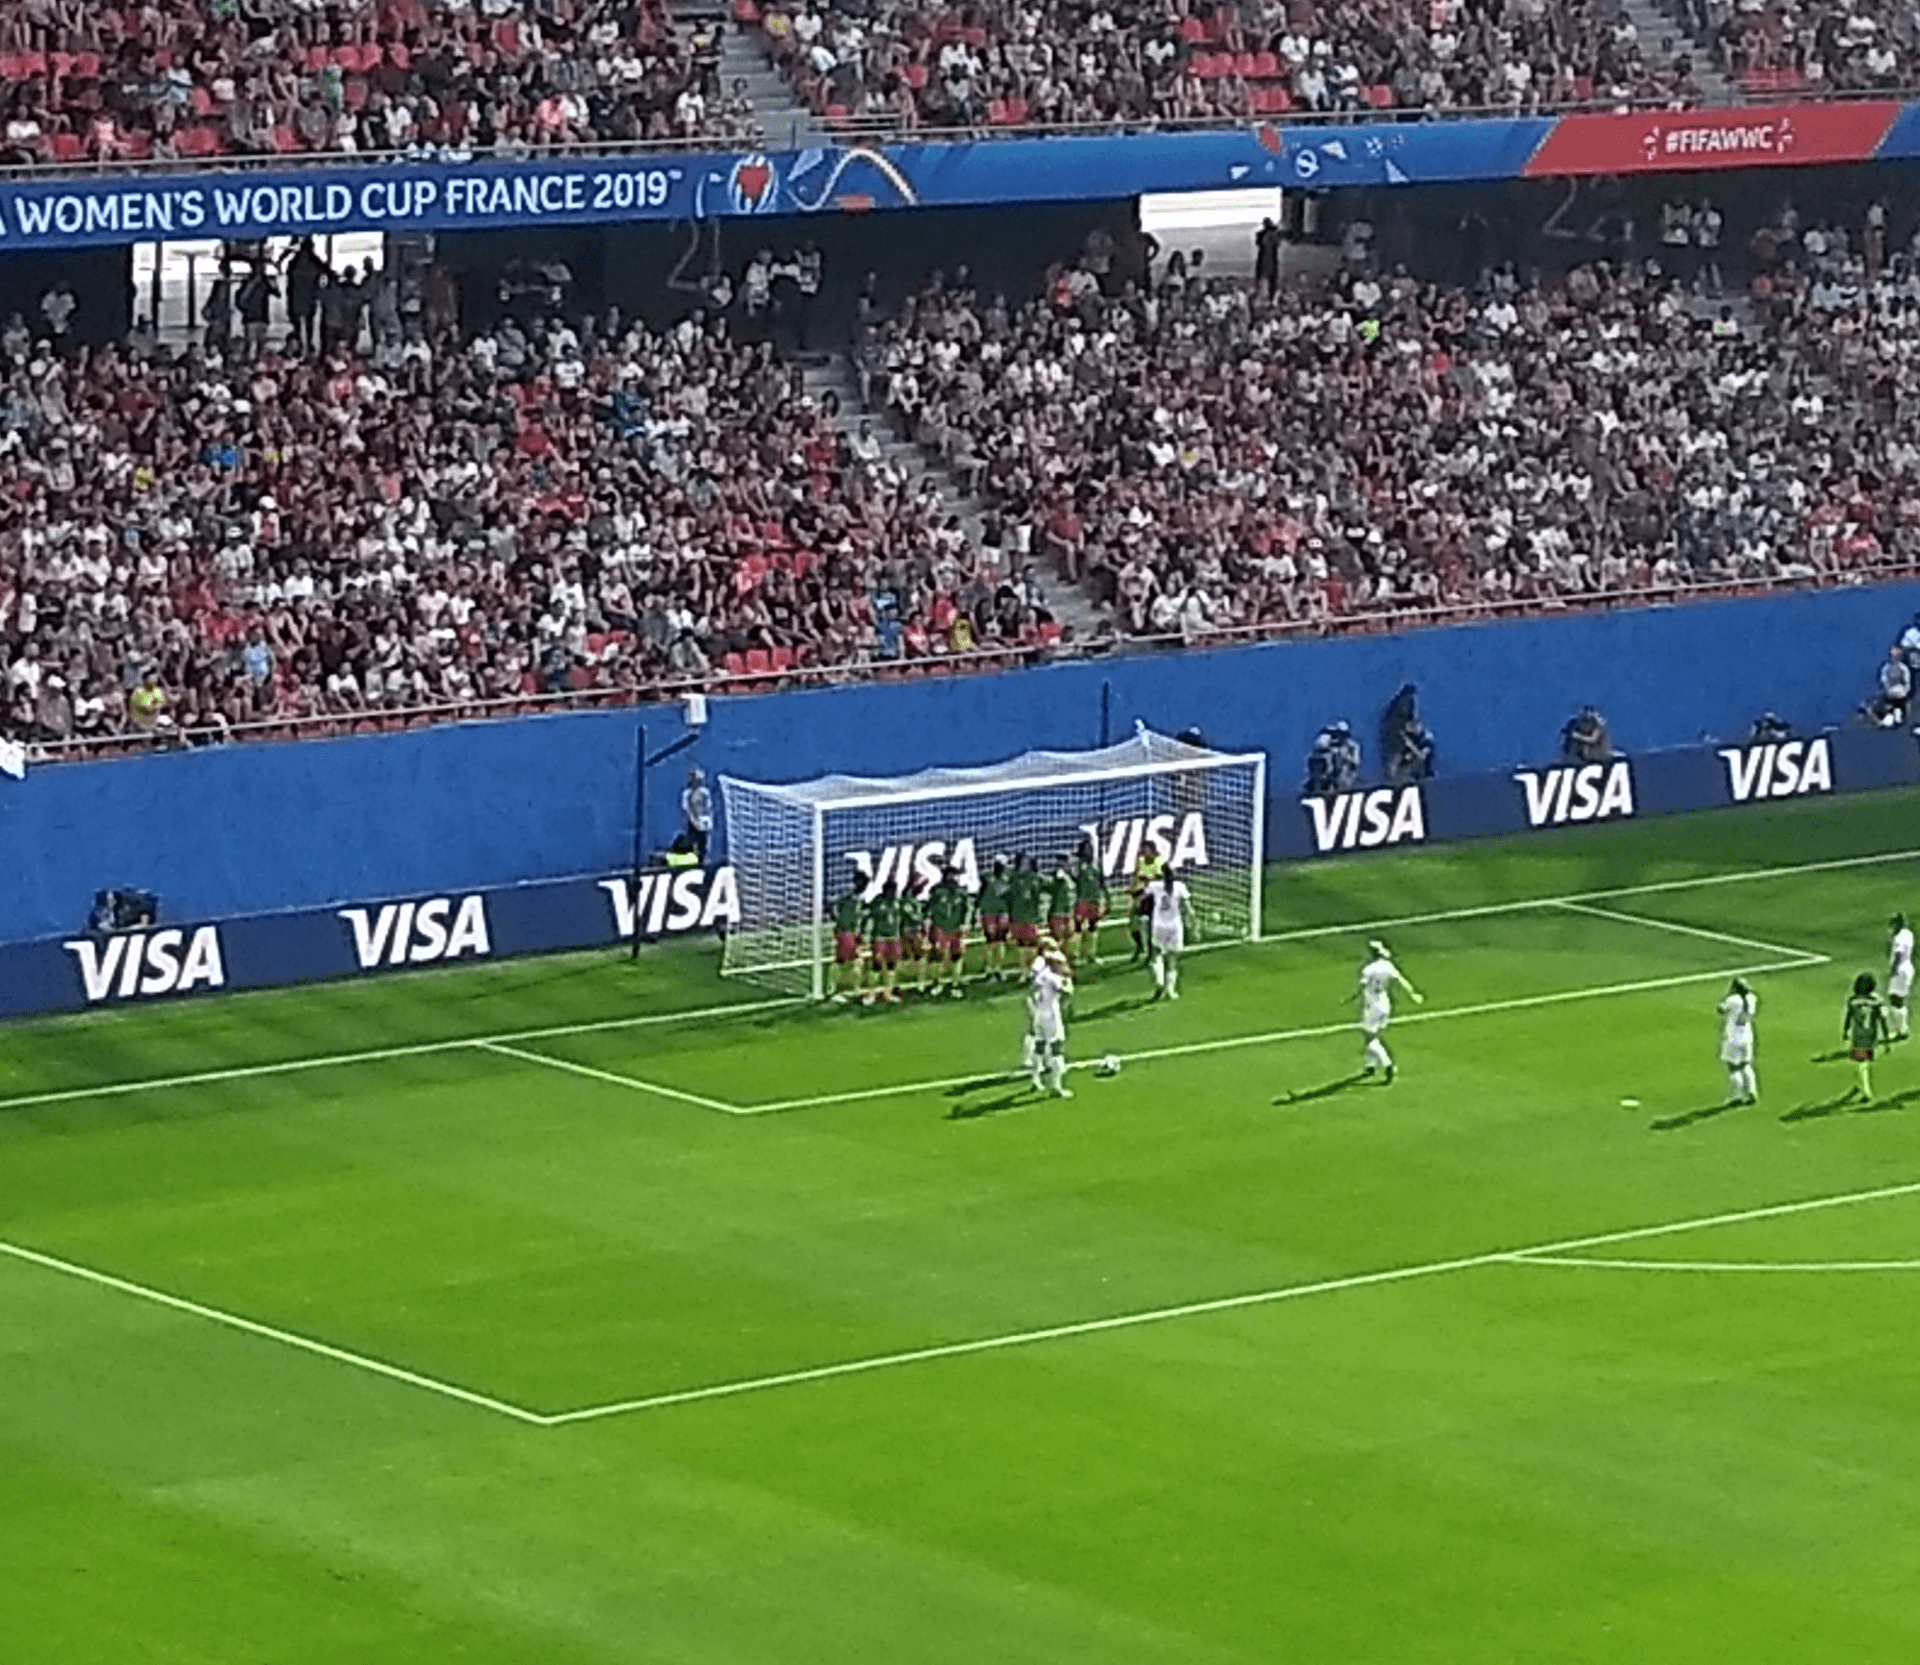
England take a free-kick against Cameroon
Four years ago, I wrote a blog about gender representation in Google image results, looking at the number of men and women depicted in the first screenful of results for various search terms. At the time of the blog, the 2015 Women’s World Cup was well under way, so one example used was searching for pictures of football players at a time you might think would be most likely to see women included in any results.
The first screen full of image results for the term ‘footballer’ didn’t contain a single female player.
Are things still the same, as we approach the final of the 2019 Women’s World Cup? The blog also looked at the balance between men and women shown in results when searching for various sorts of job titles. Has anything improved with those results?
First of all, we might ask whether we’d expect to see any change. Looking at Google Trends for searches for “Women’s World Cup” suggests a slightly greater level of interest now than during previous world cups, but not hugely so.
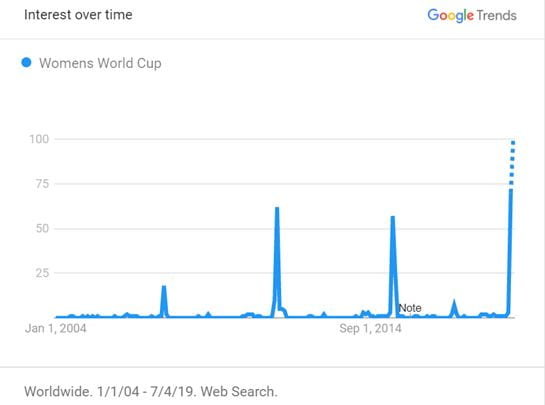
Google Trends results for “Womens World Cup”
On the other hand, searching instead for “FIFA Women’s World Cup” tells a different story, although it is perhaps just one about improved corporate branding:
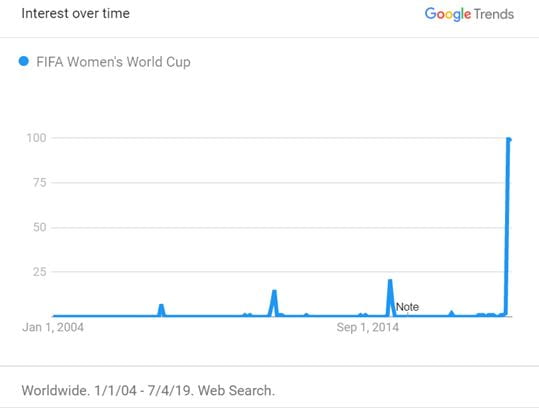
Google Trends results for “FIFA Womens World Cup”
A general problem with trying to analyse Google results is that they’re affected by the user – by their location, by their previous searches, by anything else that Google might use to try and generate a result set that is more useful to that particular person. In order to address that to some extent, searches were done in a ‘fresh’ browser, without having logged into a Google account, and using a private browsing mode, all in an attempt to reduce the influence of any previous searches. Further methodological questions are raised in the process of classifying people in images. For this analysis, a binary classification of ‘men’ and ‘women’ is used, and furthermore, this classification is done visually and thus tends towards normative assessment of gender.
So, have things changed since 2015, when no women were shown in the ‘footballer’ results? A search conducted on July 4th 2019 – after both semi-finals had been played – showed a slight improvement over the 2015 experience: the first set of results contained twenty pictures of male players – and one of a woman: England defender Lucy Bronze.
I wondered whether the result set was influenced by my location in the UK; my US-based friend Anna helpfully ran some queries under similar conditions, and sent me the results – which turned out to be the same: Lucy Bronze leading the charge for women players. This seemed interesting – if location affects results, why no Megan Rapinoe? Why no Alex Morgan? Of course, as Anna pointed out, I’d asked the wrong question: the term ‘footballer’ doesn’t give good results in the United States – but swapping for ‘soccer player’ led to rather more useful results. There’s an obvious lesson to be learned here, about search terms changing meaning from country to country: just as Google might seem to assume the football players are men, so I’d used British English terms without thinking further about the issue…
The result set for ‘soccer player’ was much more balanced, although not fully equal. A set of image results again on July 4th 2019, for ‘soccer player’ showed, with some people repeated, 18 women (including the late Swiss player Florijana Ismaili) and 22 men. However, those numbers are perhaps misleading, as the total for women included a team photo of 11 players. An equivalent search the following day from the UK gave similar image results, although by that time the team photo was no longer on the first screenful of results, giving a lower overall number of women.
I don’t have an equivalent set of image results for ‘soccer player’ from 2015 with which to compare, but the ‘footballer’ results show that whilst that has been at least some improvement, there remains very low representation of the women’s game, even at the peak of the most prestigious competition.
The 2015 blog also looked at relative levels of presentation for people in image results for various types of job, and compared them to the results for the most recent census, which took place in 2011. The table below is adapted from the previous blog, and adds in the 2019 results. There are some indications of improvement since 2015; the total level of error (the difference between the percentages shown in the Google results, and the percentages taken from the census) is lower in 2019 than 2015. However, there are many caveats involved: the method is slightly messy – not only must people be categorised as male or female from thumbnailed images, but decisions often have to be made about who to include. For example, in ‘manager’ images it is often clear than one person in the image is a manager and others are being managed, in which case only the manager would be counted, but it is not always easy to determine who to include and who not to include.
| Table 1: SOC2010 Top level results | ||||||||
| Census results | Google results | |||||||
| Search term | 2015 results | 2019 results | ||||||
| SOC label | Total | %male | %female | %male | %female | %male | %female | |
| 1. Managers, directors and senior officials | 2,883,590 | 65% | 35% | manager | 85% | 15% | 72% | 28% |
| 2. Professional occupations | 4,638,066 | 50% | 50% | professional | 47% | 53% | 54% | 46% |
| 3. Associate professional and technical occupations | 3,379,184 | 58% | 42% | associate professional | 56% | 44% | 50% | 50% |
| 4. Administrative and secretarial occupations | 3,052,488 | 22% | 78% | administrator | 59% | 41% | 48% | 52% |
| 5. Skilled trades occupations | 3,069,047 | 89% | 11% | skilled trades | 100% | 0% | 54% | 46% |
| 6. Caring, leisure and other service occupations | 2,502,256 | 18% | 82% | carer | 11% | 89% | 17% | 83% |
| 7. Sales and customer service occupations | 2,250,261 | 36% | 64% | customer servicer | 0% | 100% | 33% | 67% |
| 8. Process, plant and machine operatives | 1,931,309 | 88% | 12% | machine operative | 95% | 5% | 100% | 0% |
| 9. Elementary occupations | 2,975,367 | 55% | 45% | (no search term) | ||||
Finally, I repeated another analysis done in the original blog, and looked at image results for a number of academic job classifications. Again, the table below is extended from one in the original blog; it shows the 2015 and 2019 results, and the change in depiction of women. In most roles the number of women shown has increased, but, the proportion of female ‘professors’ in Google results, for example, still falls below the proportion reported in HESA statistics.
| Table 3: Google search results – academic titles | |||||
| 2015 Google results | 2019 Google results | female change 2015-2019 | |||
| Search term | %male | %female | %male | %female | |
| professor | 91% | 9% | 86% | 14% | +5% |
| lecturer | 80% | 20% | 69% | 31% | +11% |
| scientist | 74% | 26% | 68% | 32% | +6% |
| lab assistant | 30% | 70% | 33% | 67% | -3% |
| doctor | 87% | 13% | 58% | 42% | +29% |
A survey by FIFA in 2006 estimated that 10% of football players were women; the Google results still trail a long way below that level, although the search for ‘soccer players’ was more fruitful, and closer to the actual gender balance in the CONCACAF region. The rest of the world seems to have a lot of catching up to do with the USA, both on the pitch and in Google results.
Thank you: Anna McDuff, for suggestions and sending screenshots