X Close

Centre for Education Policy and Equalising Opportunities (CEPEO)

Home

We create research to improve the education system and equalise opportunities for all.

Menu

Archive for the 'Schools' Category

Financial Literacy Part 4: Do disadvantaged children receive enough financial education in school?

By Blog Editor, on 11 February 2022

John Jerrim, UCL Social Research Institute
This blog post first appeared on the IOE blog.

In the third blog post in this series, I started to investigate socio-economic differences in the inputs into young people’s financial skills, focusing upon the role of parents.

Schools, of course, also have a key role in helping to develop children’s financial skills. Therefore, in this final blog of the series, we turn to socio-economic gaps in the provision of financial education within primary and secondary schools.

Big gaps in primary schools

Let’s start by looking at what happens in primary school. Figure 1 illustrates the percent of primary pupils who say they have been taught various financial skills at school, stratified by socio-economic background.

There are two striking results.

First, there are consistently large socio-economic gaps. For instance, children from advantaged socio-economic backgrounds are much more likely to report that they have been taught skills such as working out change from shopping (67% versus 54%), saving money (43% versus 28%), and the difference between the things you “need” and things you “want” to buy (36% versus 27%) than their disadvantaged peers.

Second, it is notable how only quite a small proportion of primary school children are taught some really key financial skills at school. For instance, even amongst higher socio-economic status families, only around one in five primary children are taught about bank accounts, how to keep track of spending and saving, and how to spot that advertising is trying to sell them something.

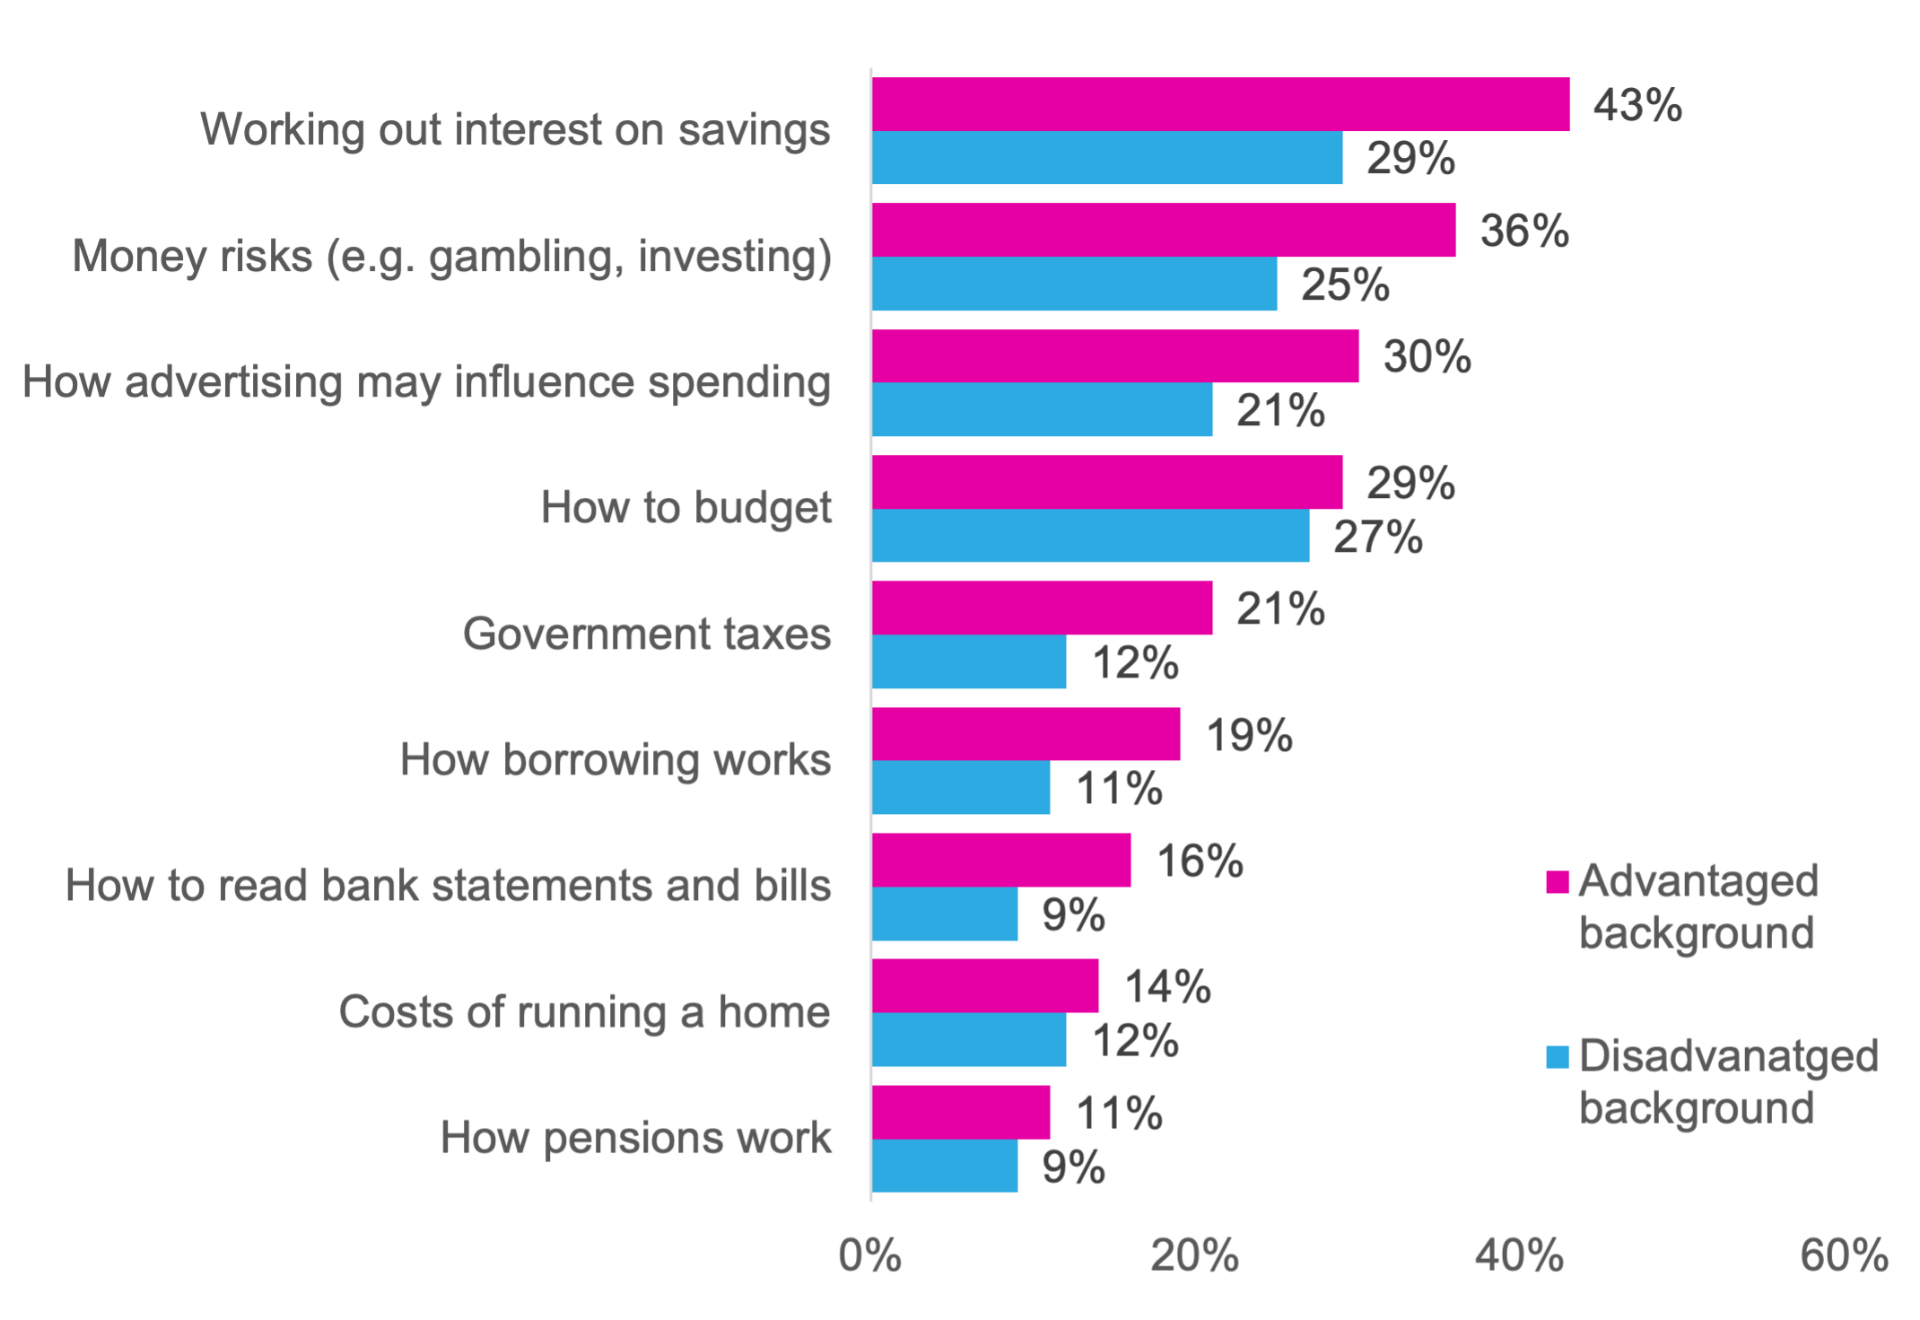
Interestingly, Figure 2 illustrates how a similar pattern emerges during secondary school as well. This presents the clearest evidence to date that the financial education provided to socio-economically advantaged and disadvantaged pupils differs significantly throughout their time at school. Moreover, some key basic financial life skills – such as learning how to budget, how to read bills, and understanding how borrowing works – are only taught by schools to a minority of disadvantaged pupils.

Figure 1. Socio-economic differences in the provision of financial education during primary school

Figure 2. Socio-economic differences in the provision of financial education during secondary school

With respect to the socio-economic gap in financial education provision during primary school, it is also notable how it seems to increase over time, between age 7 (end of Key Stage 1) and age 10 (nearing the end of Key Stage 2). This is illustrated in Figure 3, which combines responses to various questions into a scale, and reports changes in the socio-economic gap over time as an effective size.

In other words, while seven-year-olds from rich and poor backgrounds report receiving similar amounts of financial education at school, this gap in provision increases significantly during Key Stage 2.

Figure 3. Change in socio-economic status gap in “money planning” education provided to primary school pupils

Notes: “Money planning” includes topics such as saving, how to keep track of spending and saving, how to keep money safe and borrowing from banks.

Increase the focus of financial education in the school curriculum

The above suggests that greater time needs to be made in the school curriculum to provide financial education to young people – particularly those from lower socio-economic backgrounds.

Currently, only a minority of low-income children report receiving any education through their school in some key financial life skills. This puts them at a disadvantage compared to their more advantaged peers, with the gap in provision particularly pronounced towards the end of primary school.

One option could be to integrate financial education skills into the Key Stage 2 tests (with the most obvious choice being mathematics). This would provide schools with a clear incentive to ensure young people develop these vital life skills, which currently seem to be pushed out of the school curriculum.

Financial Literacy Part 3: Are there socio-economic differences in how parents interact with their children about money?

By Blog Editor, on 11 February 2022

John Jerrim, UCL Social Research Institute
This blog post first appeared on the IOE blog.

In the previous blog post in this series, I investigated socio-economic differences in young people’s financial skills. This focused upon the types of financial questions that young people from advantaged backgrounds can successfully answer, that their peers from disadvantaged backgrounds can’t.

In this next post, I start to consider socio-economic differences in one of the key inputs into the development of young people’s financial skills – the role of their parents. Are there certain things that higher-income parents do with their offspring to nurture their financial skills, that lower-income parents do not?

Let’s take a look (with further details available in the academic paper here).

Differences in knowledge

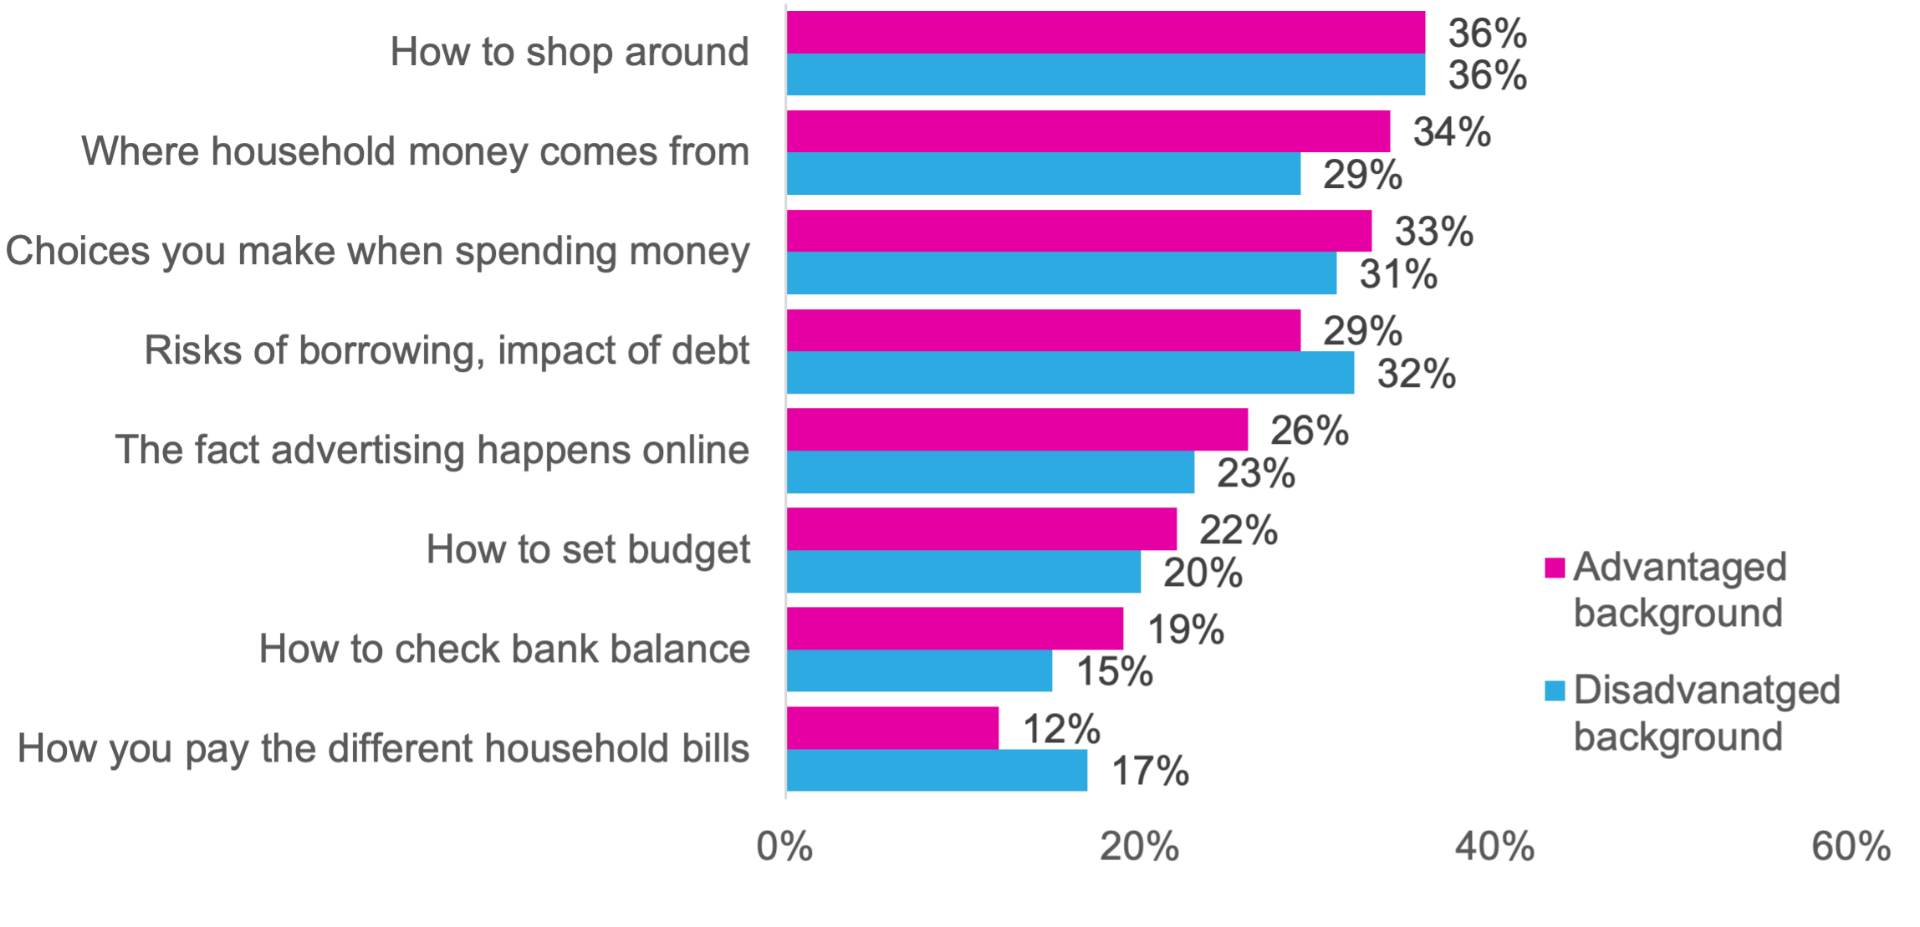
Figure 1 presents the percent of parents who say they do various financial activities “often” with their children, divided by socio-economic group.

Figure 1. Socio-economic differences in parent-child conversations and demonstrations of money use

Note: Figures refer to the percentage of parents who report that they “often” talk to or who show their child how to do the following things with money.

Although higher socio-economic parents are slightly more likely to regularly do most of the activities with their offspring, differences are generally quite small. For instance, although high socio-economic status parents are more likely to talk to their child about where their household money comes from than low socio-economic status parents (34% versus 29%) and the fact that advertising happens online (26% versus 23%) there is no difference in – for instance – showing their child how to shop around.

There are also certain areas that lower socio-economic status parents are more likely to talk to their children about, such as the risks of borrowing, the impact of debt, and how they pay for different household bills.

So, on the whole, socio-economic differences in the informal types of financial education parents provide their children are relatively muted. This point is reiterated by another finding from the survey – that the vast majority of parents recognise the importance of teaching their children about money, regardless of socio-economic background (see the top row of Table 1 below).

Where there does seem to be a notable socio-economic difference, however, is in parents’ confidence in their ability to effectively teach their children about money.

For instance, as Table 1 illustrates, more affluent parents tend to have greater confidence in being able to teach their child about how to manage money (65% versus 52%), that they can act as a good financial role model (65% versus 52%) and that they will be able to affect how their child will behave with money in the long-term (46% versus 37%), than disadvantaged parents.

Table 1. Socio-economic differences in parental views and confidence in teaching their children about money

  Disadvantaged background Advantaged background
% who believe it’s important to teach children about money 85% 88%
% very confident in talking to your child/children about how to manage money 52% 65%
% who strongly agree they can be a good role model for child around money 32% 47%
% who strongly believe they can affect how child will behave around money when they grow up. 37% 46%
% who don’t know how to talk to my child/children about money 13% 13%

Now, such differences could either reflect that (a) higher socio-economic parents are indeed able to teach their children about money more effectively or (b) they are simply more confident in doing so.

Either way, any socio-economic gap in financial skills does not seem likely to be linked to the frequency with which high and low-income parents interact with their children about money – as they report having money conversations and conducting money demonstrations equally regularly. Rather, it seems more likely to be related to low-income parents’ ability to provide effective financial education to their offspring, either through a lack of skills or lacking in confidence to do so.

Financial Literacy Part 2: The financial skills of children. What can rich kids do that poor kids can’t?

By Blog Editor, on 10 February 2022

John Jerrim, UCL Social Research Institute
This blog post first appeared on the IOE blog.

The first blog post in this series illustrated how there are substantial socio-economic gaps in children’s financial literacy skills, with these differences emerging before the start of primary school.

But what exactly can rich kids do – in terms of their financial knowledge and skills – that poor kids can’t?

This blog post takes a closer look.

Differences in knowledge

As part of the Children and Young People’s Financial Capability Survey, young people age 11 and above were asked whether they knew the correct term for various financial concepts, such as “the money people pay to government” (taxes) and “the amount the price of things in shops does up by”.

The percentage of young people who provided the correct response – stratified by socio-economic group – can be found in Figure 1. This provides a clear and consistent story of there being around a 10 to 15 percentage point difference on each of the concepts asked; young people from disadvantaged backgrounds have consistently weaker knowledge across a range of financial concepts.

Figure 1. Inequality in young people’s knowledge of different financial concepts (children age 11 – 17)

How about how money works “in practice”? Young people were also informally tested about their knowledge of how interest on savings work. The exact questions they were asked can be found in Table 1.

Around one-in-three 11-17-year-olds from low socio-economic status families could not work out the amount of money they would have in their savings account with an interest rate of two percent. This is compared to just 14% of children from affluent family backgrounds.

Even fewer disadvantaged children – around two-thirds – failed to understand the concept of a real savings rate, and how inflation erodes the purchasing power. Again, as Table 1 illustrates, the socio-economic gap here is particularly stark.

Table 1. Inequality in understanding interest rates (children age 11 – 17)

Low SES High SES
Suppose you put £100 into a savings account with a guaranteed interest rate of 2% per year. You don’t make any further payments into this account and you don’t withdraw any money. How much would be in the account at the end of the first year? 68% 86%
If the inflation rate is 5% and the interest rate you get on your savings is 3%, will your savings have more, less or the same amount of buying power in a year’s time? 31% 53%


But what about the consequences of not keeping up with paying important bills? This may have more salience for young people from disadvantaged backgrounds than advantaged backgrounds, given how their parents are more likely to face such financial difficulties.

Interestingly, in this area, socio-economic differences are a lot less pronounced, as illustrated by Figure 2.

Figure 2. Inequality in young people’s understanding of the consequences of not paying council tax (children age 14 – 17)

Almost all children, regardless of their socio-economic status, understood that failing to pay council tax has consequences, and that the government won’t simply pay it for you.

But only around one-in-three understood that this is a criminal offence, which could result in a custodial sentence, with the percentage actually slightly higher for those from disadvantaged backgrounds.  Similarly, only around half of 14-17-year-olds realised that possessions may be seized by a debt collector, with again only a comparatively small difference between socio-economic groups.

Conclusions

Although disadvantaged children’s knowledge of key financial concepts is weaker than their more advantaged peers, they seem to be equally tuned in to the consequences of failing to meet important financial commitments.

Nevertheless, it is somewhat concerning the way there do appear to be significant gaps in disadvantaged children’s financial knowledge. Many cannot work out simple interest rate calculations, with most not understanding that inflation erodes the purchasing power of money. More than half of disadvantaged teenagers also do not grasp the full severity of not paying their taxes due.

Given the potential long-term consequences of such weak financial skills, more needs to be done to improve disadvantaged young people’s understanding of money and how it works.

Financial Literacy Part 1: How unequal are children’s financial literacy skills?

By Blog Editor, on 10 February 2022

John Jerrim, UCL Social Research Institute
This blog post first appeared on the IOE blog.

In an increasingly complex financial world, it is important that we ensure young people develop a sound knowledge of financial issues and possess key financial skills. This is particularly important for young people from disadvantaged socio-economic backgrounds who, unfortunately, are the most likely to struggle financially during adulthood and become entrapped in a cycle of poverty and debt.

Yet, in the UK, we know relatively little about children’s financial capabilities, including differences between socio-economic groups, and the age when such gaps start to develop.

Along with Jake Anders and Lindsey Macmillan, I have tackled this issue in a new academic paper. This uses data from the 2019 Children and Young People’s Financial Capability Survey – based upon responses from 3,745 children from across the UK.

Spoiler alert! The gaps are pretty big, and emerge pretty early.

How big are the socio-economic gaps in children’s financial knowledge?

As part of the survey, young people were asked a series of questions that tested their financial knowledge (further detail about the questions asked are provided in the next blog post in this series). We have converted this into an overall score, and then compared the average percentile ranking of children from advantaged and disadvantaged socio-economic backgrounds (where 100 = top 1% of children in terms of their financial skills and 1 = the bottom 1% of children).

Figure 1 presents one of our key findings, plotting results for children from advantaged and disadvantaged socio-economic backgrounds, and illustrating how this changes as children age.

Three key results emerge.

First, the socio-economic gap in children’s financial skills is pretty big. For instance, at age 17, there is a difference between socio-economic groups – on average – of around 14 places in the financial skills rankings (low SES = 55th percentile versus high SES 69th percentile).

Second, the gaps emerge early, and then are sustained – but do not seem to grow bigger. For instance, at age 11, there is a difference between socio-economic groups of around 13 places in the financial skills ranking (30th versus 43rd percentile). This is essentially the same gap as observed at the end of secondary school.

Finally, the financial skills of 15-year-olds from socio-economically disadvantaged backgrounds are approximately the same as those of 11-year-olds from the most advantaged backgrounds. In other words, poor kids have similar financial skills just before they are about to leave secondary school as rich kids do just after joining.

Clearly, then, the root cause of inequalities in young people’s financial skills is taking hold before children enter secondary school.

But just how early such differences emerge we still don’t really know…

Figure 1. The financial literacy skills of socio-economically advantaged and disadvantaged children (age 11 to 17).

What might be driving this gap?

Figure 1 in many ways replicates what we know about socio-economic inequalities in educational achievement more broadly – gaps emerge early in life and are then firmly maintained.

A later blog in this series will look into the inequalities in the inputs into children’s financial education, both by schools and by parents. This may, in turn, provide some suggestions of the potential factors underpinning this gap in schools.

But at the same time, it’s important to understand that there are unlikely to be easy solutions to such problems. Rather, coordinated action by schools, parents, policymakers, financial service providers and society is likely to be needed if such socio-economic differences in financial skills are to get meaningfully reduced.

Levelling up education and skills: a recipe for success?

By Blog Editor, on 3 February 2022

Claire Crawford, Laura Outhwaite, Sam Sims and Gill Wyness

It’s finally here: an answer to the question of what the government means by ‘levelling up’. On the education and skills front, it seems to involve some seriously ambitious targets: a massive increase in the percentage of children achieving the ‘expected’ level in reading, writing and maths at age 11 over the next eight years across all areas, with more than 50% rises needed to meet the target in most local authorities. Alongside these national targets, a set of 55 ‘Education Investment Areas’ – roughly the poorest performing third of local authorities in terms of primary and secondary school results – were identified, in which some new (and some re-announced) policies would be targeted.

It is good to have specific, measurable and stretching goals, but given the scale of ambition involved, there was very little detail of how we will actually get there – and no evidence of significant new resources to do it. Complex issues, like inequalities across the life course, require holistic solutions and joined up thinking across all aspects of the journey – things that simply cannot be delivered without appropriate funding. There was also little evidence of the embedding of new announcements within existing strategies – certainly in terms of the plans for educational technology, with the white paper championing the creation of a new online UK National Academy to support schools and children, without embedding this within the wider EdTech strategy.

There were some other glaring omissions as well . . .

Early years

“Potential is shaped from the very beginning of our lives, and all children and families need to be able to access high quality early years education, schools and support.” So began the ‘case for action’ underlying the pledge to ‘eliminate illiteracy and innumeracy’. The statement is correct: the best evidence we have, from both the UK and internationally, suggests that high quality early education benefits children – especially those from socio-economically disadvantaged backgrounds – in both the short-term and the long-term.

But – aside from the reannouncement of funds previously identified in the spending review to expand Family Hubs, the ‘Start for Life’ programme and the ‘Supporting Families’ programme – that was the only mention of early years anywhere in the 332 page document. More time was spent discussing the Roman Empire than the early years sector. Despite pointing out that there are significant regional differences in children’s development by age 5 – differences that are dwarfed by the even larger gaps in development between those who are and are not eligible for free school meals at the same age (18 percentage points: 57% vs 74%) – no mention was made of the crucial role investment in early years could play in reducing these gaps. At a time when the percentage of 0-4 year olds attending early years settings has still not recovered to pre-pandemic levels – with larger drops amongst those from more disadvantaged backgrounds and areas – as well as significant recruitment difficulties and funding challenges, this feels like a significant missed opportunity.

11-19 education

Perhaps the most eye-catching commitments were focused on schools and colleges, although not all of these were new announcements. The reintroduction of retention payments – “to help schools [in Education Investment Areas] with supply challenges to retain the best teachers in high-priority subjects” – was announced at the Conservative Party conference in 2021, and is a reincarnation of several previous versions of a similar policy. More on this below. We also reflect on the promise to “ensure that talented children from disadvantaged backgrounds have access to a college, school sixth form or 16-19 academy, with a track record of progress on to leading universities”.

Teacher retention payments

The government is pledging an additional £3,000 (around 10% of a year’s salary) to early-career maths and science teachers in the 55 Education Investment Areas. (It is not clear yet whether this is per year or in-total.)

Will these retention payments be effective? That depends how we define effective. Similar policies have been shown to improve the retention of early-career teachers in the profession. If teachers can be retained for the first few years of their career, they are then much less likely to leave the profession prior to retirement, so the retention payments probably will increase the overall supply of science and maths teachers in England.

However, a recent systematic review suggests that incentives aimed at keeping teachers in specific schools or local areas are likely to be effective only as long as the policy is in place. It is possible that teachers will move away from the targeted areas when they no longer qualify for payments. Whether – or for how long – the policy will improve the supply of science and math teachers in these areas therefore depends on how long the policy is kept in place. It will also depend hugely on the size of the incentive: clarity over whether it is £3,000 per year across the early-career period, or £3,000 in total – either delivered in a single lump-sum or spread over a number of years – is needed before we can predict how effective this policy might be.

‘Elite sixth forms’

These sound like they could be grammar schools in all but name, given that the school admissions code allows sixth forms to select pupils on the basis of ability. While this might expand educational opportunities for a small number of high achieving students from disadvantaged backgrounds, it is likely to widen inequalities within the areas more broadly. We have strong evidence from the areas of England which still operate large numbers of grammar schools that suggests these systems widen inequalities in attainment during school, in higher education and in subsequent earnings, because while they generally improve outcomes for those fortunate enough to attend the selective schools, they tend to worsen outcomes for those who miss out. The policy also seems somewhat at odds with the government’s recent shift in focus away from higher education and towards the long-neglected further education sector, almost a direct contrast to the aim of encouraging greater parity between academic and vocational routes. Why favour one and not the other here?

Higher education and skills

The continued focus on adult skills is, of course, welcome. Most of the announcements in the white paper are not new – although, to be fair, there was a skills white paper out last year. But many of the initiatives, while potentially promising, are quite ‘piecemeal’, targeting relatively small numbers of learners, and nowhere near enough to reverse the historical declines in either numbers of students or funding per head seen over the last decade. It’s also not clear to what extent some of the more specific initiatives – such as skills bootcamps – are evidence-based.

One new announcement is the Unit for Future Skills, which will champion a more data driven approach to identifying skills gaps. This has the potential to improve the ‘matching’ of workers and jobs, potentially leading to higher productivity in future. But they will have their work cut out for them, as we don’t know a whole lot about the skills people have (other than their qualifications), or which specific skills employers struggle to recruit or find difficult to train. We will watch this space with interest . . .

The role of the university sector – often lauded as an engine for regional growth – was limited to a few mentions here and there, although it sounds like it will benefit from increased funding for R&D.

Final thoughts

The white paper emphasises the importance of place in its version of levelling up. If successful, this means that the average difference in outcomes across areas may fall. But it is worth remembering that inequalities in outcomes, including education outcomes, tend to be larger within areas – between different groups – than across areas.

The education and skills policies outlined in the white paper make a reasonable attempt at targeting the benefits towards more disadvantaged individuals living in the Education Investment Areas. But of course there are plenty – indeed the majority – of individuals from disadvantaged backgrounds living in other areas, whose outcomes are far lower than those of their better-off peers. We must ensure that the political focus on the levelling up agenda does not displace any of the much-needed support for individuals from disadvantaged backgrounds, regardless of where they live.

The 2021 Autumn Budget and Spending Review: what does it mean for educational inequalities?

By Blog Editor, on 28 October 2021

Claire Crawford

The pandemic has disrupted life for everyone, but children and young people have seen perhaps the biggest changes to their day-to-day lives, with long periods spent away from school and their friends leading to significant rises in mental health difficulties and a substantial reduction in learning. Moreover, these challenges have not been felt equally: the evidence suggests that the pandemic has also led to a rise in inequalities between children from different socio-economic backgrounds, from the early years through to secondary school and beyond.

A budget and multi-year spending review delivered against a backdrop of the highest peace-time borrowing levels ever, and by a chancellor on a ‘moral’ mission to limit the size of the state, was unlikely to deliver the sort of investments in education that Sir Kevan Collins hoped to see when he took the role of ‘catch-up tsar’ earlier this year. But what did it deliver for education? And is it likely to help roll back the rises in educational inequalities that the pandemic has generated?

Early years

While it is positive to see some recognition of the need for a higher funding rate to be paid to early education providers to cover the delivery of the early education entitlements for 2, 3 and 4 year olds, the amount earmarked – £170m in 2024-25 – does not represent the substantial investment that many in the sector have been calling for: certainly nowhere near the £2.60 per hour increase that was estimated to be needed to fully fund the entitlement, enabling providers to deliver these hours without incurring a loss, or by charging for ‘extras’ (such as food or nappies) or increasing fees for other children in order to cover costs.

We await the details of exactly what this means for the official funding rate per hour. Still, for some idea of scale, spending on all early education entitlements – the universal 15 hour entitlement for 3 and 4 year olds, the additional 15 hours for 3 and 4 year olds via the extended entitlement, and the 15 hour entitlement for disadvantaged 2 year olds – was around £3.8bn in 2019-20. 170m represents less than a 5% increase on this figure. Putting it another way, in 2019-20, a total of around 1.75 million children were benefitting from each of the free early education entitlements. If the number of children taking up these places was to remain unchanged between 2019-20 and 2024-25, this suggests that early education providers would only receive around £100 per year more per child than they do now. In reality, the population of 2, 3 and 4 year olds is expected to fall over the next few years, which – when coupled with the reduction in take-up of the early education entitlements that we have seen over the course of the pandemic – may mean that the actual increase in funding rates is higher than 5%. But not much higher.

Likewise, while greater investment in family support services is also welcome, the much-trumpeted £500m increase represents less than half of the reduction in spending on Sure Start Children’s Centres that has taken place over the last decade, falling by over £1bn (around two thirds) in real-terms from a peak of around £1.8bn in 2009-10. A start, perhaps, but not the transformative ‘Start for Life’ that the rhetoric surrounding this announcement would suggest.

Schools

Yesterday’s announcements on schools were dominated by the news that school funding would return to real-terms levels last seen in 2010. Not much to write home about, you might think. But there was also only a small amount of additional money for education catch-up, including an increase in the ‘recovery premium’ – catch-up money targeted towards pupils from lower income families – for secondary school pupils. While it is positive to see funds being targeted towards the pupils most in need of support, our work has shown that the differences in remote learning experiences while schools were closed to most pupils varied substantially by socio-economic background, and whether the roughly £5bn allocated to catch-up will be enough to redress the balance is unclear. It certainly amounts to a lot less than is being spent per pupil in other countries.

Further and higher education

Despite rumours circulating in the media, the decision on the funding of higher education was kicked into the long grass yet again, with the words ‘higher education’ mentioned only three times in the Budget and Spending Review document, and more information promised “in the coming weeks”.

Meanwhile, the eye-catching nominal and real-terms increases announced for further education (FE) and skills look decidedly less generous once account is taken of the fact that we are about to experience a massive increase in the population of 16-19 year olds. The document itself acknowledges that while there will be a 28% real-terms increase in 16-19 funding in 2024-25 compared to 2019-20, this will only maintain – rather than increase – funding per student in real terms. Despite a much greater emphasis in policy discourse about the importance of further education and adult learning than we have seen in recent years, this settlement does not suggest a transformation of the fortunes of the FE sector, which caters to the majority of each academic cohort and in which young people from lower socio-economic backgrounds are over-represented.

Implications for inequalities

Perhaps contrary to expectations, yesterday’s spending review contained increases in spending for most government departments, paid for by the highest tax rises in nearly 30 years. But given the significant challenges posed by the pandemic for children and young people, the Department for Education’s budget will be only a little higher in 2024-25 than it was in 2009-10, while the Department of Health and Social Care budget will have increased by over 40%.

The thinking seems to be that children will catch-up over time anyway. But the evidence suggests that inequalities in educational attainment only increase as children get older: higher socio-economic status parents can provide more opportunities for learning – through better schools, tutoring or more academic and non-academic enrichment activities – than lower socio-economic status parents, and these investments cumulate over time, widening the gap between those from different backgrounds. The same will be true of parents’ ability to support their children to ‘catch-up’ on what they lost during the pandemic.

Without significant government investment to support children from more disadvantaged backgrounds, the wider inequalities that have opened up over the course of the pandemic are likely to foreshadow even greater inequalities in future. Yesterday’s spending review offered some support – but nowhere near enough.

Learning About Culture: The importance of arts-based learning, the limits of what we know about it, and the challenges of evaluating it

By Blog Editor, on 8 September 2021

Jake Anders, Kim Bohling, Nikki Shure and Alex Sutherland

There is little doubt about the importance of arts and culture to the education and upbringing of young people. Arts-based education gives young people an important means of creative expression and “arts for arts’ sake” is the best argument for having arts-based education in schools. However, far less is known about the link specifically between arts-based learning activities and pupils’ educational outcomes – partially due to a lack of robust studies on this topic. Yet this is a link that is often invoked as part of the overall importance of these programmes, partly in response to a perception that an increased focus on “core educational outcomes” is squeezing arts-based education out of schooling.

Over the past four years, a team from UCL and the Behavioural Insights Team has been working with the Education Endowment Foundation (EEF), the Royal Society for the Arts (RSA) and five arts-based education organisations on a project called Learning About Culture (see Table 1 below for programme detail). At the heart of this project are five randomised controlled trials (RCTs) involving around 8,500 children in 400 state schools across England. These evaluations were designed to look at the impact of five specific arts-based learning interventions on literacy outcomes. To our knowledge, these trials represent the largest collection of RCTs testing arts-based approaches on attainment outcomes. This body of research represents a significant step forward in understanding how to assess the relationship between creative activities and pupil outcomes, which is in itself important.

Each of the programme reports is linked to below and an overarching report that synthesises the findings, lessons, and recommendations can be found here. What you’ll immediately notice is the diversity of approaches we looked at – including music, storytelling, and journalism – reflecting the richness and diversity of the sector.

Table 1. Learning about Culture programmes

Each programme name is hyperlinked to the EEF project page.

Programme name (Developer): Description:
First Thing Music (Tees Valley Music Service) Programme to train teachers in the Kodály method of music instruction in order to deliver daily a structured, sequential music curriculum of increasing progression (Key Stage 1)
Speech Bubbles (London Bubble) Weekly drama and storytelling intervention aimed at supporting children’s communication skills, confidence, and wellbeing. (Key Stage 1)
The Craft of Writing

(Arvon, University of Exeter, Open University)

Programme to develop teachers as writers combined with explicit focus on pedagogical implications for the classroom. (Key Stage 2)
The Power of Pictures

(Centre for Literacy in Primary Education)

Specialist training from published author-illustrators and expert teachers helps primary teachers to develop their understanding of the craft of picture book creation. (Key Stage 2)
Young Journalist Academy (Paradigm Arts) The project aims to develop pupils’ writing by involving them in journalism. In doing so, it aims to provide pupils with a meaningful purpose for writing and teach specific writing techniques. (Key Stage 2)

What did we find?

When compared to ‘business as usual,’ we were unable to find improvements in pupil attainment in any of the five trials that we could reliably say weren’t due to chance. However, it’s important to emphasise that this is an extremely challenging barrier to clear and the fact of the matter is that most of the trials that the EEF funds don’t find impacts of interventions on pupil learning outcomes.

While it is easy to focus on the lack of a positive impact in the outcome measures, we also want to emphasise the trials found no evidence of detrimental effects from introducing such programmes. That is actually really good news, because it means that including arts-based programmes alongside ‘core curriculum’ subjects isn’t a zero-sum game where increasing time on arts means lower grades elsewhere.

And, as we pointed out above, improving pupil academic attainment is not the best or only reason for schools to implement arts-based interventions in schools. Although they did not improve literacy test scores, in interviews with participating teachers and pupils, we found that the programmes generated a great deal of enthusiasm among the teachers and pupils who took part in them. Perceived improved pupil engagement was a theme that emerged from the implementation and process evaluations across the five programmes.

In the overarching report, we also stress that these results should absolutely not be seen as the last word in whether arts-based learning is effective in improving outcomes for pupils. Necessarily, in this kind of research, we focused on one set of outcomes, which could be quantified and measured over a fairly short time horizon. But benefits could accrue in many other ways that we just couldn’t capture. For one, having these initiatives available to pupils may have long term consequences for the subjects these pupils choose at GCSE or A level or the career paths they choose to follow. We don’t know that there are these benefits, either, but our evidence shouldn’t be used to discount such possibilities.

Our reflections as evaluators

The overarching report contains thoughts and lessons for multiple audiences: researchers, funders, and arts organisations. For brevity, we’ve only selected a few takeaways to highlight here.

Evaluators and funders

There is a line of argument against our efforts here that what we can measure in trials (and research more broadly) is not always what ‘matters’, or what we ‘should’ measure. Equally, some will point to challenges in measuring what we did use as outcomes, as well. We know that the measures used are imperfect, but given the choice between imperfect measurement of something versus perfect measurement of nothing – or something further removed from the intervention – then we stand by our decision to do what we can in an imperfect world. This isn’t an abstract research issue: in order to be able to ascertain whether something is effective (or not) we need to be clear what we expect to change and measure that as best we can.

In line with EEF’s policy, reflecting their primary aim as an organisation, our impact evaluations focused on measuring pupil attainment outcomes. While this approach has many strengths given the undoubted importance of such outcomes, these projects – where we see positive signs of engagement based on the implementation and process evaluation but ultimately no impacts on our measured outcomes – highlight one of its key limitations: a null finding leaves a lot of unanswered questions. An alternative approach – with similarities to the increased emphasis on ‘mechanism experiments’ in economics and particularly important where there is a limited evidence base about how interventions work – would focus first on establishing whether the interventions do indeed affect the intermediate steps via which they are thought to improve attainment. This would help us first to establish whether the programme is working as we think it does or if there is more to be done to understand this crucial first stage to achieving impact on pupils’ academic attainment.

Arts organisations

We really appreciate the courage and commitment from the arts-based education organisations who put themselves forward to participate in a multi-year evaluation process. The EEF’s support for both an individual and overarching approach to the evaluation meant that we were able to observe themes across the programmes that could be useful to other arts organisations. From these themes, we offer some recommendations for consideration.

Ensure buy-in and engagement from school staff at multiple levels.

High teacher buy-in was crucial for the day-to-day delivery of the programme, and senior leadership team (SLT) buy-in was important for supporting the teacher in high-quality delivery. For example, SLT members were able to ensure teachers had access to necessary resources and space, as well as ensure there was time in the timetable for the programme.

Carefully consider programme resource requirements and test assumptions about what’s available in schools

The interventions placed different demands on schools in terms of the resources needed to take part, and even where required resources were considered ‘standard’, challenges were still reported. In some cases, schools did not have resources, such as arts supplies, that were assumed to be available in most schools. In other cases, the schools had the required resources, such as technological equipment, but they were difficult to access. Organisations may want to consider how to surface these challenges early in set-up and whether they can provide any support to schools in overcoming them.

On a more personal note

As independent evaluators, we have a responsibility to be as objective as possible, recognise our biases, and do our best to minimise their influence on our work. We are also all researchers who care deeply about improving outcomes for pupils and furthering our understanding of ‘what works’ to support pupil development. When we are able to take the ‘evaluator hat’ off, this team also broadly supports the inclusion of arts in the school day, and some of us have direct experience of delivering arts-based learning opportunities either in the school day or extended learning space. We would have been thrilled to report that the programmes had a significant impact on attainment outcomes – not only to further enhance the toolkit for improving pupil outcomes, but also to secure further protection for the arts in the school day. Ultimately, we are not able to report those outcomes, and we stand by the findings of the six reports produced. We are still supporters of arts in education and we also enthusiastically support further research in this space, as there is certainly more to learn.

A-levelling up: the thorny path back from teacher assessed grades

By Blog Editor, on 12 August 2021

By Jake Anders, Claire Crawford, and Gill Wyness
This piece first appeared on theGuardian.com.

This week’s GCSE and A level results confirmed the expectations of many who study education policy: the proportion of students achieving top grades in these qualifications has increased substantially compared to 2019, especially at A level. Students themselves should be extremely proud of their results, which were achieved under very difficult circumstances. Likewise, teachers have worked extremely hard to make the best assessment they can of their pupils’ performance. But there is no getting around the fact that these results are different – and not directly comparable with – pre-Covid results.

It is right to allow for the fact that students taking GCSEs and A levels this year and last are at a disadvantage compared to previous cohorts. In-person exams would have been next to impossible in 2020, and those assessed this year have missed significant amounts of schooling.

To deal with this, the government chose an entirely different means of measuring performance: teacher assessments. (We advocated a different approach, based on more flexible exams, in 2021.) This year’s approach has been rather more orderly than last year’s chaos, but the wide range of measures that teachers could consider – such as mock exams, in-class tests and coursework – inevitably led to variation in how schools assessed their pupils.

This year’s grades may also be capturing average or ‘best’ performance across a range of pieces of work, rather than a snapshot from one or two exams. This seems to have been particularly true at A level, where grades have immediate consequences for university entry decisions. In short, it is unsurprising that grades based on teacher assessment are higher than those based on exams alone: while some have called this grade inflation we think it’s more accurate to say that they are capturing different information.

A level grade distribution in 2019, 2020 and 2021

But given they have been presented on the same scale, the stark increase in grades compared to pre-Covid times present significant challenges for current and future cohorts.

Even making comparisons between pupils within the 2021 cohort may be challenging. Using teacher assessment is likely to have disadvantaged some students relative to others. Previous research has shown that Black Caribbean pupils are more likely than white pupils to receive a grade from their teacher below their score in an externally marked test taken at the same time. Similarly, girls have also been found to perform better at coursework, while boys do better at exams on average. Differences by gender have been particularly apparent this year, with girls seeing larger improvements in performance than boys compared to pre-pandemic.

This year’s record high scores raise challenging questions. The much larger proportion of pupils getting As and A*s at A level, for example, may lead to universities relying more heavily on alternative methods of distinguishing between applicants – such as personal statements – which have been shown to entrench (dis)advantage.

There is also the all-important question of what to do next year: are this year’s grade distributions the right starting point, or should we be looking to return to something closer to the 2019 distribution? Is it possible to go back? And would we want to?

Assuming in-person exams are feasible next year, one possibility would be to return to 2019’s system as if nothing had happened. This would probably see substantial reductions in the proportion of students getting top grades, especially at A level. One can only imagine the political challenge of trying to do this.

Even more important is that the next cohorts of GCSE and A level students (and indeed the ones that follows – we are tracking the experiences of those taking GCSEs this year as part of a new UKRI-funded cohort study, COSMO) have also been affected by the pandemic, arguably to a greater degree than this year’s. They are therefore likely to underperform their potential and get lower grades than cohorts who took their exams before the pandemic struck. That is clearly not desirable.

It is important to continue making allowances for the exceptional circumstances young people have faced during this crucial time in their education. During the period affected by pandemic learning loss, our suggestion would be to design exams with more flexibility, allowing candidates to choose which questions to answer based on their strengths, as is common in university exams. This would enable a return to the fairest way to assess students – exams – while still taking account of lost learning.

Either way, any return to exam-based grades is likely to result in an immediate pronounced drop in results compared to the last two years, especially at A level. Gavin Williamson has suggested that the government will aim instead for a “glide path back to a more normal state of affairs”. This would smooth out the unfairness of sharp discontinuities between cohorts. But it would mean moving away from grades being based on the same standard over time, instead setting quotas of students allowed to achieve each grade, gradually reducing the higher grades and increasing the lower ones. Even if that seems a good plan now, it would be very hard to stick to: the fall-out from the small reduction in pass rates seen in Scotland this week would be a taste of things to come for years.

A more radical possibility would be to reset the grading system entirely. This would get around the political issue of there being very large or deliberate small falls in grades for future cohorts, but one wonders whether this is the right time to undertake such a drastic overhaul. The pandemic will have repercussions on young people’s grades for years to come: is the best approach really a total reset right now?

The question of what to do next is one that policymakers will have to grapple with over the coming months and years. Of more fundamental importance and urgency, however, is that pupils have experienced widespread learning losses due to the pandemic – regardless of what their grades show – and are likely to be affected by these for years. Students require ongoing support throughout the rest of their educational careers, including catch up support throughout school, college and university.

We cannot simply award them GCSE and A level grades that try to look past the learning they have lost and move on – the learning loss remains and must be addressed.

Dr Gill Wyness & Dr Jake Anders are deputy directors of the UCL Centre for Education Policy & Equalising Opportunities (CEPEO). Dr Claire Crawford is an associate professor at CEPEO.

The ‘graduate parent’ advantage in teacher assessed grades

By IOE Editor, on 8 June 2021

By Jake Anders, Lindsey Macmillan, Patrick Sturgis, and Gill Wyness

Following a disastrous attempt to assign pupil grades using a controversial algorithm, last year’s GCSE and A level grades were eventually determined using Centre Assessed Grades (CAGs) following public outcry. Now, new evidence from a survey carried out by the UCL Centre for Education Policy and Equalising Opportunity (CEPEO) and the London School of Economics finds that some pupils appear to have benefited from an unfair advantage from this approach – particularly pupils with graduate parents. As teachers will again be deciding exam grades this year, this finding serves as an important warning of the challenges involved in ensuring that a system using teacher assessments is fair.

The decision to cancel formal exams in 2020 was taken at a late stage in the school year, meaning that there was little time for the government to develop a robust approach to assessment. After a short consultation, the Department for Education (DfE) decided that pupils’ exam grades would be determined by the teacher’s assessment of pupils’ grades, including their ranking. However, to prevent grade inflation due to teachers’ overpredicting their pupils, Ofqual then applied an algorithm to the rankings to calculate final grades, based on the historical results of the school.

A level pupils received their calculated grades on results days 2020, and although Ofqual reporting showed that the calculated grades were slightly higher than 2019 across the grade range, many pupils were devastated to find their teacher assessed grades had been lowered by the algorithm. More than a third of pupils received lower calculated grades than their original teacher assessed grades. Following widespread public outcry, the calculated grades were abandoned, and pupils were awarded the grades initially assessed by teachers. This inevitably led to significant grade inflation compared to previous cohorts.

This also created a unique situation where pupils received two sets of grades for their A levels – the calculated grades from the algorithm and the teacher allocated “centre assessed grades” or “CAGs”.

While it is now well established that CAGs were, on average, higher than the algorithm-calculated grades, less is known about the disparities between the two sets of grades for pupils from different backgrounds. Understanding these differences is important since it sheds light on whether some pupils received a larger boost from the move to teacher predicted CAGs, and hence to their future education and employment prospects. It is also, of course, relevant to this year’s grading process, as grades will again be allocated by teachers.

Administrative data on the differences between calculated grades and CAGs is not currently publicly available. However, findings from a new UKRI-funded survey of young people by the UCL Centre for Education Policy and Equalising Opportunity (CEPEO) and the London School of Economics (LSE) can help us to understand the issue. The survey provides representative data on over 4000 young people in England aged between 13 and 20, with interviews carried out online between November 2020 and January 2021.

Respondents affected by the A level exam cancellations (300 respondents) were asked whether their CAGs were higher or lower than their calculated grades. The resulting data reveal stark differences in the extent to which pupils were given a boost by the decision to revert to CAGs. As shown in Figure 1, pupils with graduate parents were 17 percentage points more likely to report that their CAGs were higher than their Ofqual calculated grades.  The survey data are linked to administrative data on prior attainment at Key Stages 2 and 4, as well as demographic and background characteristics such as, free school meals status, ethnicity, SEN and English as an additional language). Even after accounting for differences between pupils across these characteristics, those with graduate parents were still 15 percentage points more likely to report having higher CAGs than calculated grades.

Figure 1. The proportion of young people reporting their CAGs were better than their calculated grades by whether or not they report that one of their parents has a university degree (left panel: raw difference; right panel: adjusted for demographic characteristics and prior attainment)


There are a number of possible explanations for these differences. First, it could be that pupils with graduate parents are more likely to attend particular types of schools which have a greater tendency to ‘over-assess’ grades. While not directly relevant to this sample, an extreme version of this are the documented cases of independent schools deliberately over-assessing their pupils, but this could also happen in less dramatic and more unconscious ways. It could, for example, be more likely among schools that are used to predicting grades as part of the process for pupils applying to highly competitive university courses, where over-prediction may help more than it hurts.

A second possibility is that graduate parents are more likely to lobby their child’s school to ensure they receive favourable assessments. Such practices are reportedly becoming more common this year, with reports of “pointy elbowed” parents in affluent areas emailing teachers to attempt to influence their children’s GCSE and A level grades ahead of teacher assessed grades replacing exams this summer.

A third possibility is that the relatively high assessments enjoyed by those with graduate parents is a result of unconscious bias by teachers. A recent review by Ofqual found evidence of teacher biases in assessment, particularly against those from SEN and disadvantaged backgrounds, while a new study from Russia showed that teachers gave higher grades to pupils with more agreeable personalities. Interestingly, we found no differences between FSM and non-FSM pupils, perhaps suggesting teachers were careful not to treat FSM pupils differently. But they may nonetheless exhibit an unconscious positive bias towards pupils from backgrounds that tend to be associated with higher educational achievement.

Our results do not afford any leverage on which of these explanations, if any, is correct. Regardless of what is behind this systematic difference, our findings show that pupils with more educated parents received an unfair advantage in their A level results last year, with potential repercussions for equality and social mobility. They also highlight this is a substantial risk for this year’s process – perhaps even more so without the expectation of algorithmic moderation: grading pupils fairly in the absence of externally set and marked assessments is setting teachers an almost impossible task.

The working paper ‘Inequalities in young peoples’ education experiences and wellbeing during the Covid-19 pandemic’ is available here.

Learn more about our project on the impact of the pandemic on young people here.

Notes
The UKRI Covid-19 funded UCL CEPEO / LSE survey records information from a sample of 4,255 respondents, a subset of the 6,409 respondents who consented to recontact as part of the Wellcome Trust Science Education Tracker (SET) 2019 survey. The SET study was commissioned by Wellcome with additional funding from the Department for Education (DfE), UKRI, and the Royal Society. The original sample was a random sample of state school pupils in England, drawn from the National Pupil Database (NPD) and Individualised Learner Record (ILR). To correct for potentially systematic patterns of respondent attrition, non-response weights were calculated and applied to all analyses, aligning the sample profile with that of the original survey and the profile of young people in England.

This work is funded as part of the UKRI Covid-19 project ES/V013017/1 “Assessing the impact of Covid-19 on young peoples’ learning, motivation, wellbeing, and aspirations using a representative probability panel”.

This work was produced using statistical data hosted by ONS. The use of the ONS statistical data in this work does not imply the endorsement of the ONS in relation to the interpretation or analysis of the statistical data. This work uses research datasets which may not exactly reproduce National Statistics aggregates.

There can be no “levelling up” without education recovery

By IOE Editor, on 3 June 2021

This blog post first appeared on the University of Bristol Economics blog.

Simon Burgess, June 2021

Yesterday saw the resignation of Sir Kevan Collins, leading the Government’s Education Recovery Programme. The pandemic has hit young people very hard, causing significant learning losses and reduced mental health; the Recovery Programme is intended to rectify these harms and to repair the damage to pupils’ futures. His resignation letter labelled as inadequate the Government’s proposal: “I do not believe that it is credible that a successful recovery can be achieved with a programme of support of this size.”

The rejection of this programme, and the offer of a funding package barely a tenth of what is needed, is hard to understand. It is certainly not efficient: the cost of not rectifying the lost learning is vastly greater than the £15billion cost (discussed below). And it is manifestly unfair, for example when compared to the enormous expense incurred to look after older people like me. The vaccination programme is a colossal and brilliant public undertaking; we need something similar to protect the futures of young people. We have also seen educational inequality widen dramatically across social groups: children from poorer families have fallen yet further behind. If we do not have a properly funded educational recovery programme, any talk of “levelling up” is just noise.

Context – Education recovery after learning loss

An education recovery plan is urgently needed because of all the learning lost during school closures. For the first few months of the pandemic and the first round of school closures, we were restricted to just estimating the learning loss. Once pupils started back at school in September, data began to be collected from online assessment providers to actually measure the learning loss. The Education Endowment Foundation is very usefully collating these findings as they come in. The consensus is that the average loss of learning is around 2-3 months, with the most recent results the most worrying.  Within that average, the loss is much greater for students from disadvantaged backgrounds, and the loss is greater for younger pupils. To give only the most recent example, the latest data shows that schools with high fractions of disadvantaged kids saw falls in test scores twice as severe as those in low-poverty schools, and that Year 1 and Year 2 pupils experienced much larger falls in attainment. Government proposals for “Recovery” spending for precisely these pupils would be next to nothing, as Sir Kevan Collins notes in his Times article today: “The average primary school will directly receive just £6,000 per year, equivalent to £22 per child”.

The Government’s proposals amount to roughly £1 billion for more small-group tutoring and around £500m for teacher development and training. I am strongly in favour of small-group tutoring, but the issue is the scale: this is nowhere near enough. It is widely reported that Sir Kevan Collins’ estimate of what was required was £15 billion, based on a full analysis of the lost learning and the mental health and wellbeing deficits that both need urgent attention. For comparison, EPI helpfully provide these numbers on education recovery spending: the figure for England is equivalent to around £310 per pupil over three years, compared to £1,600 per pupil in the US, and £2,500 per pupil in the Netherlands.

Why might the programme have been rejected? Here are some arguments:

“It’s a lot of money”

It really isn’t. An investment of £15bn is dwarfed by the cost of not investing. Time in school increases a child’s cognitive ability, and prolonged periods of missed school have consequences for skill growth. We now know that a country’s level of skills has a strong (causal) effect on its economic growth rate. This is a very, very large scale problem: all of the 13 cohorts of pupils in school have lost skills because of school closures. So from the mid-2030s, all workers in their 20s will have significantly lower skills than they would otherwise have. And for the 40 years following that, between a third and a quarter of the entire workforce will have lower skills. Lost learning, lower skills, lower economic growth, lower tax revenues. Hanushek and Woessman, two highly distinguished economists, compute this value for a range of OECD countries. For the UK, assuming that the average amount of lost learning is about half a year, their results project the present discounted value of all the lost economic growth at roughly £2,150 billion (£2.15 trillion). Almost any policy will be worthwhile to mitigate such a loss.

“Kids are resilient and the lost learning will sort itself out”

This is simply wishful thinking. We should not be betting the futures of 7 million children on this basis. Economists estimate the way that skills are formed and one key attribute of this process can be summarised as “skills beget skills”. One of the first statements of this was Heckman and co-authors, and more recent researchers have confirmed this, and also using genetic data. This implies that if the level of skills has fallen to a lower level, then the future growth rate of skills will also be lower, assuming nothing else is done. It is also widely shown that early investments are particularly productive. Given these, we would expect pupils suffering significant learning losses to actually fall further behind rather than catch up. Sir Kevan Collins makes exactly this point in his resignation letter: “learning losses that are not addressed quickly are likely to compound”.

Perhaps catch-up can be achieved by pupils and parents working a bit harder at home? There is now abundant evidence from many countries including the UK that learning at home is only effective for some, typically more advantaged, families. For other families, it is not for want of trying or caring, but their lack of time, resources, skills and space makes it very difficult. The time for home learning to make up the lost learning was March 2020 through March 2021; if it was only patchily effective then, it will be less effective from now on.

“There’s no evidence to support these interventions”

This is simply not true, as I set out when recommending small-group tutoring last summer. There is abundant evidence that small-group tutoring is very effective in raising attainment. There is also strong evidence that lengthening the school day is also effective.

Conclusion

This blog is less scientifically cold and aloof than most that I write. I struggle to make sense of the government’s proposals to provide such a half-hearted, watered-down recovery programme, to value so lightly the permanent scar on pupil’s futures. The skills and learning of young people will not magically recover by itself; the multiple blows to mental health and wellbeing will not heal if ignored. The Government’s proposal appears to have largely abandoned them. To leave the final words to Sir Kevan Collins: I am concerned that the package announced today betrays an undervaluation of the importance of education, for individuals and as a driver of a more prosperous and healthy society.