X Close

Centre for Education Policy and Equalising Opportunities (CEPEO)

Home

We create research to improve the education system and equalise opportunities for all.

Menu

Archive for the 'Adulthood' Category

The 2021 Autumn Budget and Spending Review: what does it mean for educational inequalities?

By Blog Editor, on 28 October 2021

Claire Crawford

The pandemic has disrupted life for everyone, but children and young people have seen perhaps the biggest changes to their day-to-day lives, with long periods spent away from school and their friends leading to significant rises in mental health difficulties and a substantial reduction in learning. Moreover, these challenges have not been felt equally: the evidence suggests that the pandemic has also led to a rise in inequalities between children from different socio-economic backgrounds, from the early years through to secondary school and beyond.

A budget and multi-year spending review delivered against a backdrop of the highest peace-time borrowing levels ever, and by a chancellor on a ‘moral’ mission to limit the size of the state, was unlikely to deliver the sort of investments in education that Sir Kevan Collins hoped to see when he took the role of ‘catch-up tsar’ earlier this year. But what did it deliver for education? And is it likely to help roll back the rises in educational inequalities that the pandemic has generated?

Early years

While it is positive to see some recognition of the need for a higher funding rate to be paid to early education providers to cover the delivery of the early education entitlements for 2, 3 and 4 year olds, the amount earmarked – £170m in 2024-25 – does not represent the substantial investment that many in the sector have been calling for: certainly nowhere near the £2.60 per hour increase that was estimated to be needed to fully fund the entitlement, enabling providers to deliver these hours without incurring a loss, or by charging for ‘extras’ (such as food or nappies) or increasing fees for other children in order to cover costs.

We await the details of exactly what this means for the official funding rate per hour. Still, for some idea of scale, spending on all early education entitlements – the universal 15 hour entitlement for 3 and 4 year olds, the additional 15 hours for 3 and 4 year olds via the extended entitlement, and the 15 hour entitlement for disadvantaged 2 year olds – was around £3.8bn in 2019-20. 170m represents less than a 5% increase on this figure. Putting it another way, in 2019-20, a total of around 1.75 million children were benefitting from each of the free early education entitlements. If the number of children taking up these places was to remain unchanged between 2019-20 and 2024-25, this suggests that early education providers would only receive around £100 per year more per child than they do now. In reality, the population of 2, 3 and 4 year olds is expected to fall over the next few years, which – when coupled with the reduction in take-up of the early education entitlements that we have seen over the course of the pandemic – may mean that the actual increase in funding rates is higher than 5%. But not much higher.

Likewise, while greater investment in family support services is also welcome, the much-trumpeted £500m increase represents less than half of the reduction in spending on Sure Start Children’s Centres that has taken place over the last decade, falling by over £1bn (around two thirds) in real-terms from a peak of around £1.8bn in 2009-10. A start, perhaps, but not the transformative ‘Start for Life’ that the rhetoric surrounding this announcement would suggest.

Schools

Yesterday’s announcements on schools were dominated by the news that school funding would return to real-terms levels last seen in 2010. Not much to write home about, you might think. But there was also only a small amount of additional money for education catch-up, including an increase in the ‘recovery premium’ – catch-up money targeted towards pupils from lower income families – for secondary school pupils. While it is positive to see funds being targeted towards the pupils most in need of support, our work has shown that the differences in remote learning experiences while schools were closed to most pupils varied substantially by socio-economic background, and whether the roughly £5bn allocated to catch-up will be enough to redress the balance is unclear. It certainly amounts to a lot less than is being spent per pupil in other countries.

Further and higher education

Despite rumours circulating in the media, the decision on the funding of higher education was kicked into the long grass yet again, with the words ‘higher education’ mentioned only three times in the Budget and Spending Review document, and more information promised “in the coming weeks”.

Meanwhile, the eye-catching nominal and real-terms increases announced for further education (FE) and skills look decidedly less generous once account is taken of the fact that we are about to experience a massive increase in the population of 16-19 year olds. The document itself acknowledges that while there will be a 28% real-terms increase in 16-19 funding in 2024-25 compared to 2019-20, this will only maintain – rather than increase – funding per student in real terms. Despite a much greater emphasis in policy discourse about the importance of further education and adult learning than we have seen in recent years, this settlement does not suggest a transformation of the fortunes of the FE sector, which caters to the majority of each academic cohort and in which young people from lower socio-economic backgrounds are over-represented.

Implications for inequalities

Perhaps contrary to expectations, yesterday’s spending review contained increases in spending for most government departments, paid for by the highest tax rises in nearly 30 years. But given the significant challenges posed by the pandemic for children and young people, the Department for Education’s budget will be only a little higher in 2024-25 than it was in 2009-10, while the Department of Health and Social Care budget will have increased by over 40%.

The thinking seems to be that children will catch-up over time anyway. But the evidence suggests that inequalities in educational attainment only increase as children get older: higher socio-economic status parents can provide more opportunities for learning – through better schools, tutoring or more academic and non-academic enrichment activities – than lower socio-economic status parents, and these investments cumulate over time, widening the gap between those from different backgrounds. The same will be true of parents’ ability to support their children to ‘catch-up’ on what they lost during the pandemic.

Without significant government investment to support children from more disadvantaged backgrounds, the wider inequalities that have opened up over the course of the pandemic are likely to foreshadow even greater inequalities in future. Yesterday’s spending review offered some support – but nowhere near enough.

The dam waiting to burst? The short-term economic impact of Covid and Lockdown

By Blog editor, on 25 June 2021

By Professor Paul Gregg

Lockdown artificially closed down large parts of the economy but to understand where the economy is and will be in the next year or so, it is crucial to make a distinction between economic activity that has been lost and that which has just been delayed. To make this distinction clearer, think of Easter Bank Holidays. Easter normally falls in April but in some years it is in March. In a year when it falls in March, the economic activity for March falls sharply compared to other years, because the Bank Holidays close large parts of the economy. But correspondingly April will see higher output as the economy re-opens. There is no effect here on overall output or underlying economic performance. It is merely delayed by a month.

Lockdown has the same effect. It places a dam in the way of consumer spending, but behind the dam there is a build-up of demand that is released when Lockdown ends and the economy re-opens. This creates a surge of activity. The same can be seen in terms of vacancies. Locked down firms stopped recruiting as they weren’t trading. But staff members were still leaving to start other jobs in open sectors of the economy or leaving the labour force. The positions remain unfilled until the firm re-opens, then we have a surge as 6 months of vacancies appear at once.

There is currently an economic surge building, starting in April as the economy started to re-open but just as economic activity was artificially suppressed in Lockdown, the re-opening will artificially inflate the level of activity above the underlying level. This raises a number of key questions about where the economy is now and is heading. What is the underlying level of economic activity? How much pent-up economic activity is there to be released? Over what period will the surge occur? And what does this mean for government policy, especially for the government’s fiscal position?

Where is the economy now?

The 13 months from the end of February 2020 to the end of March 2021 saw a shortfall in economic activity of 10% compared to pre-crisis levels. April to June 2021 saw the economy start to re-open, with a mix of released activity with still partial closure, meaning rapid growth in activity. So from July, hopefully, a fully re-opened economy will see economic activity not just return to underlying levels but experience a surge from the release of the pent up demand.

The US offers a useful comparator here of underlying activity levels. It has not used Lockdowns so widely as the UK, and has not used a furlough programme to preserve employment, instead focusing on supporting the  incomes of people who lose jobs (more than in normal times).  In the US, economic activity in the first quarter of 2021 was just 1% below that of pre-crisis levels. In the absence of the crisis the economy likely would have grown, so a reasonable figure is that economic activity stands 3% below what would have happened without the crisis. The employment rate is 3% below peak levels and unemployment just over 2% higher. Note that the employment fall has been larger than the GDP fall in the US.  In the UK economic activity was down nearly 8% from pre-crisis levels in the first quarter of 2021. The US situation suggests that at most underlying activity is around 1.5% down in the UK if the artificial effects of enforced Lockdown are stripped out. This is very modest given how scary things looked last year.

How much pent-up economic activity is to come?

There are two parts to gauging the size of this pent-up demand. What has happened to disposable incomes, and the extent of excess saving from that income.

Disposable incomes are about 1.5% down on pre-crisis levels in real terms, reflecting lower employment, the effects of furlough etc. The proportion of incomes saved (the Saving Ratio) in the UK have been over 10% higher than normal since the crisis hit. So there is 10% of peoples’ annual incomes that could be spent to take savings back to normal levels. This is a bit over £3,000 per household.

Now people could consume this slowly over the lifetimes or binge-spend. Evidence from lottery wins suggest large wins see spending on durable goods like a new car but a large portion is saved. Spending more generally is unaffected. Smaller wins see proportionately more spent and less saved.  So people are likely to run this excess saving down over a couple of years and because of the relief as Lockdown ends this is likely to be front-loaded starting from April this year. In the second half of this year, therefore, we can reasonably expect the surge of spending on pubs, clubs and holidays to boost economic activity to between 5 and 6% above underlying levels or around 4% above pre-crisis levels. Then as the surge eases, next year would see no GDP growth as underlying improvements in the economy are masked by the spending surge ending.

The employment story is very different. Furlough meant that Lockdown didn’t see forced job shedding, just the effects of firms not hiring or closing down. The employment rate fell by 1.6% compared to 10% for GDP. So, the employment fall has been in line with underlying lost output but not the extra driven by forcing firms not to trade and consumers not to consume. The surge will, however, boost employment rapidly. This is already appearing in the data and unemployment should be expected to return to pre-crisis levels by the end of the year.

What does this mean for government policy?

The crisis has seen government debt rise by 20% of GDP by the end of last year, when the current deficit was £65 billion in the final quarter. The coming surge in activity, ending of furlough and other crisis spending should mean that the current deficit should evaporate. The government should be looking to post a surplus by early next year. There will also be a reduction in the debt to GDP ratio because of the boost to growth from the spending surge. The government should be then keeping the deficit below the level of growth to reduce the debt burden slowly.

This still leaves the question of what to do about the large increase in debt over the last year? The answer is absolutely nothing.

The surge in activity addresses the current deficit and around 1/3 of the increase in historic debt levels has been funded by Quantitative Easing from the Bank of England. Which leaves the Bank holding one third of all government debt. There are lots of issues about how to manage these holdings, but these do not incur interest payments or require urgent financing. These holdings are a long-term issue which means that the functional debt is 2/3 of GDP, not 100%, and this level is manageable until we are firmly past the legacy of the Covid Crisis. This will help reduce the current government budget deficit and ease the historic debt concerns enough to not return to the austerity policies of George Osbourne. It still, of course, means little room for major spending boosts.

Lessons

The economic fallout from the Covid Crisis has been much less than feared last year and the release of excess savings, resulting from Lockdown, will create a temporary economic boom in the second half of this year. The limited economic damage reflects in large part the successful management of the economic fallout by the Chancellor and stands in massive contrast to the extremely poor handing of the health crisis itself.

The Chancellor has in effect used a major fiscal stimulus to overcome the effects of Lockdown. But more interestingly Furlough, the main spending ticket, acted as a highly targeted stimulus, focused on the hard-hit sectors. This then stopped leakage of reduced demand to other sectors. This high degree of targeting has been rather like the German Kurzarbeit, where firms in trouble in a recession can apply for government support to put workers on part-time working. Wages are then topped up by this support but fully, as with the 80% of wages paid under Furlough. The lessons then are: Fiscal stimulus works. That it should be targeted on jobs not consumption, through say VAT cuts. Finally, it should be targeted on stressed firms, sectors or other targeting devices and provide proportionately more support for lower waged jobs. It would be good to remember these lessons for the next recession, which is due in 2031[1].


[1] Recessions have occurred every 10 years on average since 1980

The ‘graduate parent’ advantage in teacher assessed grades

By IOE Editor, on 8 June 2021

By Jake Anders, Lindsey Macmillan, Patrick Sturgis, and Gill Wyness

Following a disastrous attempt to assign pupil grades using a controversial algorithm, last year’s GCSE and A level grades were eventually determined using Centre Assessed Grades (CAGs) following public outcry. Now, new evidence from a survey carried out by the UCL Centre for Education Policy and Equalising Opportunity (CEPEO) and the London School of Economics finds that some pupils appear to have benefited from an unfair advantage from this approach – particularly pupils with graduate parents. As teachers will again be deciding exam grades this year, this finding serves as an important warning of the challenges involved in ensuring that a system using teacher assessments is fair.

The decision to cancel formal exams in 2020 was taken at a late stage in the school year, meaning that there was little time for the government to develop a robust approach to assessment. After a short consultation, the Department for Education (DfE) decided that pupils’ exam grades would be determined by the teacher’s assessment of pupils’ grades, including their ranking. However, to prevent grade inflation due to teachers’ overpredicting their pupils, Ofqual then applied an algorithm to the rankings to calculate final grades, based on the historical results of the school.

A level pupils received their calculated grades on results days 2020, and although Ofqual reporting showed that the calculated grades were slightly higher than 2019 across the grade range, many pupils were devastated to find their teacher assessed grades had been lowered by the algorithm. More than a third of pupils received lower calculated grades than their original teacher assessed grades. Following widespread public outcry, the calculated grades were abandoned, and pupils were awarded the grades initially assessed by teachers. This inevitably led to significant grade inflation compared to previous cohorts.

This also created a unique situation where pupils received two sets of grades for their A levels – the calculated grades from the algorithm and the teacher allocated “centre assessed grades” or “CAGs”.

While it is now well established that CAGs were, on average, higher than the algorithm-calculated grades, less is known about the disparities between the two sets of grades for pupils from different backgrounds. Understanding these differences is important since it sheds light on whether some pupils received a larger boost from the move to teacher predicted CAGs, and hence to their future education and employment prospects. It is also, of course, relevant to this year’s grading process, as grades will again be allocated by teachers.

Administrative data on the differences between calculated grades and CAGs is not currently publicly available. However, findings from a new UKRI-funded survey of young people by the UCL Centre for Education Policy and Equalising Opportunity (CEPEO) and the London School of Economics (LSE) can help us to understand the issue. The survey provides representative data on over 4000 young people in England aged between 13 and 20, with interviews carried out online between November 2020 and January 2021.

Respondents affected by the A level exam cancellations (300 respondents) were asked whether their CAGs were higher or lower than their calculated grades. The resulting data reveal stark differences in the extent to which pupils were given a boost by the decision to revert to CAGs. As shown in Figure 1, pupils with graduate parents were 17 percentage points more likely to report that their CAGs were higher than their Ofqual calculated grades.  The survey data are linked to administrative data on prior attainment at Key Stages 2 and 4, as well as demographic and background characteristics such as, free school meals status, ethnicity, SEN and English as an additional language). Even after accounting for differences between pupils across these characteristics, those with graduate parents were still 15 percentage points more likely to report having higher CAGs than calculated grades.

Figure 1. The proportion of young people reporting their CAGs were better than their calculated grades by whether or not they report that one of their parents has a university degree (left panel: raw difference; right panel: adjusted for demographic characteristics and prior attainment)


There are a number of possible explanations for these differences. First, it could be that pupils with graduate parents are more likely to attend particular types of schools which have a greater tendency to ‘over-assess’ grades. While not directly relevant to this sample, an extreme version of this are the documented cases of independent schools deliberately over-assessing their pupils, but this could also happen in less dramatic and more unconscious ways. It could, for example, be more likely among schools that are used to predicting grades as part of the process for pupils applying to highly competitive university courses, where over-prediction may help more than it hurts.

A second possibility is that graduate parents are more likely to lobby their child’s school to ensure they receive favourable assessments. Such practices are reportedly becoming more common this year, with reports of “pointy elbowed” parents in affluent areas emailing teachers to attempt to influence their children’s GCSE and A level grades ahead of teacher assessed grades replacing exams this summer.

A third possibility is that the relatively high assessments enjoyed by those with graduate parents is a result of unconscious bias by teachers. A recent review by Ofqual found evidence of teacher biases in assessment, particularly against those from SEN and disadvantaged backgrounds, while a new study from Russia showed that teachers gave higher grades to pupils with more agreeable personalities. Interestingly, we found no differences between FSM and non-FSM pupils, perhaps suggesting teachers were careful not to treat FSM pupils differently. But they may nonetheless exhibit an unconscious positive bias towards pupils from backgrounds that tend to be associated with higher educational achievement.

Our results do not afford any leverage on which of these explanations, if any, is correct. Regardless of what is behind this systematic difference, our findings show that pupils with more educated parents received an unfair advantage in their A level results last year, with potential repercussions for equality and social mobility. They also highlight this is a substantial risk for this year’s process – perhaps even more so without the expectation of algorithmic moderation: grading pupils fairly in the absence of externally set and marked assessments is setting teachers an almost impossible task.

The working paper ‘Inequalities in young peoples’ education experiences and wellbeing during the Covid-19 pandemic’ is available here.

Learn more about our project on the impact of the pandemic on young people here.

Notes
The UKRI Covid-19 funded UCL CEPEO / LSE survey records information from a sample of 4,255 respondents, a subset of the 6,409 respondents who consented to recontact as part of the Wellcome Trust Science Education Tracker (SET) 2019 survey. The SET study was commissioned by Wellcome with additional funding from the Department for Education (DfE), UKRI, and the Royal Society. The original sample was a random sample of state school pupils in England, drawn from the National Pupil Database (NPD) and Individualised Learner Record (ILR). To correct for potentially systematic patterns of respondent attrition, non-response weights were calculated and applied to all analyses, aligning the sample profile with that of the original survey and the profile of young people in England.

This work is funded as part of the UKRI Covid-19 project ES/V013017/1 “Assessing the impact of Covid-19 on young peoples’ learning, motivation, wellbeing, and aspirations using a representative probability panel”.

This work was produced using statistical data hosted by ONS. The use of the ONS statistical data in this work does not imply the endorsement of the ONS in relation to the interpretation or analysis of the statistical data. This work uses research datasets which may not exactly reproduce National Statistics aggregates.

There can be no “levelling up” without education recovery

By IOE Editor, on 3 June 2021

This blog post first appeared on the University of Bristol Economics blog.

Simon Burgess, June 2021

Yesterday saw the resignation of Sir Kevan Collins, leading the Government’s Education Recovery Programme. The pandemic has hit young people very hard, causing significant learning losses and reduced mental health; the Recovery Programme is intended to rectify these harms and to repair the damage to pupils’ futures. His resignation letter labelled as inadequate the Government’s proposal: “I do not believe that it is credible that a successful recovery can be achieved with a programme of support of this size.”

The rejection of this programme, and the offer of a funding package barely a tenth of what is needed, is hard to understand. It is certainly not efficient: the cost of not rectifying the lost learning is vastly greater than the £15billion cost (discussed below). And it is manifestly unfair, for example when compared to the enormous expense incurred to look after older people like me. The vaccination programme is a colossal and brilliant public undertaking; we need something similar to protect the futures of young people. We have also seen educational inequality widen dramatically across social groups: children from poorer families have fallen yet further behind. If we do not have a properly funded educational recovery programme, any talk of “levelling up” is just noise.

Context – Education recovery after learning loss

An education recovery plan is urgently needed because of all the learning lost during school closures. For the first few months of the pandemic and the first round of school closures, we were restricted to just estimating the learning loss. Once pupils started back at school in September, data began to be collected from online assessment providers to actually measure the learning loss. The Education Endowment Foundation is very usefully collating these findings as they come in. The consensus is that the average loss of learning is around 2-3 months, with the most recent results the most worrying.  Within that average, the loss is much greater for students from disadvantaged backgrounds, and the loss is greater for younger pupils. To give only the most recent example, the latest data shows that schools with high fractions of disadvantaged kids saw falls in test scores twice as severe as those in low-poverty schools, and that Year 1 and Year 2 pupils experienced much larger falls in attainment. Government proposals for “Recovery” spending for precisely these pupils would be next to nothing, as Sir Kevan Collins notes in his Times article today: “The average primary school will directly receive just £6,000 per year, equivalent to £22 per child”.

The Government’s proposals amount to roughly £1 billion for more small-group tutoring and around £500m for teacher development and training. I am strongly in favour of small-group tutoring, but the issue is the scale: this is nowhere near enough. It is widely reported that Sir Kevan Collins’ estimate of what was required was £15 billion, based on a full analysis of the lost learning and the mental health and wellbeing deficits that both need urgent attention. For comparison, EPI helpfully provide these numbers on education recovery spending: the figure for England is equivalent to around £310 per pupil over three years, compared to £1,600 per pupil in the US, and £2,500 per pupil in the Netherlands.

Why might the programme have been rejected? Here are some arguments:

“It’s a lot of money”

It really isn’t. An investment of £15bn is dwarfed by the cost of not investing. Time in school increases a child’s cognitive ability, and prolonged periods of missed school have consequences for skill growth. We now know that a country’s level of skills has a strong (causal) effect on its economic growth rate. This is a very, very large scale problem: all of the 13 cohorts of pupils in school have lost skills because of school closures. So from the mid-2030s, all workers in their 20s will have significantly lower skills than they would otherwise have. And for the 40 years following that, between a third and a quarter of the entire workforce will have lower skills. Lost learning, lower skills, lower economic growth, lower tax revenues. Hanushek and Woessman, two highly distinguished economists, compute this value for a range of OECD countries. For the UK, assuming that the average amount of lost learning is about half a year, their results project the present discounted value of all the lost economic growth at roughly £2,150 billion (£2.15 trillion). Almost any policy will be worthwhile to mitigate such a loss.

“Kids are resilient and the lost learning will sort itself out”

This is simply wishful thinking. We should not be betting the futures of 7 million children on this basis. Economists estimate the way that skills are formed and one key attribute of this process can be summarised as “skills beget skills”. One of the first statements of this was Heckman and co-authors, and more recent researchers have confirmed this, and also using genetic data. This implies that if the level of skills has fallen to a lower level, then the future growth rate of skills will also be lower, assuming nothing else is done. It is also widely shown that early investments are particularly productive. Given these, we would expect pupils suffering significant learning losses to actually fall further behind rather than catch up. Sir Kevan Collins makes exactly this point in his resignation letter: “learning losses that are not addressed quickly are likely to compound”.

Perhaps catch-up can be achieved by pupils and parents working a bit harder at home? There is now abundant evidence from many countries including the UK that learning at home is only effective for some, typically more advantaged, families. For other families, it is not for want of trying or caring, but their lack of time, resources, skills and space makes it very difficult. The time for home learning to make up the lost learning was March 2020 through March 2021; if it was only patchily effective then, it will be less effective from now on.

“There’s no evidence to support these interventions”

This is simply not true, as I set out when recommending small-group tutoring last summer. There is abundant evidence that small-group tutoring is very effective in raising attainment. There is also strong evidence that lengthening the school day is also effective.

Conclusion

This blog is less scientifically cold and aloof than most that I write. I struggle to make sense of the government’s proposals to provide such a half-hearted, watered-down recovery programme, to value so lightly the permanent scar on pupil’s futures. The skills and learning of young people will not magically recover by itself; the multiple blows to mental health and wellbeing will not heal if ignored. The Government’s proposal appears to have largely abandoned them. To leave the final words to Sir Kevan Collins: I am concerned that the package announced today betrays an undervaluation of the importance of education, for individuals and as a driver of a more prosperous and healthy society.

Ethnicity Pay Gaps and Getting Stupid Answers

By IOE Editor, on 4 May 2021

By Paul Gregg

The old saying is that “If you ask a stupid question, you get a stupid answer”. The government-sponsored report from the Commission on Ethnic and Racial Disparities does just this on ethnic pay gaps. The central point is about comparing like-with-like when considering access to better-paying jobs in Britain. This blog post starts with a balanced assessment of what ethnic pay gaps in Britain actually look like, before explaining why the ONS analysis that the Commission draws on gets it so wrong.

Ethnic pay gaps from the Labour Force Survey

If we estimate the average (mean) pay gap between a Black, Asian, or Minority Ethnic (BAME) person and their White counterpart, living in the same region, and with similar educational achievement, using the nationally representative Labour Force Survey (LFS) of all with positive earnings, we find an ethnic pay gap of 14%. So similarly educated BAME people from the same place earn 14% less than White people. This is almost exactly the same pay gap as that found between men and women, and for those born into less advantaged families, compared to those born to more affluent families, again given the same educational achievement. The British labour market creates massive inequality of opportunity between people achieving the same education, across ethnicity, gender, and family background.

How does this compare with the Commission findings?

So the ethnic pay gap comparing like with like is 14%. So how on earth did the Commission come up with a 2.3% gap? There are two major parts to this.

The first is region people live in. The ONS report that the Commission draws on does not compare people in the same region. But ethnic minorities are not evenly spread across the country. They live disproportionately in London, the South East and major cities like Birmingham and Manchester. These are areas with higher pay but also higher living costs, especially in terms of housing costs. This 2.3% gap is comparing pay of BAME groups living in high-cost London to White populations living in low-cost Wales and the North East of England etc. This doesn’t make sense. One approach to make this more comparable would be to adjust for housing costs of where people live, but the easier approach is to compare BAME Brummies to White Brummies, and BAME Londoners to White Londoners – i.e. to compare BAME and White people living in the same region. Instead, this study gives a region-by-region breakdown of the ethnic pay gap, which is indicative of a pay gap between white and BAME groups, irrespective of where people live, of around 7%. This is one step closer to a balanced assessment but was not headline given by the Commission.

Well Paid Jobs

The second issue needs a little more explanation. Britain’s jobs have a wide distribution of pay levels. The minimum wage means that pay differences at the bottom are not that great. Pay of the person in the middle of the pay distribution was £13.68 Per Hour in 2020 (pre-pandemic). This is where ½ the employed population earn more and half less – the median.  Low paid people earn between £8.50 and £9 per hour (so a little above 60% of the median). One quarter earns more than 1.5 times this median figure, 10% earn more than 3 times this, and 5% more than 7 times. In other words, there are a small minority of jobs with extremely high pay. These are in law, business, and finance predominantly.

The ONS analysis which the Commission draws so heavily on, completely ignores access to these top jobs, because it measures pay gaps using– the pay gap between the person in the middle of the White earning distribution and the middle of the BAME one. This excludes differences in access to high paying jobs from the analysis. The average based on the mean (which is what all people think of as the average) rather than median, assesses the gap across all jobs. Doing this moves the pay gap from 7% or so for people in the same regions to 13%. Surely any assessment of disparities in opportunity would include access to the elite jobs in society as well as more typical jobs. It has to – to do otherwise is just stupid. The point is well made in the report in looking at BAME groups in the Civil Service (Figure 9, p12). Across departments as a whole, about 15% of staff are from BAME groups. But in senior roles, the number is half of this. Ethnic minorities of equal educational attainment systematically do not get opportunities leading to Britain’s higher-paying jobs.

Education

Educational achievement, as highlighted by the Commission report, has been a huge success story, educational levels in the BAME community are now a little higher than in the White population. Adjusting for this too, to compare Black and White with the same education to look at disparities in opportunities, pushes the pay gap up a little further to 14%. Comparing individuals with the same education, therefore, is making very little difference to the pay gap, as you would expect. The inequalities of opportunity lie beyond education in the labour market.

Britain’s ethnic minorities are well educated but are not progressing in the labour market to the highest paid jobs.  Yet a key report on ethnic disparities in opportunities chooses to assess pay gaps in a way that ignores this entirely. How stupid is that?

The challenges of COVID-19 for young people need a new cohort study: introducing COSMO 

By IOE Editor, on 23 April 2021

Jake Anders and Carl Cullinane 

The COVID-19 pandemic and its impact is a generation-defining challengeOne of its most concerning aspects, particularly in the long term, is the already profound effect it has had on young people’s lives. Disruption to their development, wellbeing and education could have substantial, long-lasting effects on later life chances, particularly for those from lower-income homesEvidence is already showing disadvantaged pupils lagging 5 months behind their peers. This poses a unique challenge for educational policy and practice, with the scale of the disruption requiring solutions to match that scale.  

In order to address these impacts, it is vital that we fully understand these effects, and in particular, the disproportionate burden falling on those from certain groups, including those from lower socio-economic backgrounds and minority ethnic groups. This needs high-quality data. Recovering from the effects of the past 12 months will be a longterm project, and to reflect this we need research of similar ambition. 

The COVID Social Mobility and Opportunity Study (COSMO for short), launched today, seeks to play this role, harnessing the power of longitudinal research to capture the experiences of a cohort of young people for whom the pandemic has had an acute impact, and its effects on their educational and career trajectories. 

This country has a grand tradition of cohort studiesincluding the pioneering 1958 National Child Development Study and the 1970 British Cohort StudySuch studies are a key tool in understanding life trajectories and the complex factors that shape them. And they are particularly vital when it comes to measuring the impact of events that are likely to last through someone’s life course. The existing longitudinal studies, including those run by our colleagues in the UCL Centre for Longitudinal Studies, have played a huge role in understanding the impacts of the pandemic on society in the last year. 

But there is a key gap in the current portfolio of cohort studies: and that is the generation of young people at the sharp end of their school education, who would have taken GCSEs this summer, and within a matter of months will be moving onto new pathways at sixth form, further education, traineeships and apprenticeships. The impacts on this group are likely to be profound and long-lasting, and understanding the complex elements that have aggravated or mitigated these impacts is crucial. 

A variety of studies have already collected some such data, providing emerging evidence of inequalities in pupils’ outcomes and experiences of remote schooling. This has highlighted alarming challenges for pupils’ learning and wellbeing. However, to develop a full understanding we require the combination of rich, representative, survey data on topics such as learning loss experiences, wellbeing, and aspirations, linked with administrative data on educational outcomes, and concurrent interventions. We also need to follow up those young people over the next few years as they pass through key stages of education and their early career, to understand what has happened next, ideally long into their working lives. 

Such evidence will be key in shaping policies that can help to alleviate the longterm impacts on young people. Which groups have suffered most and how, how long will these impacts persist, and how can we reduce their effect. These will be fundamental questions for national policymakers, education providers, employers and third sector organisations in the coming years, both in the UK and internationally. 

That’s why we’re extremely excited to be launching COSMO with funding from UK Research and Innovation (UKRI)Ideas to Address COVID-19 response fundOur study will deliver exactly that data over the coming years, helping to inform future policy interventions that will be required, given that the huge effects of the pandemic are only just beginning. As the British Academy pointed out on the anniversary of the first COVID lockdown – this is not going to go away quickly. 

Beginning this autumn, the study will recruit a representative sample of 12,000 current Year 11 pupils across England, with sample boosts for disadvantaged and ethnic minority groups plus targeting of other hard-to-reach groups. Young person, parent, and school questionnaires – enhanced with administrative data from DfE– will collect rich data on young people’s experiences of education and wellbeing during the past challenging 12 months, along with information on their transitions into post-16 pathways via this summer’s unusual GCSE assessment process. 

The study is a collaboration between the UCL Centre for Education Policy & Equalising Opportunities (CEPEO), the UCL Centre for Longitudinal Studies (CLS) and the Sutton Trust. The study will harness CEPEO’s cutting-edge research focused on equalising opportunities across the life course, seeking to improve education policy and wider practices to achieve this goal. The Sutton Trust also brings 25 years of experience using research to inform the public and achieve policy change in the area of social mobility.  

COSMO will also be part of the family of cohort studies housed in the UCL Centre for Longitudinal Studies, whose expertise in life course research is world-renowned. We are also working closely with Kantar Publicwho will lead on delivering the fieldwork for this large study, alongside NatCen Social Research. More broadly still, all our work will be co-produced with project stakeholders including the Department for Education and the Office for Students. We are also working with partners in Scotland and Wales to maximise comparability across the nations. 

We are excited for COSMO to make a big contribution both to the landscape of educational research and to the post-pandemic policy environment, and we are delighted to be getting to work delivering on this promise over the coming years. 

We won’t reduce inequalities in post-16 progression until we make ‘lower attainers’ more visible

By IOE Editor, on 29 March 2021

By Ruth Lupton, Stephanie Thomson, Lorna Unwin and Sanne Velthuis

Inequalities in post-16 progression

The continued use of GCSEs as a blunt instrument for dividing pre-and post-16 education is one of the main causes of inequality in the English system, with impacts extending well into adulthood. The system asks the least confident, least academically successful young people, often (but not always) facing greater social and economic disadvantages, to make the most complex, life-shaping choices at the youngest age.  Contemporaries with high academic attainment can progress more straightforwardly in a simpler, better understood, and historically better-funded system, often postponing decisions about occupational directions until age 18, 19 or later.

In our new research, funded by the Nuffield Foundation, we investigated the post-16 trajectories of young people who we described as ‘lower attainers’ – the 40% of each GCSE cohort who annually do not achieve a grade 4 (formerly C) in both English and maths.  We presented our findings at a recent CEPEO webinar.

Our research employed a mixed-methods approach combining analysis of data from the National Pupil Database (NPD) and Individualised Learner Record (ILR), collection and analysis of local data about course and apprenticeship opportunities and entry requirements, and interviews and focus groups.

It shows how, in making the transition to the post-16 phase and attempting to progress beyond GCSEs, ‘lower attainers’ face multiple barriers including: inconsistent careers information and guidance; restrictive entry requirements that are often based on English and maths GCSEs (even when it is not clear why specific grades are needed); considerable local variation in accessible provision; and the low availability and poor visibility of apprenticeships. Apprenticeships are not the accessible pathway for ‘lower attainers’ that many people imagine, with only 5.8% moving into an apprenticeship at 16 in the 2015 cohort, for example.

It also shows that many young people start their post-16 phase on courses below the levels of learning they have already achieved and that learners with similar attainment at 16 enter the post-16 phase at different levels in different places, partly due to local differences in the mix of provision and institutional practices. This has potential repercussions for the achievement of Level 2 and Level 3 qualifications between 16 and 18/19.

Making the problems and solutions more visible

All this points to a complex and locally variable picture that needs to be better understood.  But achieving clarity and understanding is very difficult due to the way attainment is measured and administrative data is collected, organised and made accessible.

Published statistics do not make the achievements and trajectories of lower attaining young people very visible, probably because much of the policy focus to date has been on raising KS4 attainment at the standard benchmarks. Coverage of lower-level qualifications (and of spatial variations) still lags behind.

And beyond the published statistics, there are major problems with the capacity for detailed analysis of the underlying data.

One issue is the data itself. Currently, we have two different large-scale administrative datasets for the post-16 phase – the NPD and ILR – with different definitions, variables and standards of documentation, and including different learners.  Getting access to these involves a lengthy and difficult application procedure, and working with the data to summarise what learners are doing and achieving is a painstaking process. Looking at academic routes is easier than tracking routes through vocational courses and apprenticeships because matching NPD (Key Stage 4) to NPD (Key Stage 5) is easier than matching NPD to ILR.  It is easier to look at outcomes than it is to understand progress and what learners are actually doing.  So analysis often focuses on qualifications achieved as the data is collected in this way.  We tried a different approach.  We developed a measure of a learner’s ‘main level of learning’ – the level that they were spending most of their guided learning hours on – and thus were able to illuminate progression (or not) from levels already achieved.  If the data sources were easier to access and use, much more could be done to analyse and explain course changes and progression between 16 and 19 and to understand what constitutes success and progress.

At a local level, basic information on the system in terms of the nature of provision at any given time as well as associated entry requirements is not routinely collected. To shed light on these issues, we had to collect and aggregate this information from provider and national agency websites, a labour-intensive task. The lack of available data leaves policy-makers unsighted as to what is on offer, who is missing out, and which gaps need to be plugged.

The other issue is analytic capacity.  Even if there were better data, there is a paucity of academics with interests and expertise in further education and training compared with the numbers working on school and higher education research. And we need more research teams who can combine quantitative and qualitative methods to investigate the relationship between the pre and post-16 phases. Changing this now will require not just funding for projects and centres but investment in early-career scholarship, addressing status issues and links to teaching. And there are insufficient links between people who have the skills for data analysis and practitioners who understand how the system works on the ground. Cuts to local authority funding have further diminished local capacity and intelligence.

Thus, if the characteristics and trajectories of lower attainers at GCSE are to be better understood on an ongoing basis, three substantial changes will need to be made:

  • Routine reporting of sub-benchmark achievement in more detail, and at relevant subnational scales.
  • Improvement in data infrastructure and access.
  • Increase in research and analysis capacity, both in local government and in universities and research institutes, and better links between them.

These will not be cheap.  But if the government is serious about eroding the long-standing inequalities in post-16 progression, it simply must invest in making the situation more visible.

The research reported here was funded by the Nuffield Foundation, but the views expressed are those of the authors and not necessarily the Foundation. Visit www.nuffieldfoundation.org

Vaccine hesitancy in children and young adults in England

By IOE Editor, on 17 March 2021

By Patrick Sturgis, Lindsey Macmillan, Jake Anders, Gill Wyness

Children and young people are, mercifully, at extremely low risk of death or serious illness from the coronavirus and, for this reason, they are likely to be the last demographic in the queue to be vaccinated, if they are vaccinated at all. Yet, there are good reasons to think that a programme of child vaccination against covid-19 will eventually be necessary in order to free ourselves from the grip of the pandemic. In anticipation of this future need, clinical trials assessing the safety and efficacy of existing covid-19 vaccines on young people have recently commenced in the UK.

While children and young people experience much milder symptoms of covid-19 than older adults, there is currently a lack of understanding of the long-term consequences of covid-19 infection across all age groups and there have been indications that some children may be susceptible to potentially severe and dangerous complications. Scientists also believe that immunisation against covid-19 in childhood may confer lifetime protection (£), reducing the need for large-scale population immunisation in the future.

Most importantly, perhaps, vaccination of children may be required to minimise the risk of future outbreaks in the years ahead. If substantial numbers of adults refuse immunisation and the vaccines are, as seems likely, less than 100% effective against infection, vaccination of children will be necessary if we are to achieve ‘herd immunity’.

We now know a great deal about covid-19 vaccine hesitancy in general populations around the world from a large and growing body of survey and polling data and, increasingly, from actual vaccine uptake. Much less is known, however, about vaccine hesitancy amongst children and younger adults. Here, we report preliminary findings from a new UKRI funded survey of young people carried out by Kantar Public for the UCL Centre for Education Policy and Equalising Opportunity (CEPEO) and the London School of Economics. The survey provides high quality, representative data on over 4000 young people in England aged between 13 and 20, with interviews carried out online between November 2020 and January 2021. Methodological details of the survey are provided at the end of this blog.

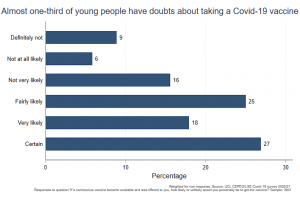
Respondents were asked, “If a coronavirus vaccine became available and was offered to you, how likely or unlikely would you personally be to get the vaccine?”. While the majority (70%) of young people say they are likely or certain to get the vaccine, this includes 25% who are only ‘fairly’ likely. Worryingly, nearly a third express some degree of vaccine hesitancy, saying that they either definitely won’t get the vaccine (9%) or are that they are not likely to do so (22%).

Although there are differences in question wording and response alternatives, this represents a substantially higher level of vaccine hesitancy than a recent Office for National Statistics (ONS) survey of UK adults, which found just 6% expressing vaccine hesitancy, although this rose to 15% amongst 16 to 29 year olds.

Differences in vaccine hesitancy across groups

 We found little variation in hesitancy between male and female respondents (32% female and 29% male), or between age groups. However, as can be seen in the chart below, there were substantial differences in vaccine hesitancy between ethnic groups. Black young people are considerably more hesitant to consider getting the vaccine than other ethnic groups, with nearly two thirds (64%) expressing hesitancy compared to just a quarter (25%) of those who self-identified as White.  Young people who identified as mixed race or Asian[1] expressed levels of hesitancy between these extremes, with a third (33%) of mixed race and 39% of Asian young people expressing vaccine hesitancy. This ordering matches the findings for ethnic group differences in the ONS survey, where 44% of Black adults expressed vaccine hesitancy compared to just 8% of White adults.

To explore potential sources of differences in vaccine hesitancy, respondents were asked to state their level of trust in the information provided by a range of different actors in the coronavirus pandemic. The chart below shows wide variability in expressed levels of trust across different sources between ethnic groups, but most notably between Black young people and those from other ethnic groups. Young people self-identifying as Black were considerably less likely to trust information from doctors, scientists, the WHO and politicians and more likely to trust information from friends and family than those from other groups. Although in terms of overall levels, doctors, scientists and the WHO are most trusted across all groups. Encouragingly, only 5% of young people say they trust information from social media, a figure which was consistently low across ethnic groups.

We also find evidence of a small social class gradient in vaccine hesitancy, with a quarter (25%) of young people from families with at least one parent with a university degree[2] expressing vaccine hesitancy compared to a third (33%) of young people with no graduate parent.

We can also compare levels of vaccine hesitancy according to how young people scored on a short test of factual knowledge about science. [3]  Vaccine hesitancy was notably higher amongst respondents who were categorised as ‘low’[4] in scientific knowledge (36%) compared to those with ‘average’ (28%), and ‘high’ (22%) scientific knowledge. This suggests that vaccine hesitancy may be related, in part, to the extent to which young people are able to understand the underlying science of viral infection and inoculation and to reject pseudoscientific claims and conspiracy theories.

How much are differences in vaccine hesitancy just picking up underlying variation between ethnic groups in scientific knowledge and broader levels of trust? In the chart below, we compare raw differences in vaccine hesitancy for young people from the same ethnic group, sex, and graduate parent status (blue plots) with differences after taking account of differences in scientific knowledge and levels of trust in different sources of information about coronavirus. The inclusion of these potential drivers vaccine hesitancy do account for all of the differences between ethnic and social class groups. While Black young people are around 40 percentage points more likely to express vaccine hesitancy than their White counterparts, this is reduced to 33 ppts when comparing Black and White young people with similar levels of scientific knowledge and (in particular) levels of trust in sources of coronavirus information.

Our survey shows high levels of vaccine hesitancy amongst young people in England, which should be a cause for concern, given the likely need to vaccinate this group later in the year. We also find substantial differences in hesitancy between ethnic groups, mirroring those found in the adult population, with ethnic minorities – and Black young people in particular – saying they are unlikely or certain not to be vaccinated. These differences seem to be related to the levels of trust young people have in different sources of information about coronavirus, with young Black people more likely to trust information from friends and family and less likely to trust health professionals and politicians.

There are reasons to think that actual vaccine take up may be higher than these findings suggest. First, Professor Ben Ansell and colleagues have found a decrease in hesitancy amongst adults between October and February, a trend which was also evident in the recent ONS survey.  It seems that hesitancy is declining amongst adults as the vaccine programme is successfully rolled out with no signs of adverse effects and this trend may also be evident amongst young people. Given that parental consent will be required for vaccination for under 18s, it may be the case that parental hesitancy is as important for take up.

There may also have been some uncertainty in our respondent’s minds about what is meant by ‘being offered’ the vaccine, given there were no vaccines authorised for young people at the time the survey was conducted and no official timetable for immunisation of this group. Nonetheless, this uncertainty cannot explain the large differences we see across groups, particularly those between White young people and those from ethnic minority groups.

If the vaccine roll out is to be extended to younger age groups in the months ahead, we will face a considerable challenge in tackling these high levels of and disparities in vaccine hesitancy.


*Methodology*

The UKRI Covid-19 funded UCL CEPEO / LSE survey records information from a sample of 4,255 respondents, a subset of the 6,409 respondents who consented to recontact as part of the Wellcome Trust Science Education Tracker (SET) 2019 survey. The SET study was commissioned by Wellcome with additional funding from the Department for Education (DfE), UKRI, and the Royal Society. The original sample was a random sample of state school pupils in England, drawn from the National Pupil Database (NPD) and Individualised Learner Record (ILR). To correct for potentially systematic patterns of respondent attrition, non-response weights were calculated and applied to all analyses, aligning the sample profile with that of the original survey and the profile of young people in England. Our final sample consists of 2,873 (76%) White, 208 (6%) Black, 452 (12%) Asian, 196 (5%) Mixed, and 50 (1%) Other ethnic groups.  The Asian group contains respondents who self-identified as Asian British, Indian, Pakistani, Bangladeshi, Chinese or ‘other Asian’.


[1] Respondents in the Asian category are a combination of Indian, Pakistani, Bangladeshi, Chinese or ‘other Asian’ origin.

[2] We have not yet liked the survey data to the National Pupil Database and Individualised Learner Records which will enable us to use an indicator of eligibility for free school meals and IDACI. Currently we use parent graduate status as a proxy for socio-economic status.

[3] Once the survey is linked to the National Pupil Database we will be able to look across a wider range of measures of school achievement.

[4] There were ten items in the quiz, ‘low’ knowledge equated to a score of 5 or less, ‘average’ knowledge to a score of 6 to 8, and ‘high’ knowledge to a score of 9 or 10. Note that this test was administered in the previous (2019) wave of the survey.

This work is funded as part of the UKRI Covid-19 project ES/V013017/1 “Assessing the impact of Covid-19 on young peoples’ learning, motivation, wellbeing, and aspirations using a representative probability panel”.

Scarring effects of Furlough

By IOE Editor, on 2 February 2021

By Professor Paul Gregg, University of Bath

The Chancellors furlough scheme is a dam holding back a torrent of unemployment. A long history of research has shown that open unemployment has sizable costs to workers after they have returned to work – called scarring. But these scarring effects will not hit all workers equally – they will primarily impact those from the younger generation due to the important role of work experience in the process.

Furlough vs unemployment

For prime-age and older workers, the main cost of unemployment comes from the dislocation from the existing job. The quality of the replacement job match is lower because a range of experience and knowledge is underused. This can be specific knowledge to the firm, industry or occupation or the seniority/responsibility in the job role. Long-term unemployment sees greater loss of application of this knowledge and experience as jobs are further away from the old position across the domains just listed. Some of this cost of dislocation is recovered by later job moves but typically not that cost associated with long-term unemployment. Here then furlough is totally different than unemployment as there is no such dislocation. This also represents the economic value of keeping so many hard hit businesses afloat. It would take a lot of time for replacement businesses to start-up and then to grow to be as productive in their use of labour as those that would be closed without furlough and other supports. These supports are thus limiting the economic destruction of productive potential that a deep recession creates.

For younger workers, the story of unemployment is less about the lost job, which are generally lower paid entry positions. Rather it is the lack of accrual of the crucial work experience which attracts pay rises and allows job moves/promotions which attract even large pay rises. A years tenure in work for a young person generates pay growth 5% above that for an older experienced worker (more after one year in a job than 5 or so and at younger ages) and a job-to-job move generates around 12%. This is how young people progress through the labour market and build careers. Older workers also get pay rises when moving jobs and at short tenures but they are less common and smaller in magnitude. Here then furlough is likely to be very similar in its effects to unemployment. People are drawing a salary but not actually gaining experience or promotion opportunities.

Thus for older workers with extensive tenure in their current post, furlough should not result in the costs of unemployment but it will disrupt the gaining of experience and potentially job moves that are so essential for young people.

The outlook for the younger generation

In a bad recession youth unemployment and the proportion of young people not in work or education often rise to 25 to 30%. Upwards of 20% accumulate substantial periods (a year or more) out of work between the ages of 18 and 25. Now furloughing of young people has been very common, partly because of the sectors at the heart of the lockdowns but also because of their lower seniority. A million young people were furloughed in early July (the earliest I have found giving an age breakdown) – some 20% of the total at that time – whilst just under another million were not in work or education. This was around 30% of all young people either on furlough or out of work and college. Among those aged 18-24 it was 35%. By the end of October young people on furlough fell to 350,000 but is no doubt higher again now. The year of Covid overall is thus likely to have seen 25% of young people not in college not gaining normal work experiences, very much in line with a normal recession.

The better news is that young people in similar situations do recover a substantial portion of these wage loses. Graduates in a normal recession do not suffer a lot of unemployment but do get work in lower status and paying occupations, losing 3% pay growth per year in a suppressed labour market (normally for 3 years after a recession). But they do see faster earnings growth after a recession ends, recouping about half the losses. This is the likely situation for today’s Covid generation of young people. Provided of course, that the end of furlough is not associated with an explosion of youth unemployment.

The policy response to youth unemployment is a programme like the new Kickstart programme to give that missing experience. But whilst good number of places are promised by firms, there have been nearly no actual starts because of Lockdown. This can’t help until furlough ends. Rather it is making sure of a strong recovery from the Summer that is the only prescription that can limit the damage of lost work experience of young people through the pandemic.

Where We Are after Lockdown 2: Time to move from Crisis Management to a Recovery Plan

By IOE Editor, on 1 December 2020

By Professor Paul Gregg, University of Bath

The last two weeks have revealed that the government has woken up to the reality of the nature of pandemic and its economic effects. The most immediate shift has been to recognise that in the absence of substantial downward pressure on socialising the virus spreads exponentially. The massive error behind Lockdown 2 was the Summer return to almost normality, just no festivals. Indeed, the government actively encouraged people to return to restaurants and pubs helping to drive infection rates back up, which again they were way too slow to respond too. As soon as Lockdown 1 ended, the return was inevitable as insufficient downward force was being applied, given the track and trace system never really got off the ground. After Lockdown 2, we will not be all Christmas parties and New Year celebrations with almost none of the country in tier 1. Many areas, like my home city, went into Lockdown 2 in tier 1 and will emerge in tier 3. It will have to be a cool quiet mid-Winter this time to stop Lockdown 3 being the result. The government is now looking to suppress the virus till vaccines are available in sufficient quantity, which plans announced suggest will be around March.

What are the economic costs?

Furlough has been extended to cover this period as the only current alternatives are very unpalatable – letting the virus rip uncontrolled or business restrictions without government support and thus mass job losses. The Bank of England has allowed this extension to March to be possible through further Quantitative Easing (QE) buying up government debt. The government’s attempts to reduce spending by reducing financial support in plans announced in the late summer and early autumn are the can that has been kicked down the road again. So the government is now trapped in the current spending scenario until there’s an endgame from vaccines.

The state of the economy in September, before local lockdowns, became widespread and Lockdown 2, was 8.5% below its pre-Covid peak. This was the peak of re-opening the economy. Obviously, this high point of openness in the economy will not be reached again now until April at the earliest. In March 2021, one year on from the start of the pandemic, the economy will still be 10% down. Only the Great Depression compares with this. Without the government Furlough scheme, with its massive costs, 10% lower GDP would mean 10% lower employment, as firms cannot hold staff when under such extreme pressure. Unemployment would be heading to 14% and could have been worse if fear of these job losses drives down consumer spending.

Somewhat less obvious is the realisation that the recovery will be protracted. It will be late Summer 2022 before the economy is back to peak levels and more importantly, the prognosis now is we never get back the two and half years of lost growth. This economic cost will translate into lost wages from the downward pressure of unemployment and low productivity growth as businesses are not investing (see the useful Resolution Foundation report on the Autumn Statement). What has not been highlighted enough is that we are not all in this together. This pain will only fall on those below retirement age. The triple lock on the state pension and more importantly DB occupational pensions being linked to inflation (in most cases the generous RPI measure) means little change in current pensioner incomes from the virus. Only those reliant on earnings now will suffer, but of course, when those aged 50 or less reach retirement their pension pots will have been reduced from less being put in. The under 50s will lose out twice over.

Implications

The job preservation strategy behind the furlough scheme has massive value but also limitations which will be increasingly obvious and unjust on those not in work. We are putting huge amounts of resources into holding jobs open but next to nothing to help those who fall out of work.
This is being made clear by the last labour market data and will be even more so by the next instalment. Mass job losses are being stemmed by furlough but there is a moderate but steady decline in employment. Jobs are seeping rather than flooding out of the economy. Over ½ million fewer working-age people were in work in September than in February – that’s one and a half percent of all employment or 70,000 a month. Redundancy levels suggest things are accelerating. January to March 2020 saw 30,000 redundancies a month, April to June 44,000, July to September 100,000. The rapid increases for 3-month averages that have occurred every month suggest that September alone saw around 150,000 redundancies as the generosity of furlough was reduced.

But the rise in unemployment is being driven as much by the inability of those losing work to get back into employment. Vacancies fell to 40% of pre-Covid levels in Lockdown 1 but recovered to a bit under 70% before we closed much of the economy again. Lockdown 2 and tight restrictions that follow will mean low vacancy levels through till April. This combination of job loss and especially restricted re-entry always hurts the young most. Of the ½ million falls in employment more than half (270,000) comes from 16-24-year-olds. But large numbers have elected to stay in education as a result of fewer job opportunities, pegging the increase in the unemployment rate to 3% (for 35-64 it is up 0.4%). 270k fewer in work but only an extra 100k unemployed. The youth are doing the sensible thing and have been supported in this by the government and universities, but this trend won’t continue as most courses have started now.
But the deeper point is that the vast bulk of government efforts are on job preservation in struggling industries not new jobs in the rest of the economy- saving jobs for those in work but the little drive for new ones for those without. Kickstart, even after the proposed expansion, cannot start fully start with Lockdown 2 or restrictions after December the 2nd. This programme is essentially a hiring subsidy but in a labour market that isn’t hiring. The government has so far rejected the Intermediate Labour Market (ILM) of charities and the public sector that was used under the successful Future Jobs Fund in 2009/10. The new recognition of the protracted downturn means that this needs to be re-examined.

The Autumn Statement had two very small positive announcements around green and northern investment, which with earlier infrastructure announcements brings up the government support for new job creation to around 10% of the total economic supports for the economy (mostly furlough). The imbalance though still remains massive and the result of such little focus on job creation in a protracted recession will rise in long-term unemployment (6+ moths) through until at least April 2021.

Time for the Bank to step up?

The Bank of England is drip-feeding support to the Treasury for managing debt. What we are not having is the conversation about the total envelope that will eventually be made available and what a coherent strategy for its use would look like. What is needed is for them to be asked to fund a serious plan for the investment in green industries and housing etc, not just saving the pubs. And the government needs to have a plan on how to do it. We are still in crisis mode rather than recovery planning. The Bank of England needs to adjust its thinking and urgently – it is them, not the Treasury that is the problem here.

The crunch has been delayed and the government hopes it can keep furlough going till there is a Covid endgame. Meanwhile, we are likely to be shedding 100,000 jobs a month with few ways back in for those without work and no plan for an economic recovery, beyond re-opening pubs.