 Close
Close

Vintage space: Venus in 1991
By Oli Usher, on 28 July 2015
On 5 May 1989, the Space Shuttle Atlantis released the Magellan probe into low Earth orbit.
A short while later, Magellan’s rockets fired, sending it towards the sun.
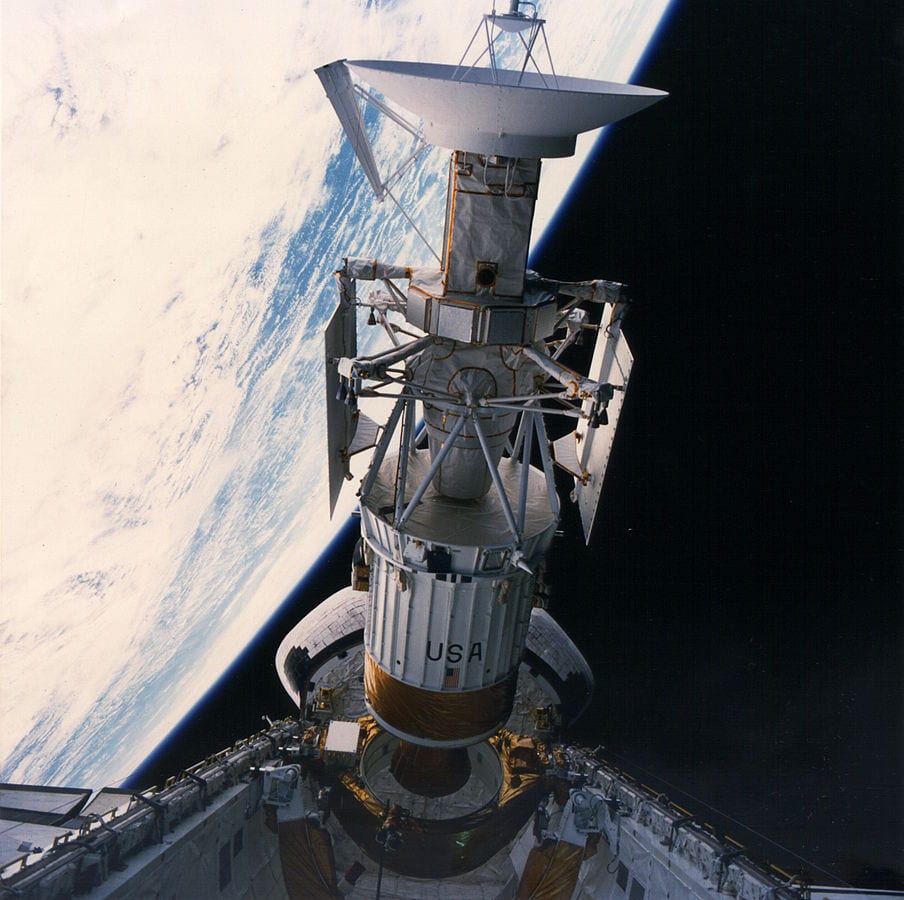
Magellan being deployed from the Space Shuttle Atlantis on 5 May 1989. Credit: NASA
Swinging around our star, it arrived at its destination 15 months later: the planet Venus.
Venus is in some respects the most Earth-like planet in the Solar System. It is a similar size to our planet, has a rocky surface and a thick cloudy atmosphere. However, it is much closer to the sun, and thanks to its atmosphere, experiences a powerful greenhouse effect.
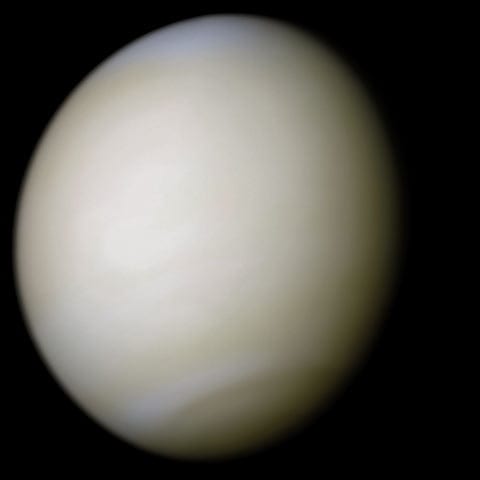
The planet Venus, seen by Mariner 10. Credit: NASA (processing by Ricardo Nunes)
Surface temperatures there are well over 400 degrees Celsius, atmospheric pressure is similar to what submersibles experience a kilometre down into Earth’s oceans, and the ‘air’ of Venus’ atmosphere is full of sulphuric acid.
Exploration of Venus’ surface has been in the form of brief snapshots, taken in the few tens of minutes that landers survive the harsh conditions there. All the landers so far have been Soviet; UCL has a number of their photos in its Centre for Planetary Sciences’ image archive (with a selection available online in high resolution).

The surface of Venus seen by the Venera 13 probe. Credit: UCL RPIF
Observing Venus from space is less challenging – and less rushed.
Between 1990 and 1994, Magellan was able to study the planet’s surface at leisure from its position high above the atmosphere. Because of the thick clouds, its images had to be produced by radar rather than optical photography, so they are not in colour. But they are extremely sharp.
Here is one of these images, held in UCL’s archives:
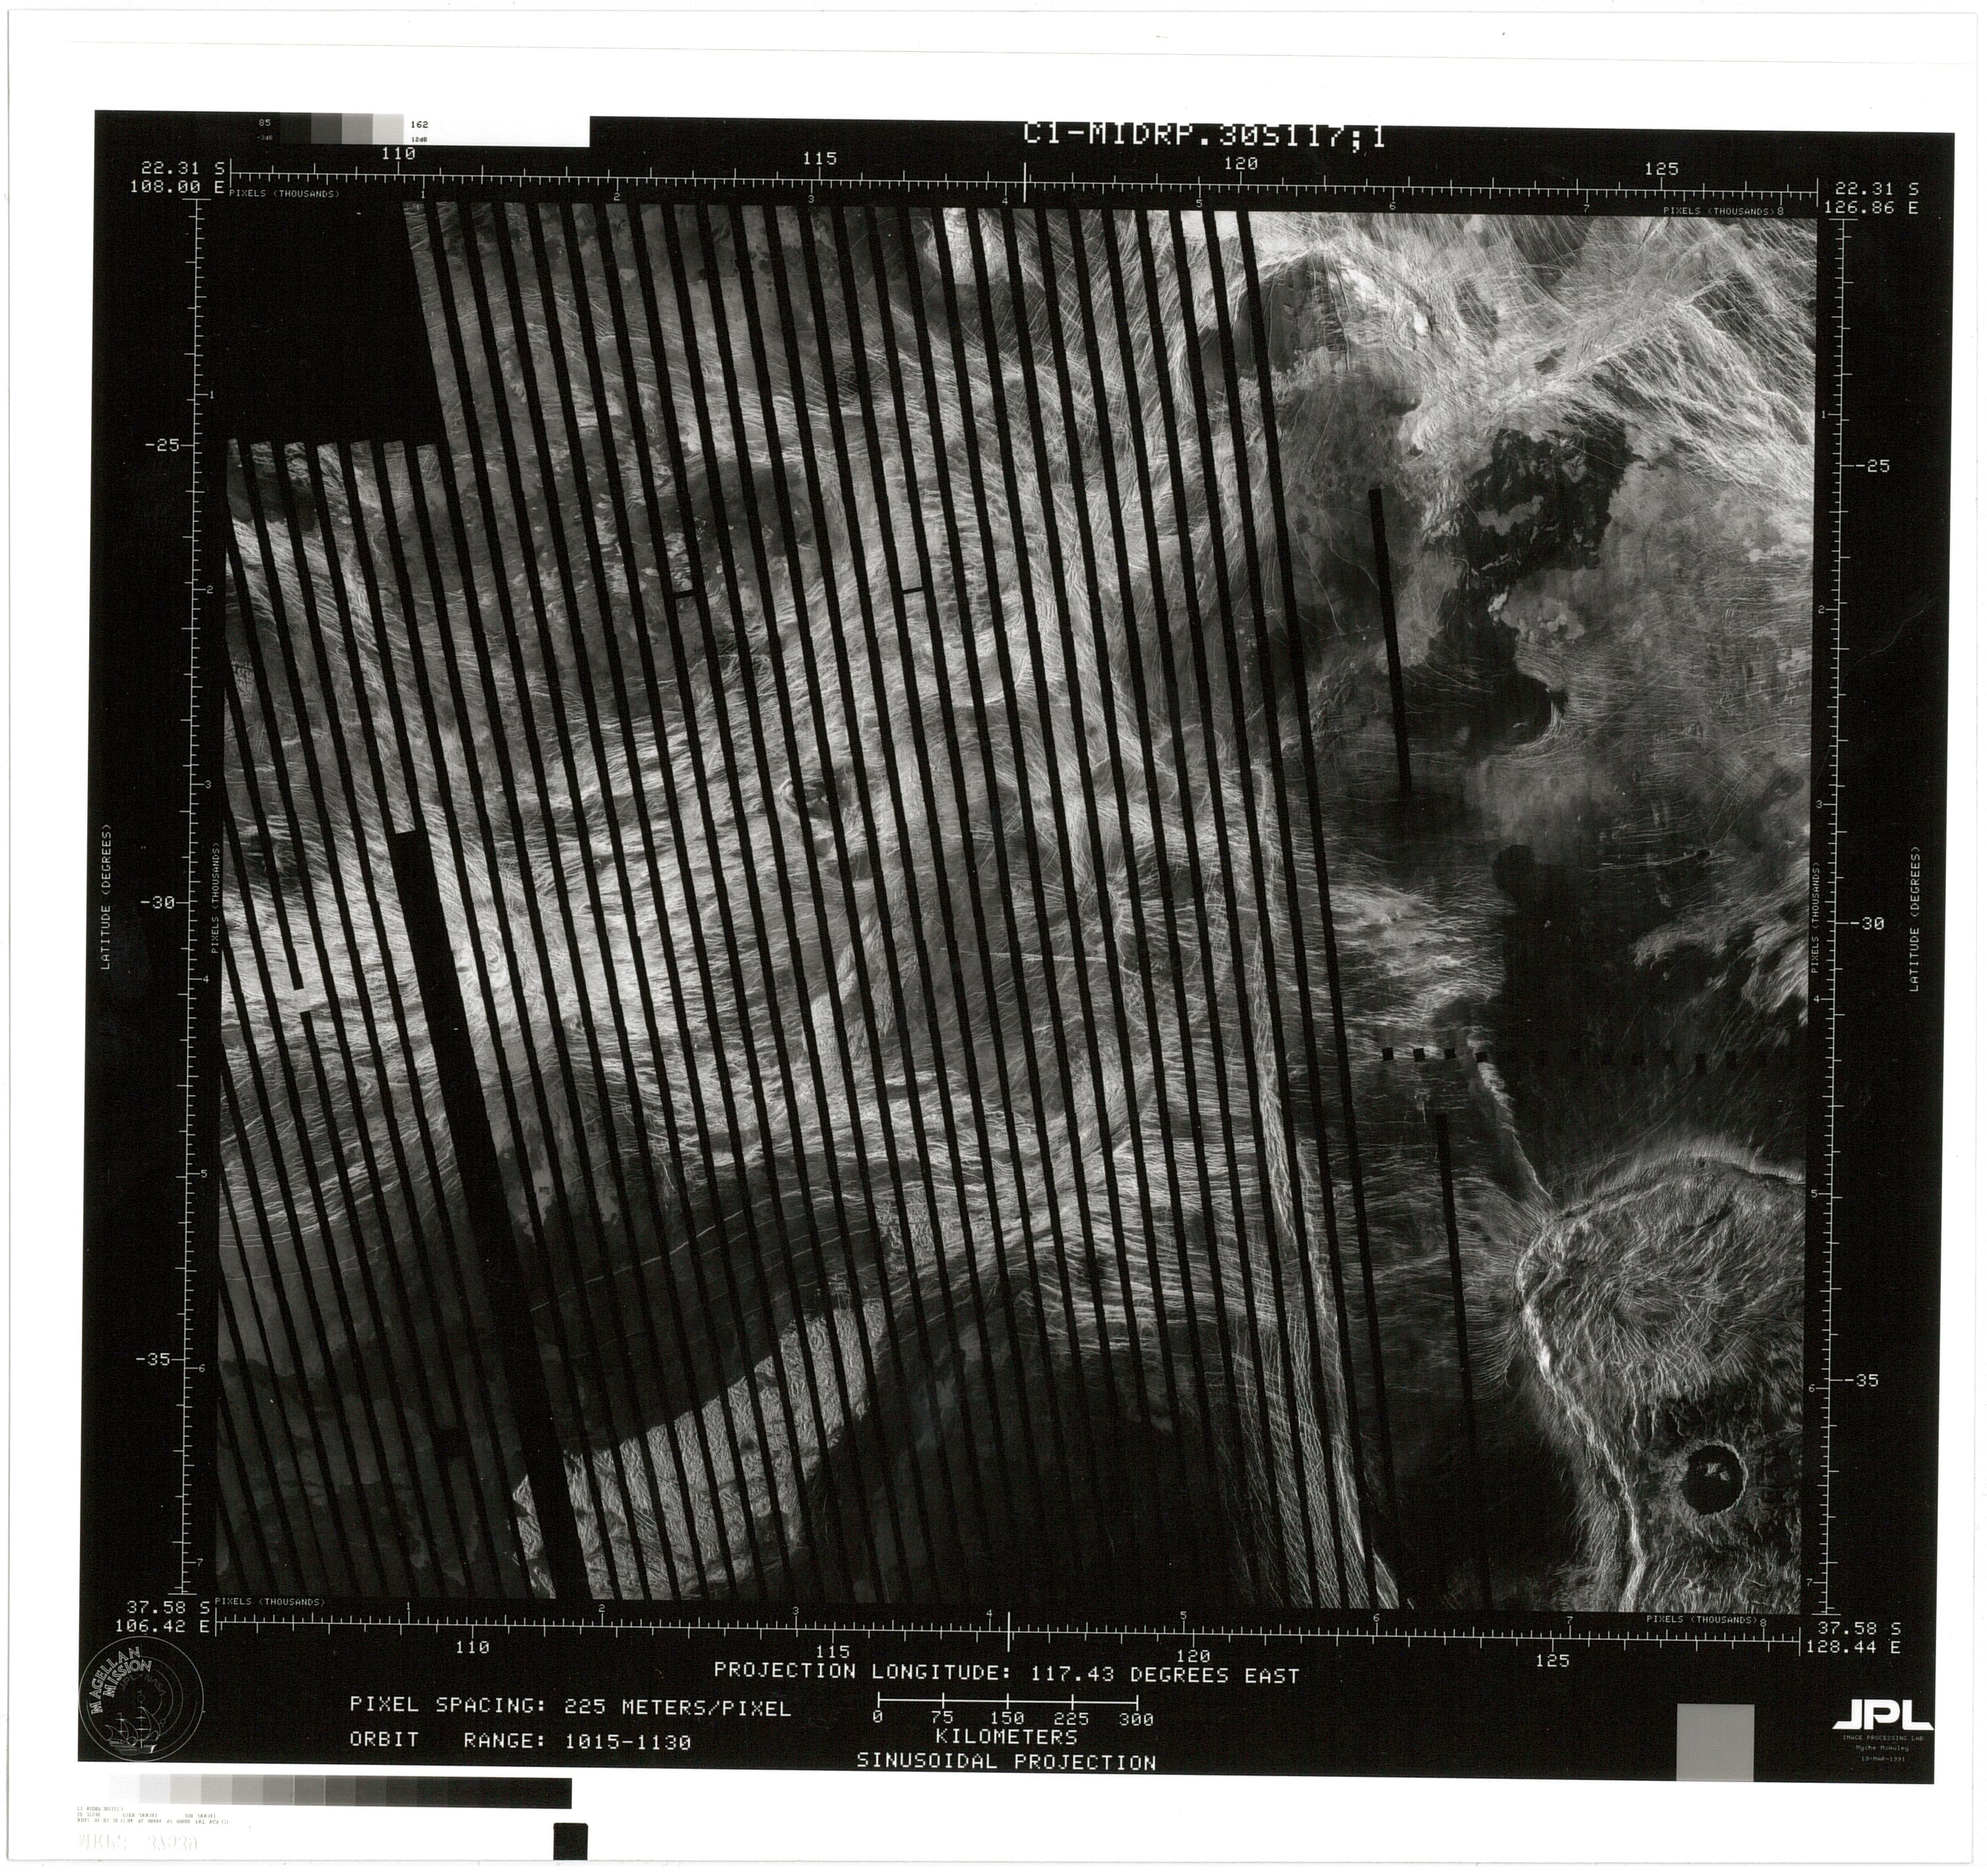
One of Magellan’s radar images of Venus’ surface. (The image is squint in the original!). Credit: UCL RPIF
Most of the highly processed images from Magellan are produced by multiple passes of the spacecraft over the planet’s surface, building up a complete image of the surface. This particular picture, however, is incomplete, revealing how Magellan’s images are put together. The black stripes show the gaps between the strips observed during different orbits of the planet.
Also in UCL’s archives are some of the planning documents NASA produced as part of the mission, including this full map of the planet’s surface:
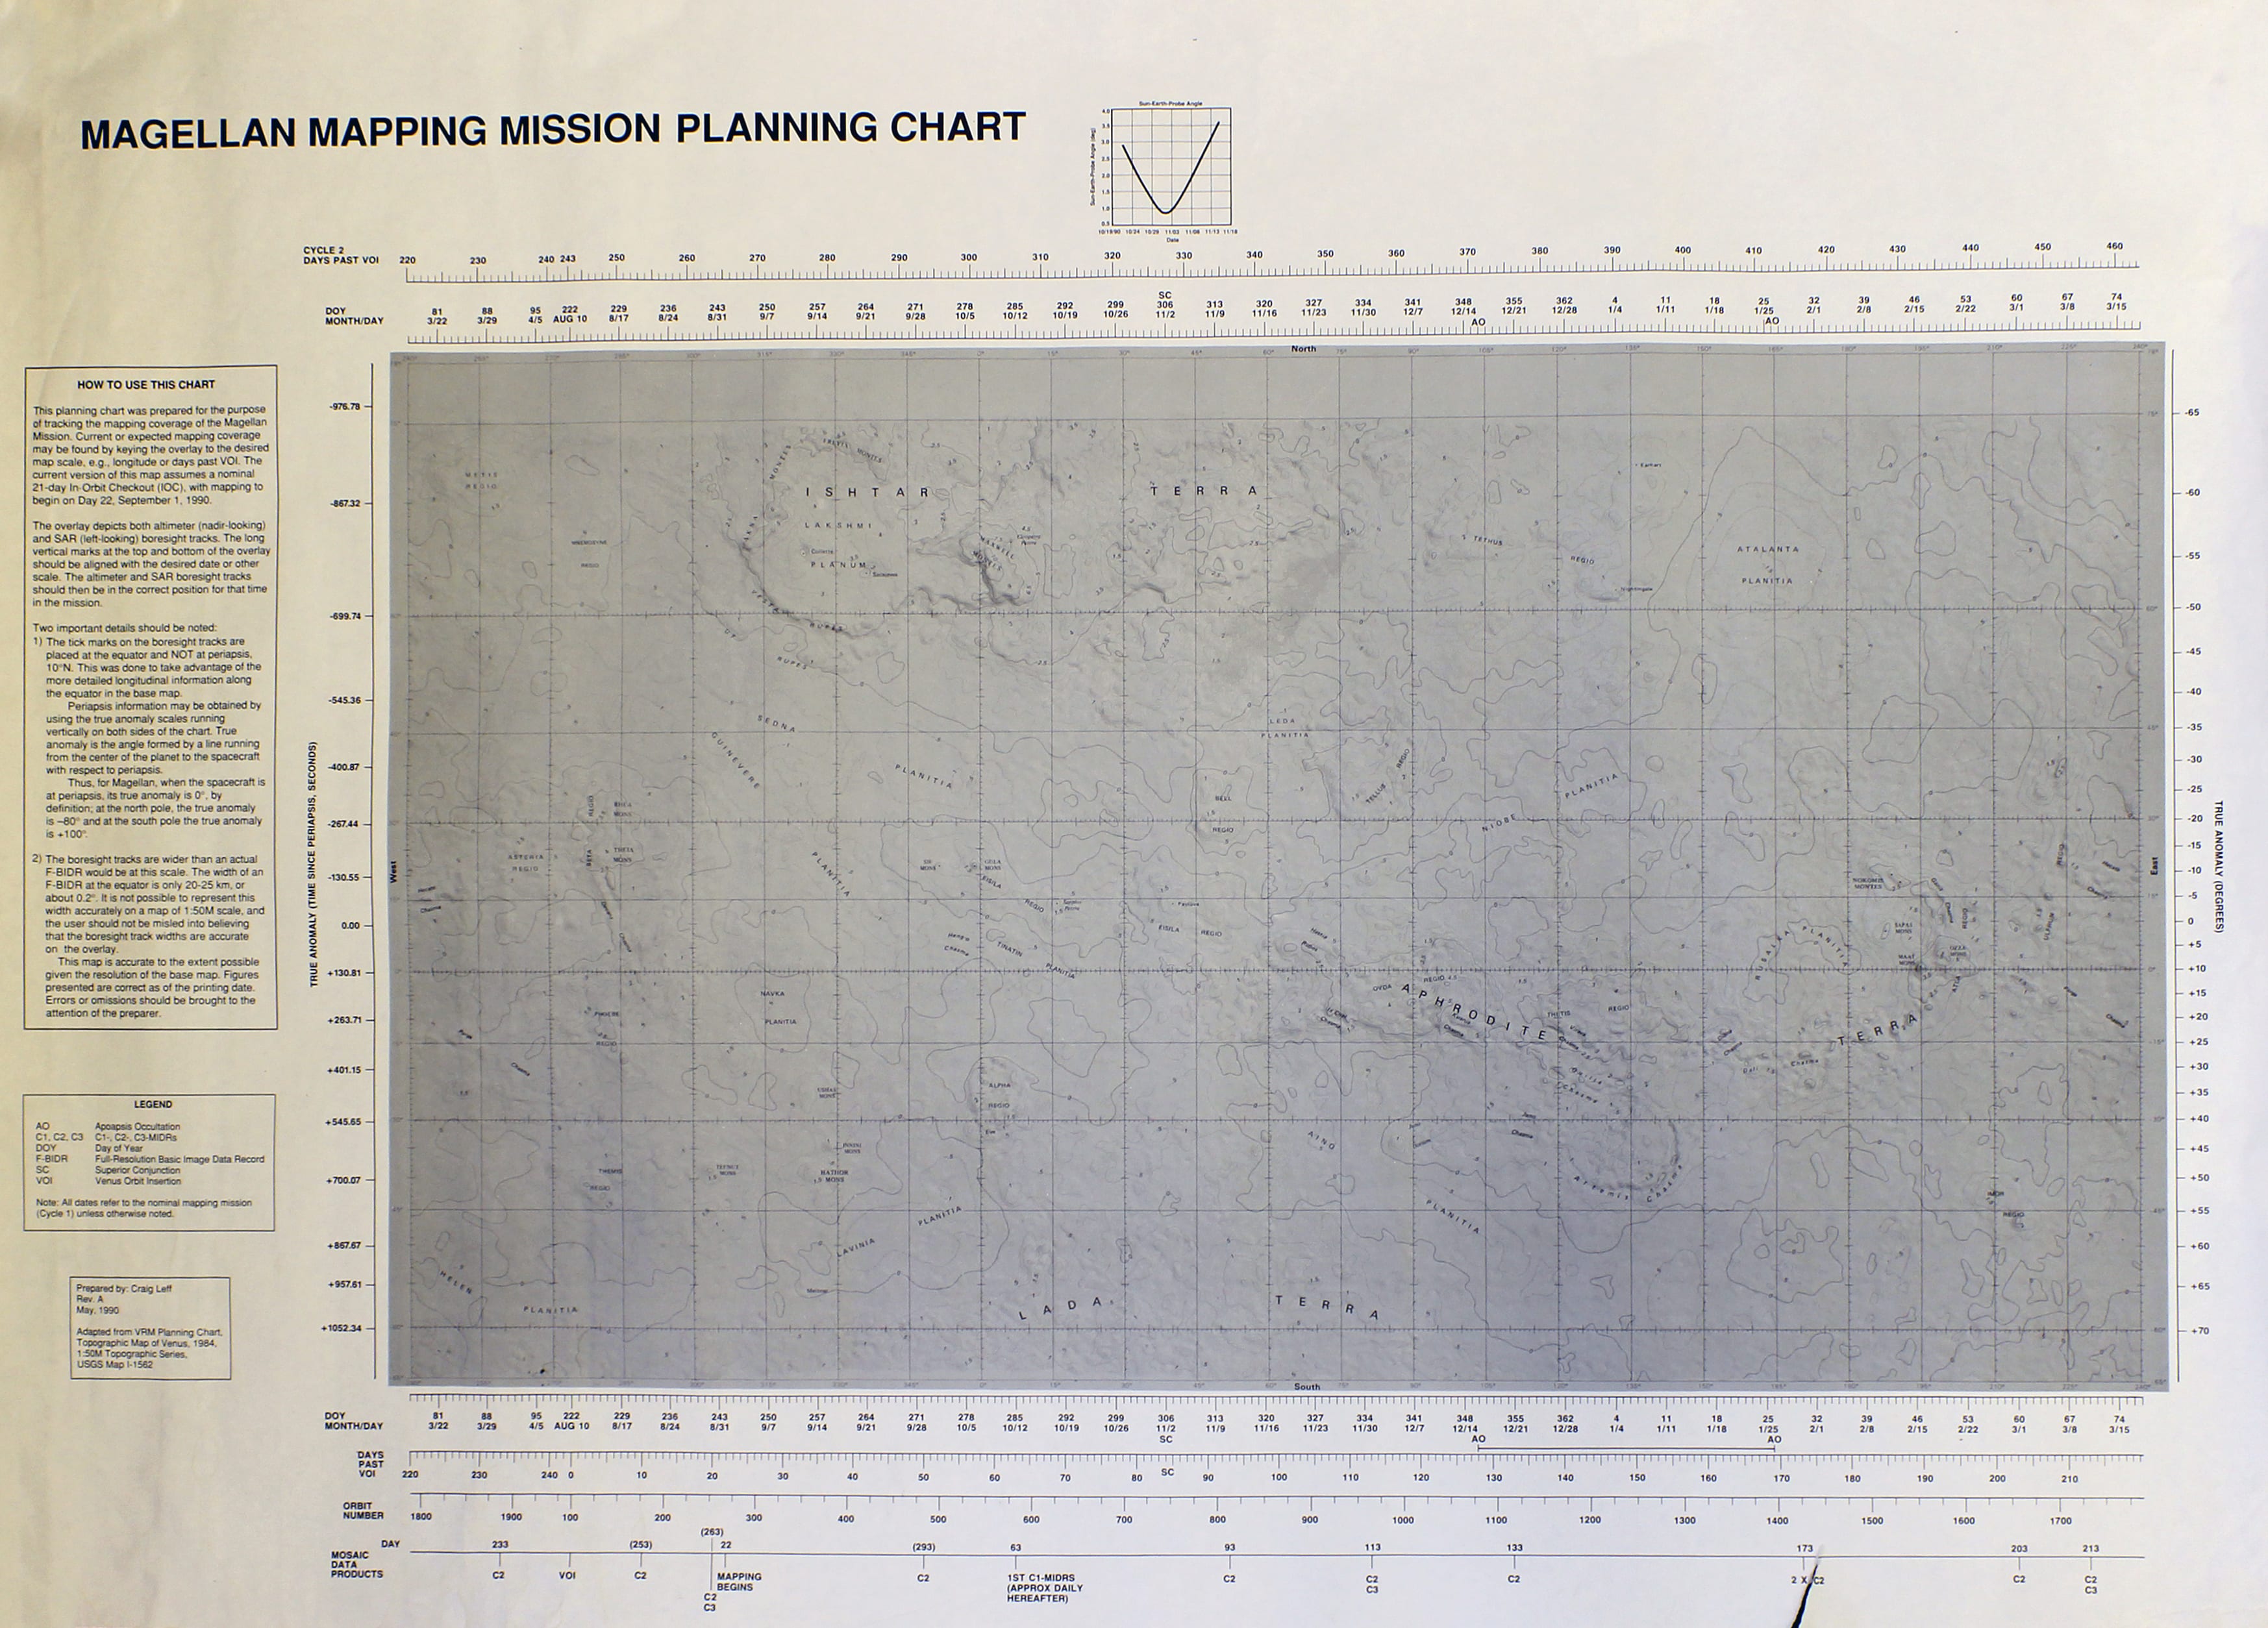
Planning chart for the Magellan mission. Click here for labelled image showing the location of the above radar map. Credit: UCL RPIF
Links
- Centre for Planetary Sciences
- UCL Regional Planetary Image Facility
- Snapshots from Space History (online exhibition of images from the Centre for Planetary Sciences)
- UCL Physics & Astronomy
- UCL Earth Sciences
- UCL Museums & Collections


 Of course, the secret is that the fate of our 100 micro-people is sealed: the urn will empty into the bath at the end of the show. Because it turns out social media chatter doesn’t change our fate – we need to act here in the physical, real world. The one in which the water is wet, the ice is melting, and the little people are struggling to stay dry.
 That’s the reason the drowning is staged in a bath, with a hot-water urn above it, and tweets scrolling on a screen above that. All these activites – heating and processing water, and our endless online activity – they have a carbon footprint. They are all contributing to climate change.

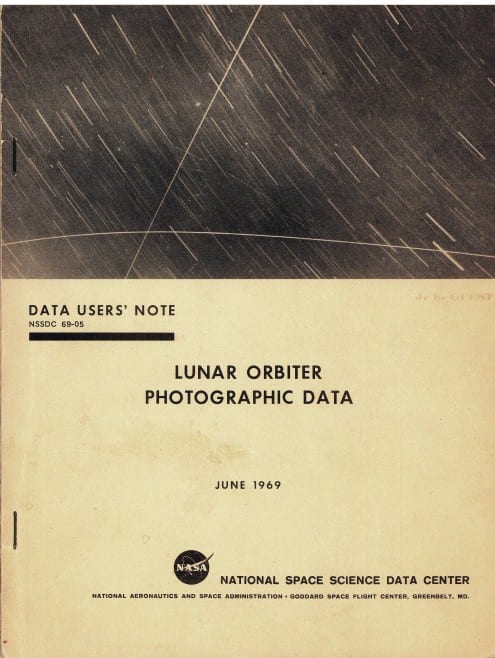 Apollo 11, which touched down in the Sea of Tranquility on 20 July 1969 was the first manned landing on the Moon. But prior to the human spaceflight project, NASA explored the Moon with robotic probes. One key element of this endeavour was the Lunar Orbiter programme, which included five spacecraft that mapped almost the entire lunar surface in 1966 and 1967. This was in part in order to identify landing sites for Apollo, but the missions also had broader scientific goals.
