 Close
Close

Visualising political polarisation
By Oli Usher, on 29 October 2014
Network diagrams are visualisations of the links between different things. Points mark out the things (for instance, children in a class) and lines are the connections between them (for instance, whether they are friends). For small sets of data, these are an arresting way of immediately understanding relationships between things.
For instance in this (imaginary) diagram, even the quickest of glances shows that Maryam has many friends and Peter has very few:

While they work well for small datasets, like a class with a few tens of children, these diagrams quickly become unreadable as you add more points.
But what if there were a way to avoid showing every point, while still somehow conveying the overall message? Many of the individual data points will be very similar or even identical (for instance Peter, Sarah and Philippe in the diagram above). If you could somehow average these out and come up with a handful of idealised versions of the children in the class, you could drastically reduce the clutter – and in the case of particularly complex ones, simplify a chart and make it readable.
This is something UCL statisticians Patrick Wolfe and Sofia Olhede have worked on in a new paper, published recently in the Proceedings of the National Academy of Sciences. The thrust of the paper is highly technical and not for the faint-hearted:

But one example of how their technique simplifies the presentation of data is much more comprehensible.
A decade ago, a statistical study of over 1200 political blogs in the run-up to the 2004 US election went viral thanks to a startling visualisation of the hyperlink between blogs:

Network diagram of US political blogs in 2004 (Credit: Lada Adamic, all rights reserved)
Blogs supporting President Bush’s Republican Party (red dots) overwhelmingly linked to other Republican blogs (red lines). On the left, blogs supporting the Democrats and their candidate John Kerry (blue dots) showed a similar pattern of mutual linking (blue lines).
Hyperlinks crossing the political divide – in orange – were relatively few and far between.
The chart starkly displays the lack of communication of a polarised political discourse. But if you’re looking for any finer detail, it is a mess. There are over a thousand dots and several thousand lines. The detail is impossible to see.
Olhede and Wolfe’s analysis condense down 1224 blogs into just 17 buckets of 72 blogs each, clustered together based on similar linking behaviour.
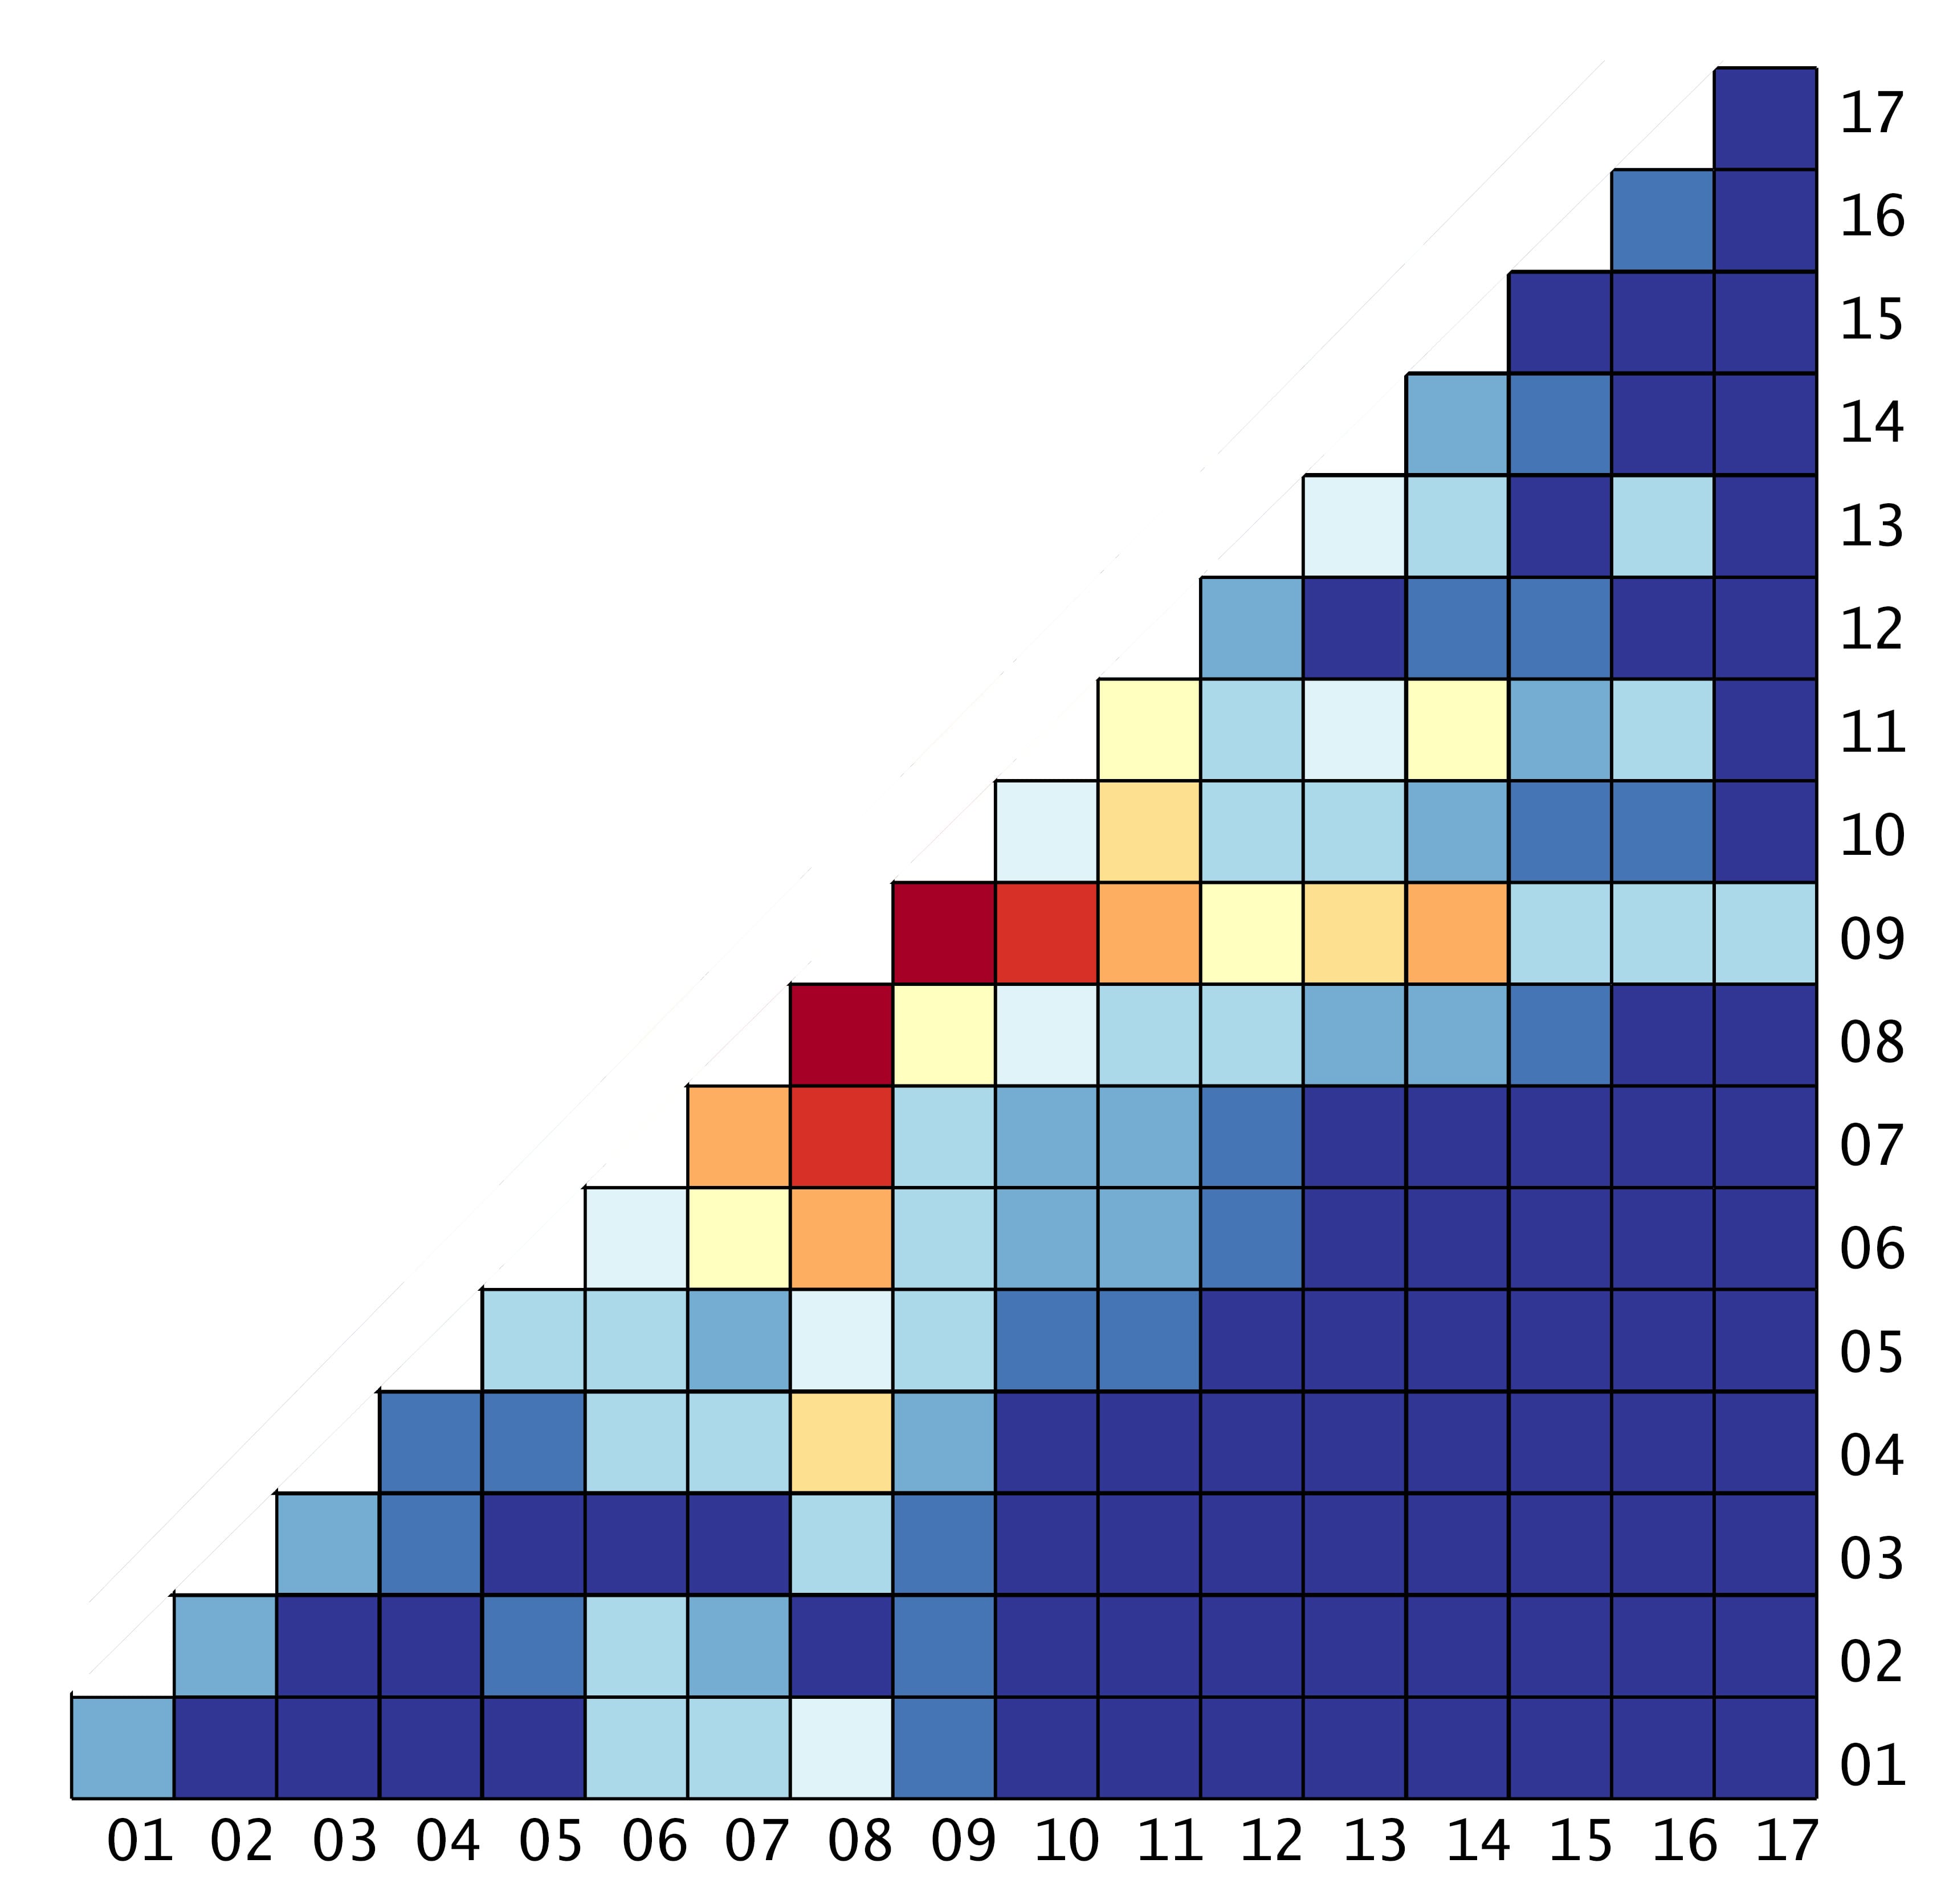
This diagram looks complicated at first sight, but it is in fact quite simple.
Each line and each column represents one of the 17 buckets of blogs, with lines and columns 1 to 8 representing the eight buckets of liberal blogs, while 9 through 17 are the nine buckets of conservative blogs.
Match up the co-ordinates, and the colour of the square shows how often these blogs link to each other, with dark blue being no links and bright red being extremely frequent linking.
So for instance, to see how frequently the blogs in the sixth bucket link to those of the eighth, you just need to look at the sixth block in the eighth column. (The square is orange, representing frequent linking between them – as indeed you might expect of two liberal blogs.)
This simplified diagram, called a ‘network histogram’, reveals the same dramatic segregation of the blogosphere as the network diagram does – notice the sea of blue in the bottom right part of the diagram, where you might expect to see links between Republican and Democratic blogs – in a chart with just 153 points of data, rather than several thousand.
It also shows other features such as relative popularity within each political grouping (which is virtually impossible to see in any detail in the original visualisation) as well as how much blogs within each of the 17 bins link to themselves (i.e. the blogs most similar to them). Perhaps surprisingly, many of them don’t – with the most isolated blogs not linking to blogs similar to themselves, but just linking to the most popular, most mainstream ones on their side of the political spectrum.
The network histogram also reveals the nature and frequency of the (rare) links across the political divide – for instance, the most popular cross-partisan linking occurs between bucket 9 of conservative blogs and bucket 8 of liberal blogs – though even this is only frequent enough to show up in pale yellow.

Make the histogram a square (by mirroring it), and the data can be represented in different ways – for instance, with different heights representing varying intensities of linking (top) or map-like contours (bottom).
Links
- Paper in PNAS (pdf)
- High resolution pictures of various visualisations of the network histogram are available on Flickr
- UCL Statistical Science
- Sofia Olhede
- Patrick Wolfe
