Understanding youth turnout in GenElec2017: some comments, cautions and caveats
By UCL Global Youth, on 11 June 2017
Posted by Dr. Avril Keating, Director of the Centre for Global Youth.
Youth turnout in the British general election has once again been the focus of much media attention and social media comment, with some calling this election a “youthquake”. In this blog, I provide some contextual information for these stories, and some words of caution for interpreting the data that is currently available.
1. It is widely being claimed that 72% of young people turned out to vote in the General Election. This is an early estimate, and likely to be contradicted. After the EU referendum in 2016, the headlines focused on initial claims that only 36% of young people aged 18-24 voted, however subsequent polls estimated that turnout among this age group was closer to 60%.
2. The best sources to look for are the How Britain Voted series (published by Ipsos-MORI, usually a few weeks after the election) and the British Election Study (which will release its figures in the Autumn).
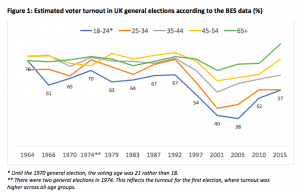
3. Even these two sources are likely to contradict each other. In 2015, Ipsos-MORI data suggested that turnout among the 18-24s was 43%, while BES data put turnout at 57%. The Ipsos-MORI data tends to be more widely cited, but the BES data has important methodological advantages and allows us to look at turnout trends as far back as the 1960s.

4. All of these figures are estimates. The Electoral Commission does not collect data on the demographic characteristics of voters. Instead, we have to rely on surveys that ask people if they voted after the fact, and studies have regularly shown that some people claim that they voted when they have not, as they are embarrassed to admit that they did not vote. This is known as social desirability bias, and studies such as the BES are devising methods to estimate the level of over-claiming so that we can take this into account. Interestingly, their methods suggest that young people are even more likely than other age groups to say that they voted when they have not.
5. Despite their differences (and their flaws), both show that turnout fell among all age groups between 1992 and 2010, and has been increasing across all age groups (including the 18-24s) since 2010.
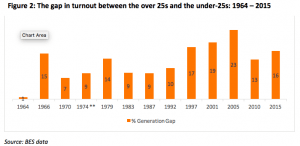
6. For this reason, it is also important to look at the change in the inter-generational gap, and not just the change in proportions over time. By doing this, we can see that the inter-generational gap has existed since the 1960s, increased in the late 1990s and over the course of the 2000s, but seems to be closing again since 2010.

7. We also need to look at trends among the slightly less, ahem, ‘young’ voters (the 25s-44s), and not just the 18-24s. Although the level of support varies, it appears that a majority of all voters under 44 voted for Labour in 2017 and against Brexit in 2016. In addition, youth turnout first began to decline when the current cohort of 35-44 year olds were 18-24 (i.e. in the 1990s). The generational dividing line may therefore be between the under-45s versus the over 45s.
8. Is Brexit the reason for the apparent increase in young people voting in the 2017 election?
Brexit is likely to be one reason (at least for some), but far from the only one. When analysing these patterns in the next weeks, months, and years, we will need to take into account other factors including: campaign effects (including how good Corbyn’s campaign was and how poor the Conservative’s campaign was); the appeal of the Labour Party’s policy proposals (e.g. NHS spending and the abolition of tuition fees); the upwards trend in youth voting (see point 5); the impact of 7 years of Conservative government and anti-austerity policies that hit young people and youth services particularly hard; the continued rise in house prices and rents at a time when real pay for young people is falling; and generational differences in cultural values. All of these factors (and more) are likely to have galvanised younger voters.
9. Finally, if, as we expect, there has been a substantial increase in the proportion of young people voting, the next question we need to be asking is how can we sustain this and more importantly, broaden the range of young people voting? Among the 18-24s, the rise in turnout is likely to be among young people that are studying for degrees, or are on their way to getting one. The debate is currently focused on the inter-generational gap, but we should also start paying more attention to the intra-generational gap, so that we don’t overlook that the most excluded young people are still not voting. Let’s find out why not, and try to address this also.
4 Responses to “Understanding youth turnout in GenElec2017: some comments, cautions and caveats”
- 1
-
2
Understanding youth turnout in GenElec2017: some comments, cautions and caveats | IOE LONDON BLOG wrote on 13 June 2017:

[…] post has been re-blogged from the Centre for Global Youth […]
-
3
General election results weren't down to youth turnout alone – londonnews247.com wrote on 14 June 2017:

[…] are imperfect tools for estimating turnout , particularly because they tend to over-sample politically engaged young people, and respondents […]
-
4
Wishing for Better: Thoughts on an election | Discover Society wrote on 2 August 2017:

[…] according to Ipsos MORI. Just to add a cautionary note, these figures are best estimates and as UCL Global Youth point out may be contradicted by the British Election Survey, which will be published in the […]
 Close
Close


This is a brilliant analysis. You are spot on in highlighting that intra-generational difference (not just inter-generational) is a very important factor needing further attention.