 Close
Close

The Challenge of Monitoring Biodiversity
By Claire Asher, on 4 August 2015
a guest blog by Charlie Outhwaite, written for the 2015 Write About Research Competition.
Biological diversity, or biodiversity, is a complex term encompassing the variety of life found on Earth. It incorporates not only differences between species but within species themselves and of the environments and ecosystems where they are found. We as humans benefit a great deal from the biodiversity on Earth in a range of ways; from the clean air we breathe to food, materials and medicines that are produced as a result. These products or services are known as ecosystem services and these services depend on biodiversity. Monitoring the status of biodiversity is therefore an important area of research, but offers its own challenges. New methods offer the chance to utilise data that has been underused in the past due to its associated biases and we are now able to explore and monitor the responses of biodiversity over time for many more species than has previously been possible. This has opened the door not only to more knowledge on a greater range of species but also allows us to look into what aspects are influencing these changes, such as the impact of climate change.
In April 1992, an agreement was signed by a number of government parties to the Convention on Biological Diversity (CBD) agreeing to the global target “to achieve by 2010 a significant reduction of the current rate of biodiversity loss”. Unfortunately, this target was never achieved and so, in 2010 an updated plan was established at the tenth meeting of the Convention in Nagoya, Japan. This revised plan includes 20 main targets, known as the Aichi Biodiversity targets, under 5 strategic goals each encompassing one aspect to benefit biodiversity.
In order to measure progress towards these targets, at both a national and a global scale, a number of indicators of change have been developed, these are often simple graphs showing increases or decreases in the variable being monitored. For the UK, these are published annually by DEFRA (the Department for Environment, Food and Rural Affairs) in the Biodiversity Indicators in your Pocket report (BIYP). Indicators are composite measures of change and are a simple and easy way to communicate change over time. The most recent BIYP report includes a suite of indicators aimed to report on UK progress towards the Aichi targets. These range from indicators of change in volunteer time spent in conservation organisations to assess progress towards strategic goal A (Address the underlying causes of biodiversity loss by mainstreaming biodiversity across government and society) to indicators of the status of UK priority species for Strategic Goal C (To improve the status of biodiversity by safeguarding ecosystems, species and genetic diversity).
However, the monitoring of aspects of the goals is not simple and biodiversity itself provides a great challenge. Take target 12 for example; “By 2020 the extinction of known threatened species has been prevented and their conservation status, particularly of those most in decline, has been improved and sustained”. In order to assess whether the decline and extinction of threatened species has been prevented we need to be able to measure how many there are in the first place, and how that changes over time. Ideally, we would like to go out and count exactly how many there are of each species, but of course this is not possible. It would be difficult enough going out and counting every species in your own garden, let alone across the whole country. So, we have to use the next best alternative. In some cases, standardised monitoring schemes such as the Breeding Bird Survey are set up and species numbers are monitored using standardised techniques across specific sites. This data can then be used to accurately estimate the abundance of those species observed. However, this kind of data is costly to collect and requires a lot of time and effort and so, is not available for the majority of species.
An alternative form of data is biological records. Biological records are a data type that is high in quantity but has a number problems associated with it. Often collected by volunteers through citizen science projects, this type of data can be highly variable in its level of accuracy and completeness. However, with interest and participation in citizen science increasing, the amount of biological records data available is rising. With so much data on hand, and often for those groups of species that are less well studied (such as insects) and for which monitoring scheme data is unavailable, it is important that these data are put to good use. However, because of the problems associated with this data type, it is underused and underappreciated. The main problem is that it is collected in an unstandardized way, which introduces bias into the data. Records will often be collected by an individual at a location of their choosing and they may not report every species they see.
A number of robust statistical methods have been developed that are able to account for these associated biases. Bayesian occupancy models are a complex statistical technique which has been shown by Isaac et al (2015) to most effectively account for the biases of this type of data and produce reliable indicators of change. It is now being used to monitor changes in the biodiversity of less well studied groups of species using biological records from various recording schemes. For these species groups, this kind of data is all that is available and so employing these new methods for analysing biological records is enabling greater research into areas where little is currently known.
However, with human induced drivers being the biggest threat to biodiversity loss, it is not enough to simply monitor changes in species trends. There is a growing need to understand what is causing these trends and how a species’ traits can increase its susceptibility towards these drivers. Through a more thorough understanding of the effects drivers such as climate change have on a group of species, and which species within that group will be most affected, it would be possible to design conservation interventions to target those species most at risk, preventing future declines. This process could act as a form of triage, in determining those species that will be most affected so that conservation and policy action can be targeted to those areas in the first instance. This is becoming increasingly urgent as a mid-term report on progress towards meeting the CBD 2020 targets by Tittensor et al indicates that progress is not positive.
References
- Defra (2014) UK Biodiversity Indicators 2014: Measuring progress towards halting biodiversity loss. Retrieved from http://jncc.defra.gov.uk/page-4229
- Isaac, N. J. B., van Strien, A. J., August, T. A., de Zeeuw, M. P., & Roy, D. B. (2014). Statistics for citizen science: extracting signals of change from noisy ecological data. Methods in Ecology and Evolution, doi:10.1111/2041-210X.12254
- Tittensor, D. P., Walpole, M., Hill, S. L. L., Boyce, D. G., Britten, G. L., Burgess, N. D., … Parks, B. C. (2014). A mid-term analysis of progress toward international biodiversity targets, (October), 1–8.
Charlie is a first year PhD Student based at the Centre for Ecology and Hydrology, Wallingford and working within the Biological Records Centre. Charlie’s PhD is linked with CBER UCL and the RSPB through a CASE partnership. Her research is looking into biodiversity status, drivers and indicators from biological records. Charlie’s interest in measuring and reporting changes in biodiversity has grown since working as an intern and research assistant within the Indicators and Assessments Unit at the Institute of Zoology. Within these roles she worked on the Living Planet Index and on developing a Canadian biodiversity indicator. Going from the reporting and development side of indicators she now hopes to reveal the role of drivers of change and how these interact with species traits to affect changes in biodiversity.
Anti-Ageing: Health or Beauty?
By Claire Asher, on 7 July 2015
a guest blog by Jorge I. Castillo-Quan, written for the 2015 Write About Research Competition.
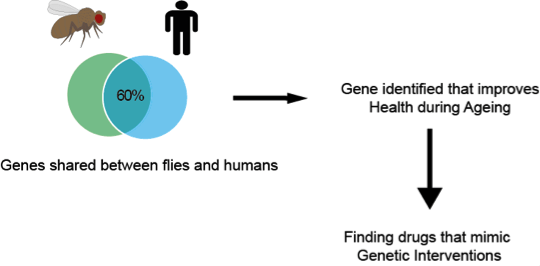
If you had not heard of the term anti-ageing you have not noticed spam emails, television advertising, and articles in magazines. The term anti-ageing has definitely permeated our society. Most scientists struggle to explain to their non-scientist friends what their research is about. When I tell my friends I study ageing and anti-ageing interventions, almost everyone has an idea of what that means. Or at least they think they do. Some people think I am developing the latest generation of creams that will make wrinkles disappear, or that I am finding remedies to prevent greying hair, or the solution that will avoid balding, or even make stretch marks go away. Those with more imagination, think I am trying to defeat death and make people immortal. However, none of these ideas are in any way close to what I do. I explain to them that I do my research on ageing using the fruit fly Drosophila melanogaster. Yes, I work with those little flies that lurk around your kitchen. If you are now thinking why on Earth are you studying fly ageing, I do not blame you. I thought this once too. The first thing you should know is that I am not interested in making immortal flies (though that could be cool!), nor is my aim to understand how flies age per se. The simplest explanation is that studying ageing in an organism that is less complex than humans is more convenient and faster. After all we share 60% of our DNA with the fly. Although we look very different more than half of our genes have a counterpart in the fly. Similar things can be said about the roundworm Caenorhabditis elegans which shares 40% of our DNA. But why use these organisms that seem so unrelated to us? They have shorter lifespans and show traits of ageing. For example, as worms and flies age, they lose their ability to move properly. Is true that we do not wiggle around like worms, or fly and climb as much as flies do, but these rather specific behaviours are controlled in similar ways by locomotor programmes, some of which are similar between species. Hence, we can use these as readouts of how quickly a worm or fly is ageing. Furthermore, worms in laboratories only live about 2-3 weeks, while flies about 3 months. If you were to compare these lifespans with that of the more traditional laboratory organism, the mouse, you will find that you would be able to complete over 10 survival experiments in flies while only completing one survival experiment using mice, that live around 3 years. Each organism has its advantages. Worms are transparent so you can look and examine how every organ is changing over time. But while they do have a semi-organised neuronal system, they do not have a proper brain. Flies do, and research studying the development and organisation of the fly brain has advanced our understanding of the human brain so much so that it has been awarded several Nobel prizes in Physiology or Medicine.
Having established that flies are simpler than mammals like us and mice, and that they are relatively short-lived, the question remains, how am I developing the latest generation of anti-ageing creams using Drosophila? I have to be honest here and say that I am not working on this. Although the term anti-ageing is more commonly associated with these kind of interventions this is not the aim of my research. I study ageing to try to understand its biological principles and what drives it. I am sure that you thought that this is exactly what the multi-million anti-ageing industry is doing, but no. Although some (very little) of what is going on in the big wide world is labelled as scientifically proven, it is not. Or not at the standard that is required for prescription pills and creams you get from your GP or other health professionals. The anti-ageing industry as we know it is not regulated and is merely cosmetic. When biogerontologists (biologist studying ageing) talk about anti-ageing, we talk about physiology (function), health and disease. I try to study ageing to improve health during old age. Ageing is the major risk factor for many of the killer diseases of our time, like diabetes, cardiovascular disease and cancer. Understanding what makes aged bodies vulnerable to threat of these diseases should be a major concern of our generation. As our societies are growing older it is expected that our health systems will be overwhelmed with treatments for patients suffering from these chronic conditions. No hospital running on public funds will see you for wrinkles or stretch marks when you are 65, but they certainly have to see you for a growing lump, forgetfulness, urinary problems and other serious health issues.
Using model organisms like flies and worms we have been able to establish that specific genes have the ability to enhance longevity and health when appropriately manipulated. For example, the first genetic manipulations that showed that an organism could live healthier for longer came from research using worms. Later it was shown that the same interventions in flies and mice had similar effects and these organisms also lived healthier for longer. Nowadays, we have a more comprehensive understanding of what genes need to be manipulated to delay deterioration with age and, in some cases, even prevent the onset of diseases. Of course all of this is in worms, flies and mice. To jump to humans, interventions need to be less of the genetic kind and more on the drug side. With our current knowledge of ageing we are now trying to find ways to manipulate the function of genes with drugs. The good news is that it seems that this is possible. We do not need to manipulate the genes of an organism to delay the ageing process; this can be achieved by supplementation with specific compounds at specific doses, and in some cases at specific time of life. However, for humans to be able to take these anti-ageing interventions they need to be appropriately tested and regulated by agencies in charge of ensuring their safety for human consumption. We must continue to wait patiently…
For far too long we have considered growing older as two extremes, either as a burden to society, or as the great achievement of our generation. After all living to a 100 was quite rare 100 years ago. We should celebrate our older population and the best way is by enhancing their health and allowing them to live a fulfilling life, not one of deterioration and despair.
Next time you see an anti-ageing cream, think about this: would I rather have beauty or health? If the latter is your choice, just wait a little bit longer, we are working on it.
References
- Juengst ET, Binstock RH, Mehlman M, Post SG, Whitehouse P. Biogerontology, “anti-aging medicine,” and the challenges of human enhancement. Hastings Cent Rep. 2003 Jul-Aug;33(4):21-30
- Partridge L. The new biology of ageing. Philos Trans R Soc Lond B Biol Sci. 2010 Jan 12;365(1537):147-54
- Rose MR.Can human aging be postponed? Sci Am. 1999 Dec;281(6):106-11
- Stipp D. A new path to longevity. Sci Am. 2012 Jan;306(1):32-9
 Jorge graduated with a Medical degree from the Autonomous University of Yucatan, Mexico. After this he completed an MSc in Clinical Neuroscience at the UCL Institute of Neurology, and a PhD in Genetics, Neuroscience and Biogerontology from the UCL Institute of Healthy Ageing (IHA). Currently he works as a Research Associate at the UCL IHA and Research Department of Genetics, Evolution and Environment.
Watch Jorge’s TEDx talk elaborating on the topic:
“Anti-Ageing: Beauty or Health?”
Can Large MPAs Protect Tuna and Sharks?
By Claire Asher, on 4 June 2015
a guest blog by David Curnick, written for the 2015 Write About Research Competition.
With a global human population of over 7 billion it is becoming ever more important to manage our natural resources effectively. For centuries, the oceans have been seen as an endless bounty, ripe for harvesting. However, this simply isn’t the case and concerns are growing over the status of many fish populations, particularly those of predatory fish, and this has led to concerns over potential impacts on food webs and ocean health. A number of management initiatives have been adopted in an attempt to address these perceived declines such as restrictions on fishing gear, catch limits, closed seasons and the establishment of marine protected areas (MPAs).
Recently, there has been a growing trend for the establishment of large MPAs, such as that around the Chagos archipelago in the Indian Ocean, as countries attempt to meet global conservation targets (e.g. the Convention on Biological Diversity states that 10% of the ocean should be under protection by 2020). However, whilst the benefits of smaller coastal MPAs have been widely documented, there is uncertainty about their effects on wide-ranging oceanic species, such as tunas and sharks. This is because oceanic species tend to utilise the open ocean more than their coral reef counterparts and therefore have the potential to cross MPA boundaries and render such reserves obsolete. Therefore, for spatial management to work for these wide-ranging species, the MPAs would need to be large enough to either encapsulate the entirety or a significant proportion of their home range, or protect them during crucial life stages such as during breeding or to provide nursery grounds.
Given society’s fondness of tuna, you would think that we would know everything there could possibly be to know about our easily tinnable friends. Unfortunately, unlike the well-documented migration of wildebeest, migratory patterns in tuna are not that well understood, and nor are many of their life histories. In fact, the range size of tunas, a key consideration for spatial management, is hotly debated in the literature. Sibert and Hampton (2003) suggested that the average lifetime distance travelled for skipjack tunas in the Pacific Ocean ranged from 420 to 470 nautical miles (nm) and that for yellowfin tuna it was about 20% less. This led Sheppard (2010) to propose that, should this also hold true for populations in the Indian Ocean, then potentially there is a large resident tuna population within the Chagos MPA year-round. The fact that a longline fishery used to operate in Chagos throughout the year seems to support that there are at least tunas in Chagos year round, although whether they are the same individuals is impossible to say at the moment. In contrast to Sibert and Hampton’s findings, Hallier and Million (2012) found that tunas tagged off East Africa, the Seychelles and the Maldives travelled significantly further, with an average of 800nm for yellowfin, and 600nm for bigeye and skipjack tuna. Such a large discrepancy in range estimates existing between sub-populations of species only serves to highlight our lack of understanding, and could be the difference between a marine reserve proving effective or not. An additional issue with these tagging programmes is that they are based on simple mark-recapture studies and therefore we have no idea of the route that the tuna took between point A and B (being tagged and being re-caught). Maybe they actually travelled much further than the estimates, or maybe they spent 90% of their time in one location. We simply do not know from these data. It is also apparent that both of these studies assume that all individuals within a population follow the same migratory pattern and that behavioural traits of species are similar across regions and even oceans. In reality, neither of these assumptions is likely to hold true and therefore we need to investigate the tuna populations on a case by case basis to understand the specific ecology of these animals better.
So how are we addressing this knowledge gap in Chagos? Well, until recently, our knowledge of oceanic predators in Chagos was limited to historical fisheries records and a handful of observations on coral reef focused scientific expeditions. Together with colleagues from Stanford University, the University of Western Australia, the Bertarelli Foundation and the Zoological Society of London, we have been studying sharks and other ocean giants within the Chagos MPA to try and find out exactly what role the reserve has within the context of the wider Indian Ocean, and if it truly can protect wide-ranging species. Covering 640,000km2, Chagos is certainly large, in fact it’s about the same size of mainland France. Oceanic sharks, like tunas, are often branded as ‘highly migratory’, but a number of studies have shown these species to exhibit site-fidelity around nutrient-rich seamounts and upwellings which are known to be abundant in Chagos. If high site-fidelity is observed in sharks around Chagos, this would indicate that the reserve may be of huge benefit to sharks, tuna and other migratory species in the Indian Ocean. Alternatively, sharks may range far beyond the boundaries of the reserve and this may therefore raise questions of its efficacy for these species. Through satellite tagging sharks and tunas, we will get high resolution data on their movements which will help us to understand how much time they spend within this mega reserve, whether there are any hotspots of activity or aggregations that could suggest feeding or breeding grounds, and how connected populations are with others across the Indian Ocean. So far, 152 sharks and 25 manta rays have been tagged in Chagos in order to find out their movements inside and outside the reserve. Only through understanding these key baseline data can we then start to assess the potential impact of the Chagos MPA.
A final point to note is that in terms of marine resource management, we are currently operating with one hand tied behind our back. Why? Well, in the current legislative environment, marine reserves and other initiatives can only really be established within the 200nm national jurisdiction (Exclusive Economic Zone – EEZ) of willing countries. This means that within the ocean beyond, which amounts to 64% of the ocean and 50% of our planet, management options are limited. Previous studies have suggested that, particularly within the Indian Ocean, important breeding grounds for tunas may exist within this legal black hole. Therefore it is quite possible that our best chance for ocean sustainability is currently just beyond our 200nm reach.
References
- Altenhoff AM, Dessimoz C. Inferring Orthology and Paralogy. In: Anisimova M, editor. Evolutionary Genomics. Totowa, NJ: Humana Press; 2012. pp. 259–279. Available: http://discovery.ucl.ac.uk/1395519/
- Altenhoff AM, Škunca N, Glover N, Train C-M, Sueki A, Piližota I, et al. The OMA orthology database in 2015: function predictions, better plant support, synteny view and other improvements. Nucleic Acids Res. 2014; gku1158. doi:10.1093/nar/gku1158
David Curnick has a recreational fishing background, over 12 years’ experience working with in the fields of fish biology and ecology, and has been researching Chagos megafauna for the last 5 years. He was part of the February 2014 Vava II research expedition focusing on shark biology and behaviour and also the Darwin Funded 2014 reef expedition. He has experience tagging several species including reef shark (grey, blacktip) oceanic (silvertip, silky), mantas and billfishes. He is currently reading for a PhD at UCL on the role Chagos plays in the conservation of pelagic predators such as sharks and tunas analysing both tagging and fisheries data. David satellite tags pelagic sharks to understand how they utilise the reserve in both space and time. He also tweets regularly from @d_curnick
PREDICTS Project: Global Analysis Reveals Massive Biodiversity Losses
By Claire Asher, on 21 May 2015
The changing climate is only one of a myriad of pressures faced by global biodiversity – we are also changing habitats and altering land-use on an unprecedented scale. The first global analysis published from the PREDICTS project reveals the striking global effect of land-use change on local biodiversity patterns, and highlights the importance of future climate-mitigation strategies in shaping the future of biodiversity and the vital ecosystem services it provides.
Human activities are causing widespread change to and degradation of habitats, which has been linked to serious biodiversity declines globally. Land-use change comes in many forms, from deforestation and agriculture to urban development and road-building, and previous work by the PREDICTS project has shown how different types of land-use influence different types of species differently. We are interested in biodiversity loss at a global scale, and many metrics aim to quantify this, but viewing global patterns can obscure local-scale changes that are likely to be more important for the resilience of ecosystem services. Ecosystem services include clean air and water, food, medicine and nutrient cycling, among others, and are vital both for biodiversity and for human survival and well-being. The PREDICTS project considers local-scale changes to biodiversity in response to land-use change, to produce a powerful model that can be used to project the impact of future land-use and climate change. In their latest paper, published in Nature last month, the PREDICTS team reveal their most comprehensive analysis to date, showing massive reductions in local biodiversity since 1500, and projecting further widespread losses under several future climate and land-use scenarios. There is still hope, however, and strategies to mitigate greenhouse gas emissions without major land-use change could offer the opportunity for global biodiversity to recover.
Understanding the Past and Present

The PREDICTS team have assembled a database of over 1,130,000 records of species abundance and nearly 330,000 records of species richness across more than 11,000 sites worldwide. The database includes results from 284 scientific publications, and represents over 25,000 species. Using this incredible resource, the team compared species richness and abundance between sites with different land-use types and produced a statistical model to quantify local biodiversity responses to land-use change. This enabled them to infer changes in species assemblages since the year 1500.They found that species richness and total abundance were both strongly influenced by land-use type and intensity, with reductions in biodiversity outside of primary vegetation and the worst losses seen in intensively used areas. Local biodiversity was also negatively impacted by human population density and accessibility (measured by the distance to the nearest main road). In the worst-affected habitats, changing land-use away from primary vegetation reduced species richness and abundance by an average of about 40%, and globally, land-use change was responsible for an average reduction in species richness and abundance of around 9%. The value of secondary vegetation (forest recovering from past damage) for biodiversity depended strongly on how mature the habitat was, with species diversity increasing over time, and mature secondary vegetation most closely resembling primary habitats. Restoration projects do, therefore, have the power to return biodiversity to damaged habitats, but (unsurprisingly!) it will take time.
Previous estimates have suggested that local losses of species richness and diversity greater than 20% are likely to substantially impair ecosystem services contributed to by biodiversity and reduce overall ecosystem function. Some scientists believe biodiversity loses at this scale may push populations towards ‘tipping points’ where ecosystem function declines lead to further species loss. Thus, in the worst-affected habitats considered by the PREDICTS team, which experienced on average a 31% loss of local species richness, ecosystem function is likely to be substantially impaired.
Changes in species richness and abundance may underestimate the real impact of land-use change because the measure fails to capture the composition of a community. The team therefore compared the species composition between sites and found that communities tended to be similar under similar land-use. Communities living in primary and secondary vegetation were most alike, while more disturbed habitats such as plantation forest, pasture and cropland tended to support a different cluster of more human-tolerant species. Human-dominated landscapes lost far more natural local diversity than more pristine sites where natural vegetation remains.
Reconstructing past biodiversity loss indicated that the greatest reductions in species richness occurred in (unsurprisingly) the 19th and 20th centuries, and that by 2005 local species richness worldwide had reduced by 13.6% due to land-use change and related anthropogenic pressures. How will this trend continue into the future?
Projecting the Future
The PREDICTS team then went on to combine their analysis of current species’ responses to land-use change with four climate scenarios produced by the Intergovernmental Panel on Climate Change, to project future changes in biodiversity under different socioeconomic scenarios of land-use change. Projecting as far as 2095, the PREDICTS model projects rapid biodiversity losses under a ‘business-as-usual’ land-use scenario, with species richness projected to drop a further 3.5%. These loses are not likely to be uniformly distributed, however, with the largest loses predicted to occur in economically poor but highly biodiverse regions, such as Southeast Asia and Sub-Saharan Africa. Buisness-as-usual results in rapid human population growth and agricultural expansion, and most closely matches recent trends, and yields the most severe losses in biodiversity of any scenario considered by the PREDICTS team. Continuing on as we have been does not bode well for biodiversity or the vital ecosystem services it provides us.
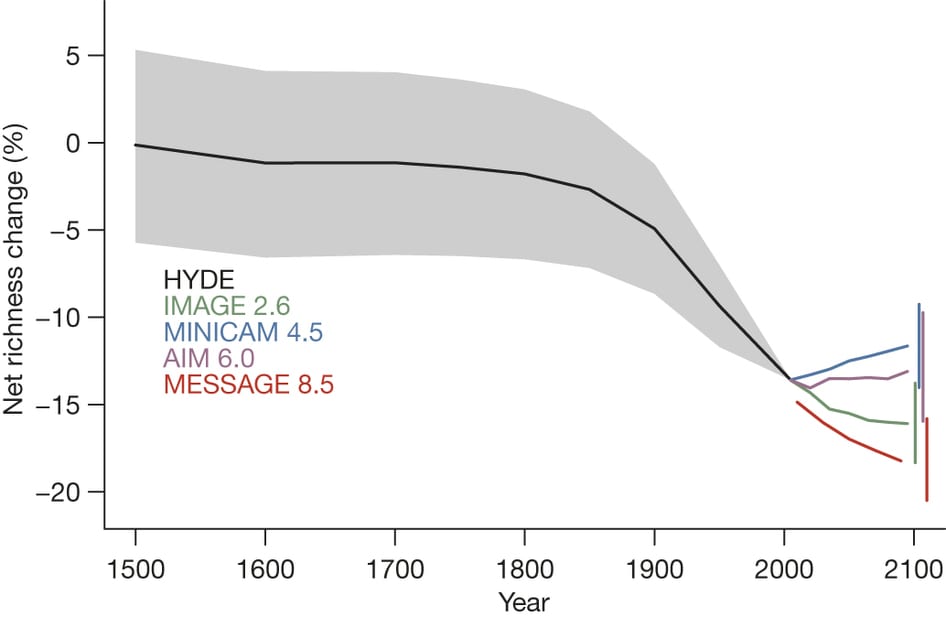
Projected net change in local richness from 1500 to 2095. Source: http://www.nature.com/nature/journal/v520/n7545/abs/nature14324.html.
Perhaps surprisingly, the second-worst scenario for biodiversity is in fact the scenario with the least climate change (IMAGE2.6). This is because this scenario achieved reduced emmisions and climatic change by rapidly converting the world’s forests (primary vegetation) to crops and biofuel. In contrast, the IPCC scenario MiniCAM 4.5, which mitigates climate change through the use of carbon markets, crop improvements and diet shifts, however, is projected to increase average species richness. Not all our possible solutions to curb greenhouse gas emissions and reduce climate change will necessarily spell good news for biodiversity.
It isn’t all bad news, though. The right strategies can promote biodiversity globally, even producing increases in species richness by 2095 of up to 2%, and the PREDICTS team say widespread biodiversity loss is not inevitable. Concerted efforts and the right socioeconomic choices can make long-term global sustainability of biodiversity an achievable goal.
Original Article:
![]()

This research was made possible by funding from the Natural Environment Research Councik (NERC) and the Biotechnology and Biological Sciences Research Council (BBSRC).
Finding Shared Genes Between Species
By Claire Asher, on 7 May 2015
a guest blog by Natasha Glover, written for the 2015 Write About Research Competition.
Did you know we share approximately 98% of our protein-coding genes with chimpanzees? Chimps are commonly referred to as our evolutionary “cousins.” This makes sense to anyone who’s seen Planet of the Apes – chimps and humans share many of the same physical characteristics. But did you also know that we share approximately 90% of our genes with mice? About 70% of our genes with zebrafish? Even about 15% of human genes can be found in fruit flies!
These shared genes are evidence of evolution from a common ancestor and the relatedness of all life on Earth. The shared genes are called homologous genes, or genes which share a common ancestry either between or within species. They can be further classified into two main categories: orthologs, which are pairs of genes that started diverging through speciation, and paralogs, which are pairs of genes that started diverging through gene duplication. Finding and studying homologous genes is important, because the same gene in two different species (orthologs) are more likely to have the same cellular function than two duplicated genes (paralogs).
This brings us to the concept of model organisms, which are representative species studied by many scientists from which the knowledge learned from them can be transferred to other, closely related species. For example, this is why researchers experiment on mice instead of humans to test new drugs. Orthologs between mice and humans allow for observing basic human biological processes in mice, and then transferring the knowledge to humans. Orthologs are also applicable to agricultural research. Imagine if a scientist finds an interesting gene in the model plant Arabidopsis thaliana, perhaps a gene controlling an important agronomical trait like seed size, flowering time, or tolerance to drought. It would be useful to find the ortholog of this gene in another economically important crop such as rice, wheat or soybean in order to exploit the trait of interest.
Homologous genes correspond to shared attributes between species. We can identify the shared traits just by looking at them. But how can we identify orthologs and paralogs at the molecular level, that is, how do we identify these genes by analyzing their sequence? It’s important to keep in mind that the concepts of homology are purely from an evolutionary perspective. Thus, we can deduce orthologous and paralogous relationships between pairs of genes using a phylogenetic tree (See Box 1).
 Box 1. This tree represents the relationship between 5 gene sequences. Each node of the tree either represents a speciation (S1 and S2) or duplication event (star). Thus to know the relation between pairs of genes, you just have to trace them back to their shared node (closest common ancestral copy). In this example, the blue genes between dog and human are orthologous to each other (because they trace back to a speciation event). The red dog and red human genes are also orthologous to each other. However, all the blue genes are paralogous to all the red genes because they trace back to a duplication node. All of these red and blue genes are orthologous to the black (frog) gene, an example of a many:1 relationship.
Evolutionary scenarios and relationships become complicated when dealing with many lineage-specific gene duplications and losses. In plants especially, homologous relationships are hard to infer because of their highly complex genomes compared to animals. Plant genomes tend to be much larger and much more duplicated than animal genomes, making ortholog inference in plants very challenging.
Several algorithms and tools are available to predict homologous relationships between genomes. OMA (Orthologous Matrix) is one of them. It’s a method and database for the inference of orthologs and paralogs among completely sequenced genomes. Launched by Dessimoz and colleagues in 2004, OMA has steadily increased the number of species in the database to 1706, including both prokaryotes and eukaryotes. With its many genomes and accurate orthology prediction, OMA is a great starting point for evolutionary biology and genomics analyses. Recently OMA has undergone its 17th browser release to include a website facelift, gene function prediction, and more support for plant genomes. For plants in particular, there is now over 450 million years of evolution represented with the orthology prediction between the species Selaginella moellendorffii (representing early vascular plants) and Physcomitrella patens (representing the non-vascular plants).
The burst of larger, more complex sequenced genomes in the past decade provides a unique challenge in terms of orthology prediction. OMA tackles this problem, and provides a valuable resource to the scientific community. So, want to find out how many genes humans have in common with yeast? Try OMA.
References
- Altenhoff AM, Dessimoz C. Inferring Orthology and Paralogy. In: Anisimova M, editor. Evolutionary Genomics. Totowa, NJ: Humana Press; 2012. pp. 259–279. Available: http://discovery.ucl.ac.uk/1395519/
- Altenhoff AM, Škunca N, Glover N, Train C-M, Sueki A, Piližota I, et al. The OMA orthology database in 2015: function predictions, better plant support, synteny view and other improvements. Nucleic Acids Res. 2014; gku1158. doi:10.1093/nar/gku1158
 Natasha Glover received her Bachelor of Science and PhD from the Department of Crop and Soil Environmental Science at Virginia Tech in the U.S. Her PhD was focused on plant genomics and biotechnology. She received a Marie Curie International Incoming Fellowship for her first postdoc and worked in Clermont-Ferrand, France at the Institut Nationale de la Recherche Agronomique for 3 years. There, she concentrated on computational biology, with a focus on synteny and duplication in the wheat genome. Natasha is a currently a postdoc based at Bayer CropScience in Ghent, Belgium as part of the Marie Curie PLANT FELLOWS program. Her co-advisor is Dr. Christophe Dessimoz in the department of Genetics, Evolution, and Environment at UCL.
Competitive Generosity Drives Charitable Donations
By Claire Asher, on 17 April 2015
Unconditional generosity is a characteristic of humans on which we pride ourselves, and billions of dollars is donated to hundreds of thousands of charitable organisations every year. But look at it from an evolutionary perspective, and this trait seems difficult to explain. In some situations, giving may have evolved to advertise positive characteristics of the giver in the aim of attracting a mate. Recent research from GEE suggests this may explain the charitable behaviour of men donating to female fundraisers online. Data from over 2500 fundraising campaigns showed that men donate £10 more on average if previous male donors have been particularly generous.
Helping others at random, with no promise of reciprocity in the future, should not be favoured by natural selection as it will tend to disadvantage the altruist. Yet we see people doing just that every day. One theory that may explain selfless, unconditional generosity in humans (and other animals) is the ‘competitive helping’ hypothesis, which suggests generosity may sometimes be used to advertise positive characteristics to potential mates. The hypothesis suggests that people will compete to be the most generous, particularly when they are in the presence of attractive potential mates. If generosity is costly, and competition for mates is tough, then competitive generosity could be favoured by natural selection as a mechanism to honestly communicate quality. Only the best quality males could afford to be so generous, making them more attractive to on looking females.
To test this hypothesis, GEE researcher Dr Nichola Raihani and Professor Sarah Smith from the University of Bristol reviewed 2561 online fundraising pages, and selected 668 that had public donations and an image of the fundraiser. They then calculated the average donation running up to a large donation of £50 or more. They compared these donations with those made after the large donation, according to the gender of the donors and the gender and attractiveness of the fundraiser. They found men tended to give larger amounts after other men had made large donations. Men were also more generous when the fundraiser was an attractive female, giving four times more to female fundraisers following a large donation from another male. Attractive female fundraisers received £28 more during these bidding wars than less attractive females and males!
Interestingly, while this pattern is clear in donations by men, the same is not true for women donating money online. This suggests that male charitable behaviour represents a competitive helping display, favoured by sexual selection as an honest signal of male quality.
“It’s fascinating that evolutionary biology can offer insights into human behaviour even in the modern world. People are really generous and their reasons for giving to charity are generally not self-serving but it doesn’t preclude their motives from having evolved to benefit them in some way. Take eating for example, our primary drive is to dispel the feeling of hunger, which is pleasurable, but the evolutionary purpose is to make sure we don’t starve and die. Generous behaviours can be seen in a similar way – the motivation for performing them doesn’t have to be the same as the evolutionary function.” – Dr Nichola Raihani
Original Article:
![]()
![]()
This research was made possible by funding from the Economic and Social Research Council (ESRC) and the Royal Society.
Annoucing the Winners of the Write About Research Competition
By Claire Asher, on 10 April 2015
Thanks to everyone who entered our Write About Research competition. We received some great entries from GEE students and postdocs, covering a broad range of topics from conservation to genetics. The entries will be posted here over the coming months, so watch this space!
The Winners are…
Drum roll please …
WINNER: David Curnick – “Can Large MPAs Protect Tuna and Sharks?”
RUNNERS UP: Charlie Outhwaite – “The Challenge of Monitoring Biodiversity” and
Natasha Glover – “Finding Shared Genes Between Species”
Winners each receive a £50 gift voucher.
Male Promiscuity Boosts Role of Chance in Sex Chromosome Evolution
By Claire Asher, on 19 March 2015
Humans, like all mammals and birds, determine sex with chromosomes. Whether a fertilised egg develops into a male or female depends on what chromosomes it carries Scientists have long recognised that genes evolve a little differently on the sex chromosomes, and recent research in GEE suggests this may be due to differing patterns of inheritance that favour the influence of chance on gene sequence change. Furthermore, promiscuity in males has a large influence on the magnitude of this effect, with chance playing an even greater role in sex-chromosome evolution in highly promiscuous species. Using genetic sequence data in combination with physical and behavioural measurements of promiscuity in birds, Dr Alison Wright and Professor Judith Mank report strong evidence for the role of neutral forces in sex chromosome evolution.

In birds and mammals, along with some invertebrates and reptiles, sex is determined by the chromosomes you carry – the sex chromosomes, as they are aptly named. If you are a male mammal, you carry one X and one Y chromosome; a female mammal carries two X chromosomes. Similarly, if you are a male bird, you carry two Z chromosomes; a female carries one Z and one W. Whether it’s the XY system, the ZW system or even the UV system used by some species of algae, the result is more or less the same. Sex is determined by the presence or absence of particular chromosomes. This isn’t always the case – some species determine sex using temperature during development, other species determine sex based on social conditions, while others do away with fixed sexes altogether and are either hermaphrodite or possess the ability to switch sex. However, one of the most common, and certainly the best studied, systems among living organisms is to determine sex with chromosomes.
Unlike autosomal chromosomes (all our chromosomes that are not sex chromosomes), sex chromosomes are not inherited and expressed equally across the sexes. The Y and W chromosomes only ever appear in one sex, for example. This has some interesting consequences for evolution. For example, scientists have found that the ‘major sex chromosomes’ (X and Z chromosomes) tend to evolve faster than the autosomes. Known as the Faster-X (or Faster-Z) effect, this phenomenon is now well documented in a range of different species, and scientists have suggested a number of possible explanations for why this might be the case. Faster evolution on the major sex chromosomes might be caused by more effective natural selection favouring beneficial mutations (adaptive hypothesis) or due to less effective natural selection failing to remove harmful mutations (neutral hypothesis).
Why would natural selection act differently on sex chromosomes than autosomal ones? In a paper published in Molecular Ecology this month, Dr Alison Wright explains that the differences between chromosomes arise because of differences in the pattern of inheritance, which ultimately influences the number of chromosomes that are passed on to the next generation, called the effective population size. An individual who never reproduces is an evolutionary dead end, and as their genes are not passed on, and they are not counted in the effective population size. Individuals that do mate contribute sex chromosomes unevenly, and this can have a significant impact on the course of sex-chromosome evolution.

When two individuals mate, they each pass one of each pair of chromosomes to the offspring. Each chromosome has an equal likelihood of being carried by the offspring, and the effective population size (ie chance of being passed on) of all autosomal chromosomes is the same. But for the sex chromosomes, things are a bit more complicated. Each time a pair of individuals mate, between them they bring three major sex chromosomes and one minor chromosome to the table. This translates to major sex chromosomes having an effective population size three times larger than the minor sex chromosomes. And both sex chromosomes have a smaller effective population size than the autosomes.
But that’s only if everybody is monogamous. As soon as promiscuity is involved, things get even more complicated. If males are promiscuous (and they often are, in the animal kingdom), then this means some males in the population are likely to be very successful, while others fail to reproduce at all. In other words, the variance in male mating success is much higher. Promiscuity reduces the effective population size of the minor chromosomes even further.

Why does effective population size matter? Well, the effective population size determines the relative influence of chance on gene sequence evolution. Although we generally think of evolution progressing as natural selection favours beneficial mutations and purges deleterious ones, chance also has a big role to play. Chance, known in this context as genetic drift, has a bigger impact on small populations, and rare mutations. This is because when a particular mutation is rare, it only takes a little bit of bad luck for it to be lost forever. Just think of the times you’ve walked home in the rain only to hear the characteristic crunch of the end of a snail’s life – here your foot is the agent of genetic drift. The death of that snail had little or nothing to do with the genes it carried, but your foot has altered the course of evolution, slightly. The effective population size of autosomal genes reflects the population size of the organisms they are found in, but for the sex chromosomes, their effective population size is even smaller, making them more prone to genetic drift.
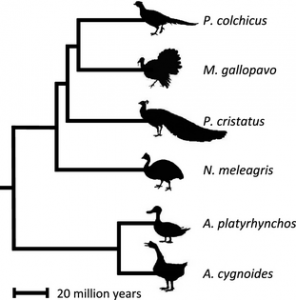
Dr Alison Wright, Professor Judith Mank and colleagues from GEE sequenced expressed genes in six species of birds, spanning 90 million years of evolution, to investigate the rate of evolutionary change in genes on different chromosomes. They compared sequence data from monogamous species like the Swan Goose (Anser cygnoides) and the Guinea Fowl (Numida meleagris) with promiscuous species like the Mallard duck (Anas platyrhynchos), wild Turkey (Meleagris gallopavo), and Peafowl (Pavo cristatus) to investigate how gene sequences and gene expression patterns vary both within and between species. They then matched data on the rate of evolution with characteristics of species that are associated with promiscuity, such as testes weight and sperm number. Their results indicate that natural selection is less effective on the Z chromosome in general, and this becomes even more pronounced in promiscuous species. The authors therefore conclude that Faster-Z evolution in birds is not adaptive, but is driven by neutral processes.
Differences in gene sequences within and between species can tell us a lot about the rate of evolution for different lineages. This is because the genetic code has some redundancy in it – DNA is split up into three-letter words or codons, and there are many cases where different codons translate into the same amino acid. So, it is possible to have genetic sequence change that is essentially invisible to natural selection – it doesn’t alter the resulting protein sequence and so has no influence on the organism. Changes in gene sequence that swap between these ‘synonymous’ codons can therefore give us a rough baseline of neutral change. Non-synonymous differences (the ones that do have an effect on the organism), between individuals or between species, represent the rate of evolution. More non-synonymous changes suggests either positive selection, where evolution favours those changes because they are beneficial, or genetic drift, where selection is weaker and cannot remove slightly harmful mutations from the population. The authors found that genes on the Z chromosome show a faster rate of non-synonymous change than autosomal genes. Further, the ratio was significantly correlated with measures of promiscuity, with more promiscuous species having more non-synonymous changes.
Although this could be a mark of positive natural selection, the authors found no difference in the number of genes undergoing positive selection between sex- and autosomal-chromosomes, suggesting the Faster-Z effect is driven by genetic drift rather than positive selection. In fact, differences within species indicate that natural selection is less effective at removing mildly deleterious mutations from the Z chromosome than the autosomes. Combined with other analyses on gene expression, these results show strong support for the neutral explanation for Faster-Z evolution in birds.
Interesting, promiscuity increases the effective population size of X chromosomes, and that may explain why previous studies have found evidence that Faster-X chromosome may well be due to positive selection. These differences suggest that Z chromosomes may be less important in adaptation than X chromosomes.
Original Article:
![]()

This research was made possible by funding from the Natural Environment Research Council (NERC) and the European Research Council (ERC).
Sloths Move Slow, Evolve Fast
By Claire Asher, on 11 March 2015
 Sloths might be notorious for their leisurely pace of life, but research published last year shows they are no slow coaches when it comes to evolution.
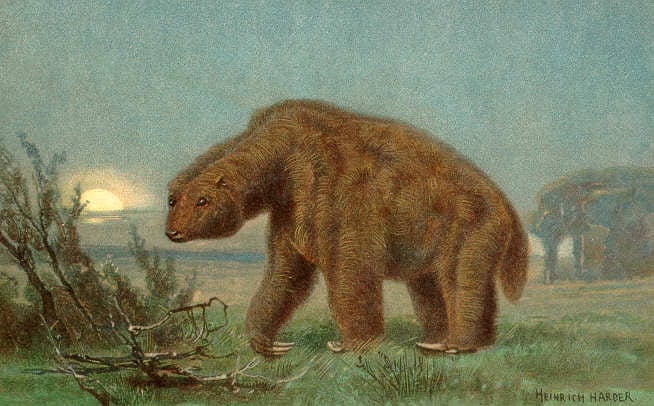
Sloths, as we know and love them, are small, slow-moving creatures found in the trees of tropical rainforests. But modern sloths are pretty odd compared to their extinct relatives. Sloths (Folivora) are represented today by just six species in two families; the Megalonychidae (two-toed sloths) and the Bradypodidae (three-toed sloths). But 20,000 years ago there were perhaps as many as 50 species of sloth spread across the globe, and most were relatively large, ground-dwelling animals quite unlike modern sloths. While most modern sloths weigh in at a modest 6kg, extinct species such as Megatherium americanum and Eremotherium eomigrans could weigh up to 5 tonnes!
Write About Research – A GEE Research Blog Competition
By Claire Asher, on 3 March 2015
The GEE Research blog communicates UCL science with a wider, non-specialist audience, by providing short summaries of recent research in the department of UCL Genetics, Evolution and Environment. This provides an opportunity to engage with a broad audience, including other academics, students, members of the public, and even businesses and policy-makers. It is a great way to increase the reach and impact of your research. Now we’re offering the opportunity to contribute your own writing to the GEE blog – this is your chance to explain your research to the world, to improve your science communication skills, and maybe even win yourself some cash!
Public communication of science is a key skill for any scientist, and is increasingly being appreciated by academics and research councils as an important part of science education and training. It is a totally different medium from traditional academic papers; it offers the freedom to tell a story, but also presents challenges – you must communicate in a way that anybody can understand. Compared to academic journals, popular writing has the potential to reach a far broader range of readers and can have many benefits for your research – for example leading to new collaborations and inviting comment and feedback from readers who would never otherwise come into contact with your work.
If you are interested in writing a guest post for the GEE Research blog, now is your chance! Enter our “Write About Research” contest and not only will your blog post be published online, but you’ll also be in with a chance to win £50!
Guidelines
Your blog should be written in a way such that an ‘educated non-specialist’ audience can understand and follow it. You can therefore assume a GCSE-level science background and jargon should be explained the first time you use it. Blogs should begin with a short opening paragraph that sets the scene – basically the abstract of the blog post – summarising the key points of the article and leading the reader into the post. The rest of the post should provide background, a summary of the focus paper(s) and should end with a broad conclusion, setting the research into the larger context, and highlighting it’s relevance and importance. Take a look at other GEE blog posts for an idea of what we’re looking for.
Choosing a Topic
- Your blog post must cover your overall area of research
- Entries should focus on one or two key papers
- You could therefore write about one of your own publications or a recent publication in your area of research. Alternatively, you could write a general background to your research area, focussing on a few key (but not necessarily recent) papers in that field.
- Just be sure not to scoop yourself – please don’t write about your own research that has not yet been published, or assessed work (e.g. MSc project) that has not yet been assessed.
- If you are unsure whether your idea fits the criteria, feel free to contact c.asher@ucl.ac.uk with any queries
Eligibility
You must be an MSc, MRes or PhD Student, or a PostDoc undertaking a research project (or having completed a research project in the last 12 months) in the UCL Department of Genetics, Evolution and Environment.
How to Enter
- One entry per person
- Entries must be between 600 and 1200 words
- All entries must include a reference list including any published papers that you refer to directly. In-text referencing is not necessary. The reference list does not count towards the word count.
- Send your entry, along with a 150-word biography to c.asher@ucl.ac.uk
- Please also recommend at least one photo to include with the post (either your own image or one from Wikimedia commons).
- Entries must be received by 5pm 31st March 2015
Prizes and Publication
- We will be posting all blog entries on the GEE Research blog over the next year (between April 10th 2015 and April 9th 2016).
- Additionally, there will be a £50 gift voucher for each of the three best entries, as judged by Dr Claire Asher
- Entries will be judged by Dr Claire Asher, and winners announced on 10th April 2015
- Winners will be announced in a specific post on the GEE Research blog, and will bear no relation to the order in which each blog post is subsequently posted on the site.
If you have any questions or queries about the contest, please feel free to contact c.asher@ucl.ac.uk.
Good Luck!