X Close

GEE Research

Home

Research in Genetics, Evolution and Environment

Menu

Archive for the 'Guest Blog' Category

The Challenge of Monitoring Biodiversity

By Claire Asher, on 4 August 2015

a guest blog by Charlie Outhwaite, written for the 2015 Write About Research Competition.

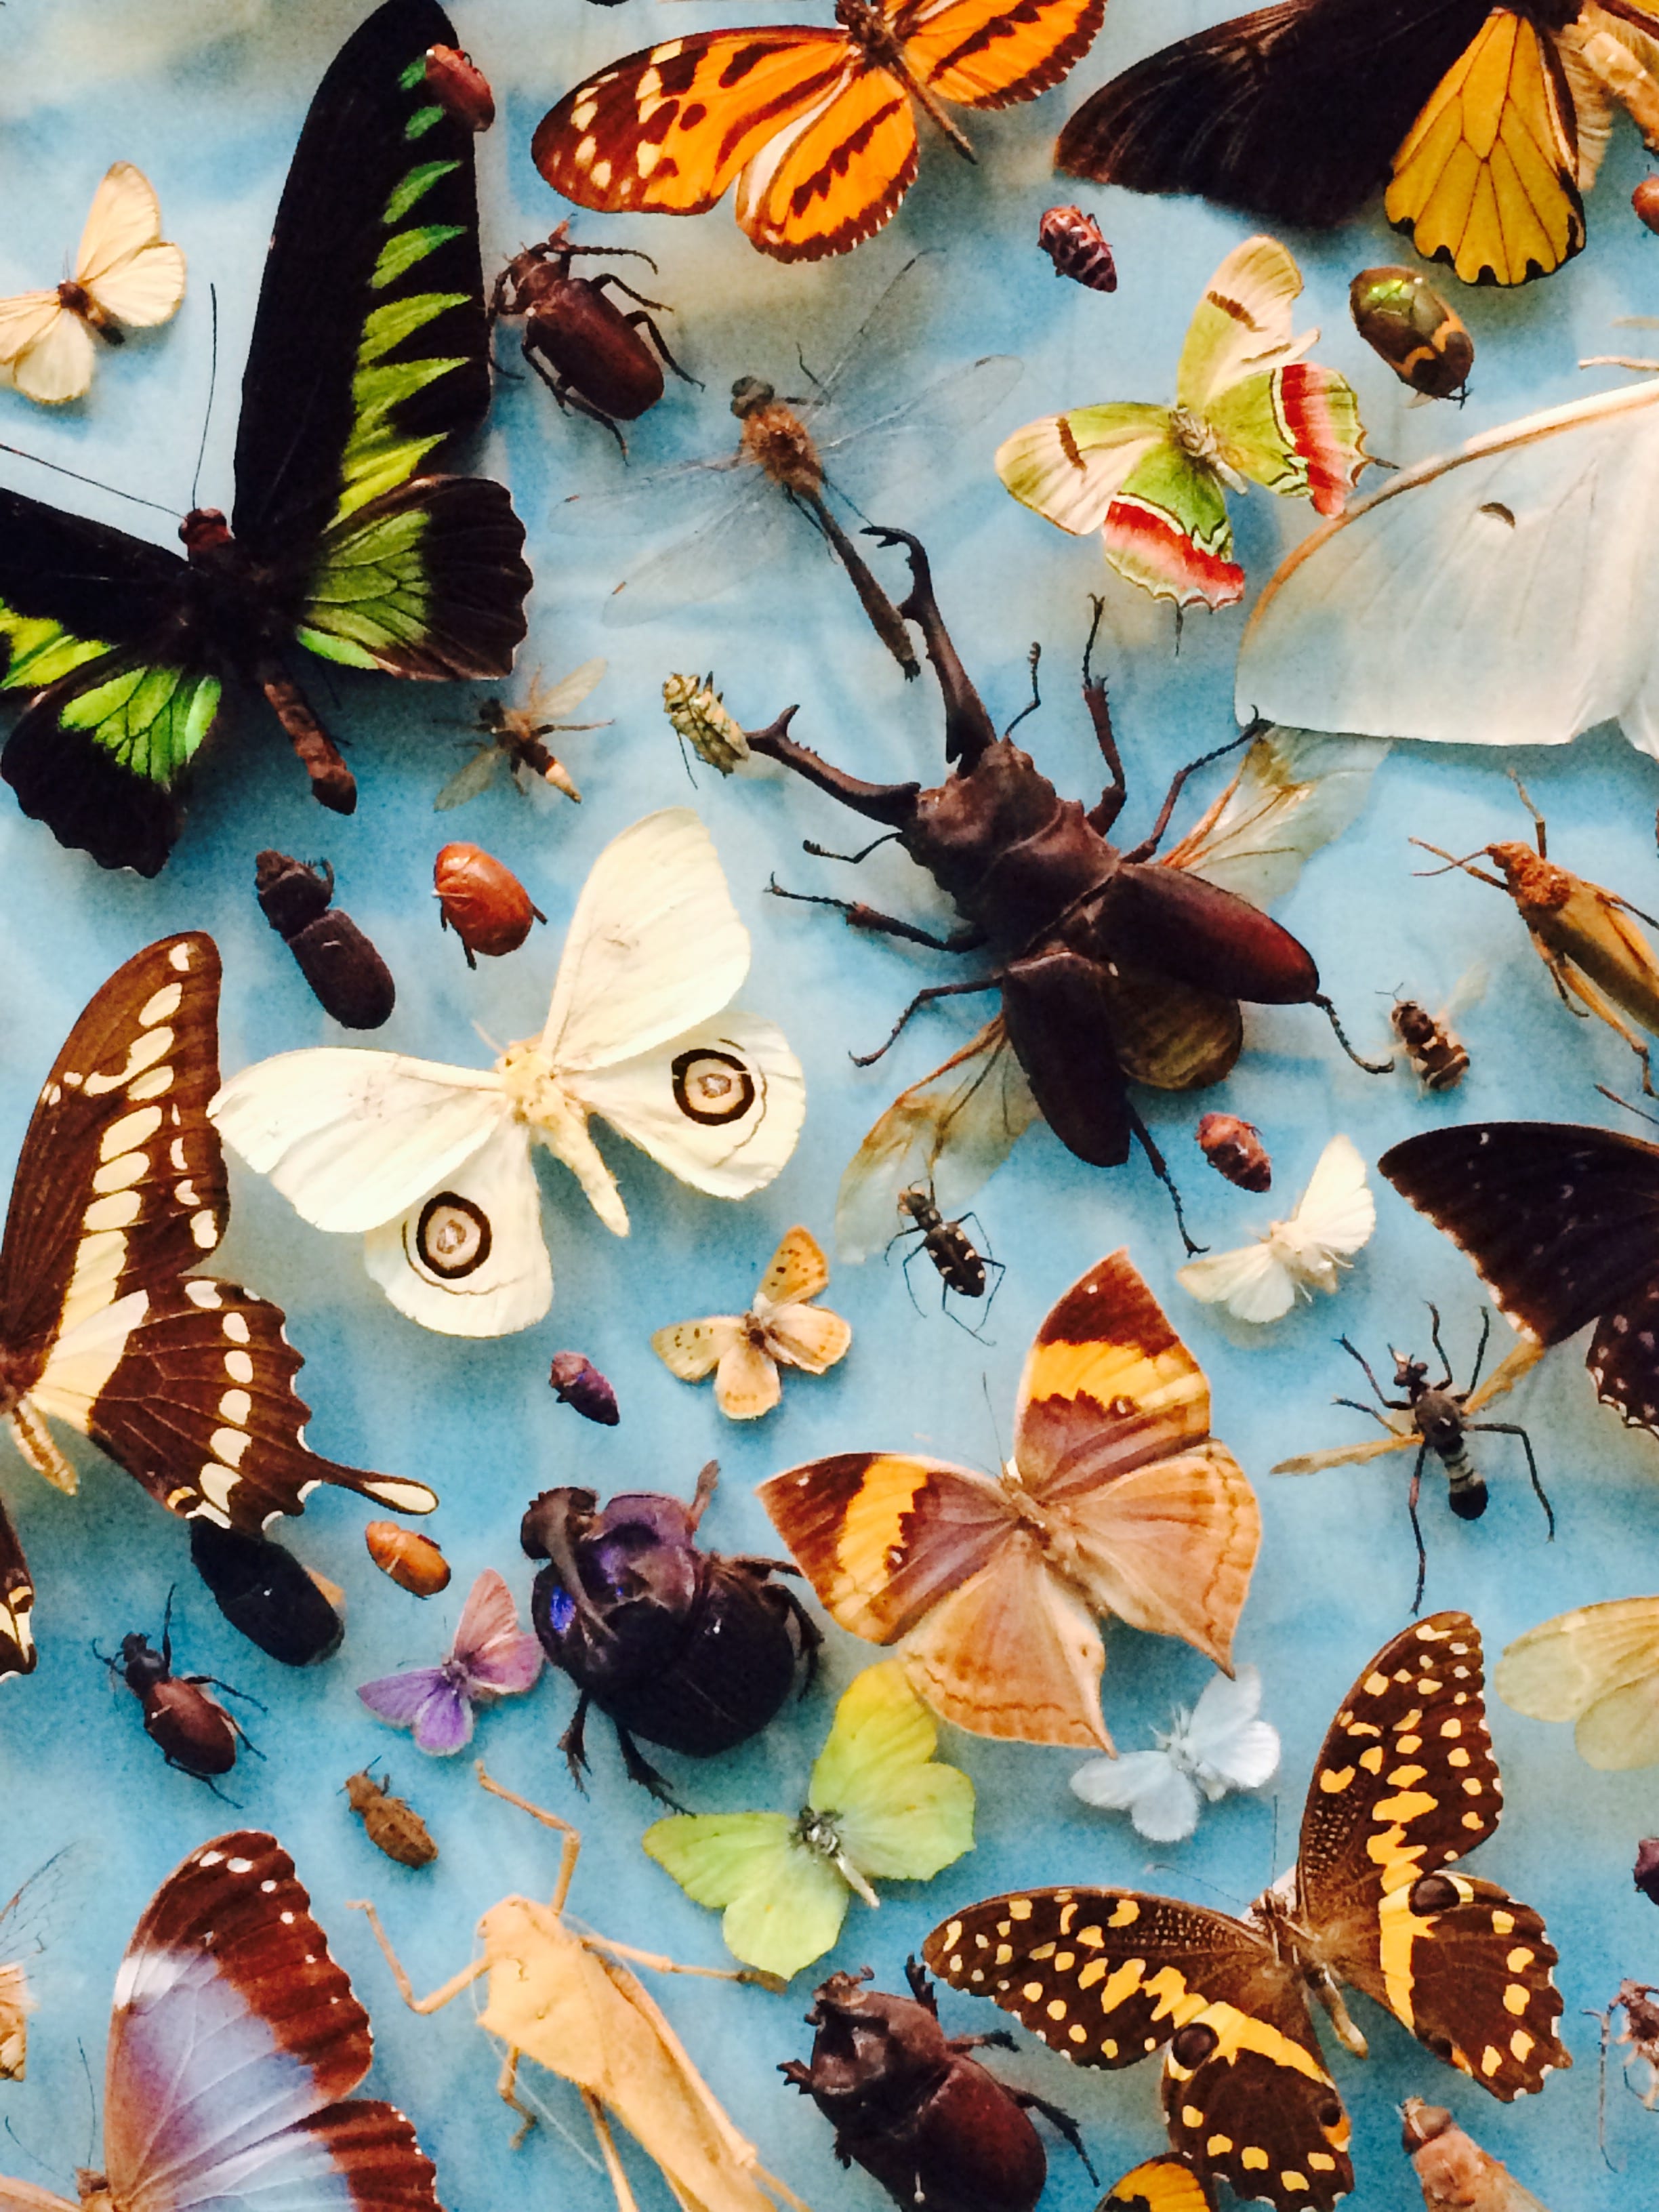
Biological diversity, or biodiversity, is a complex term encompassing the variety of life found on Earth. It incorporates not only differences between species but within species themselves and of the environments and ecosystems where they are found. We as humans benefit a great deal from the biodiversity on Earth in a range of ways; from the clean air we breathe to food, materials and medicines that are produced as a result. These products or services are known as ecosystem services and these services depend on biodiversity. Monitoring the status of biodiversity is therefore an important area of research, but offers its own challenges. New methods offer the chance to utilise data that has been underused in the past due to its associated biases and we are now able to explore and monitor the responses of biodiversity over time for many more species than has previously been possible. This has opened the door not only to more knowledge on a greater range of species but also allows us to look into what aspects are influencing these changes, such as the impact of climate change.

In April 1992, an agreement was signed by a number of government parties to the Convention on Biological Diversity (CBD) agreeing to the global target “to achieve by 2010 a significant reduction of the current rate of biodiversity loss”. Unfortunately, this target was never achieved and so, in 2010 an updated plan was established at the tenth meeting of the Convention in Nagoya, Japan. This revised plan includes 20 main targets, known as the Aichi Biodiversity targets, under 5 strategic goals each encompassing one aspect to benefit biodiversity.

BiodiversityMonitoring_fig1

In order to measure progress towards these targets, at both a national and a global scale, a number of indicators of change have been developed, these are often simple graphs showing increases or decreases in the variable being monitored. For the UK, these are published annually by DEFRA (the Department for Environment, Food and Rural Affairs) in the Biodiversity Indicators in your Pocket report (BIYP). Indicators are composite measures of change and are a simple and easy way to communicate change over time. The most recent BIYP report includes a suite of indicators aimed to report on UK progress towards the Aichi targets. These range from indicators of change in volunteer time spent in conservation organisations to assess progress towards strategic goal A (Address the underlying causes of biodiversity loss by mainstreaming biodiversity across government and society) to indicators of the status of UK priority species for Strategic Goal C (To improve the status of biodiversity by safeguarding ecosystems, species and genetic diversity).

However, the monitoring of aspects of the goals is not simple and biodiversity itself provides a great challenge. Take target 12 for example; “By 2020 the extinction of known threatened species has been prevented and their conservation status, particularly of those most in decline, has been improved and sustained”. In order to assess whether the decline and extinction of threatened species has been prevented we need to be able to measure how many there are in the first place, and how that changes over time. Ideally, we would like to go out and count exactly how many there are of each species, but of course this is not possible. It would be difficult enough going out and counting every species in your own garden, let alone across the whole country. So, we have to use the next best alternative. In some cases, standardised monitoring schemes such as the Breeding Bird Survey are set up and species numbers are monitored using standardised techniques across specific sites. This data can then be used to accurately estimate the abundance of those species observed. However, this kind of data is costly to collect and requires a lot of time and effort and so, is not available for the majority of species.

An alternative form of data is biological records. Biological records are a data type that is high in quantity but has a number problems associated with it. Often collected by volunteers through citizen science projects, this type of data can be highly variable in its level of accuracy and completeness. However, with interest and participation in citizen science increasing, the amount of biological records data available is rising. With so much data on hand, and often for those groups of species that are less well studied (such as insects) and for which monitoring scheme data is unavailable, it is important that these data are put to good use. However, because of the problems associated with this data type, it is underused and underappreciated. The main problem is that it is collected in an unstandardized way, which introduces bias into the data. Records will often be collected by an individual at a location of their choosing and they may not report every species they see.

A number of robust statistical methods have been developed that are able to account for these associated biases. Bayesian occupancy models are a complex statistical technique which has been shown by Isaac et al (2015) to most effectively account for the biases of this type of data and produce reliable indicators of change. It is now being used to monitor changes in the biodiversity of less well studied groups of species using biological records from various recording schemes. For these species groups, this kind of data is all that is available and so employing these new methods for analysing biological records is enabling greater research into areas where little is currently known.

However, with human induced drivers being the biggest threat to biodiversity loss, it is not enough to simply monitor changes in species trends. There is a growing need to understand what is causing these trends and how a species’ traits can increase its susceptibility towards these drivers. Through a more thorough understanding of the effects drivers such as climate change have on a group of species, and which species within that group will be most affected, it would be possible to design conservation interventions to target those species most at risk, preventing future declines. This process could act as a form of triage, in determining those species that will be most affected so that conservation and policy action can be targeted to those areas in the first instance. This is becoming increasingly urgent as a mid-term report on progress towards meeting the CBD 2020 targets by Tittensor et al indicates that progress is not positive.

References

  • Defra (2014) UK Biodiversity Indicators 2014: Measuring progress towards halting biodiversity loss. Retrieved from http://jncc.defra.gov.uk/page-4229
  • Isaac, N. J. B., van Strien, A. J., August, T. A., de Zeeuw, M. P., & Roy, D. B. (2014). Statistics for citizen science: extracting signals of change from noisy ecological data. Methods in Ecology and Evolution, doi:10.1111/2041-210X.12254
  • Tittensor, D. P., Walpole, M., Hill, S. L. L., Boyce, D. G., Britten, G. L., Burgess, N. D., … Parks, B. C. (2014). A mid-term analysis of progress toward international biodiversity targets, (October), 1–8.

CharlieOuthwaiteCharlie is a first year PhD Student based at the Centre for Ecology and Hydrology, Wallingford and working within the Biological Records Centre. Charlie’s PhD is linked with CBER UCL and the RSPB through a CASE partnership. Her research is looking into biodiversity status, drivers and indicators from biological records. Charlie’s interest in measuring and reporting changes in biodiversity has grown since working as an intern and research assistant within the Indicators and Assessments Unit at the Institute of Zoology. Within these roles she worked on the Living Planet Index and on developing a Canadian biodiversity indicator. Going from the reporting and development side of indicators she now hopes to reveal the role of drivers of change and how these interact with species traits to affect changes in biodiversity.

Anti-Ageing: Health or Beauty?

By Claire Asher, on 7 July 2015

a guest blog by Jorge I. Castillo-Quan, written for the 2015 Write About Research Competition.

If you had not heard of the term anti-ageing you have not noticed spam emails, television advertising, and articles in magazines. The term anti-ageing has definitely permeated our society. Most scientists struggle to explain to their non-scientist friends what their research is about. When I tell my friends I study ageing and anti-ageing interventions, almost everyone has an idea of what that means. Or at least they think they do. Some people think I am developing the latest generation of creams that will make wrinkles disappear, or that I am finding remedies to prevent greying hair, or the solution that will avoid balding, or even make stretch marks go away. Those with more imagination, think I am trying to defeat death and make people immortal. However, none of these ideas are in any way close to what I do. I explain to them that I do my research on ageing using the fruit fly Drosophila melanogaster. Yes, I work with those little flies that lurk around your kitchen. If you are now thinking why on Earth are you studying fly ageing, I do not blame you. I thought this once too. The first thing you should know is that I am not interested in making immortal flies (though that could be cool!), nor is my aim to understand how flies age per se. The simplest explanation is that studying ageing in an organism that is less complex than humans is more convenient and faster. After all we share 60% of our DNA with the fly. Although we look very different more than half of our genes have a counterpart in the fly. Similar things can be said about the roundworm Caenorhabditis elegans which shares 40% of our DNA. But why use these organisms that seem so unrelated to us? They have shorter lifespans and show traits of ageing. For example, as worms and flies age, they lose their ability to move properly. Is true that we do not wiggle around like worms, or fly and climb as much as flies do, but these rather specific behaviours are controlled in similar ways by locomotor programmes, some of which are similar between species. Hence, we can use these as readouts of how quickly a worm or fly is ageing. Furthermore, worms in laboratories only live about 2-3 weeks, while flies about 3 months. If you were to compare these lifespans with that of the more traditional laboratory organism, the mouse, you will find that you would be able to complete over 10 survival experiments in flies while only completing one survival experiment using mice, that live around 3 years. Each organism has its advantages. Worms are transparent so you can look and examine how every organ is changing over time. But while they do have a semi-organised neuronal system, they do not have a proper brain. Flies do, and research studying the development and organisation of the fly brain has advanced our understanding of the human brain so much so that it has been awarded several Nobel prizes in Physiology or Medicine.

Antiageing_fig1

Having established that flies are simpler than mammals like us and mice, and that they are relatively short-lived, the question remains, how am I developing the latest generation of anti-ageing creams using Drosophila? I have to be honest here and say that I am not working on this. Although the term anti-ageing is more commonly associated with these kind of interventions this is not the aim of my research. I study ageing to try to understand its biological principles and what drives it. I am sure that you thought that this is exactly what the multi-million anti-ageing industry is doing, but no. Although some (very little) of what is going on in the big wide world is labelled as scientifically proven, it is not. Or not at the standard that is required for prescription pills and creams you get from your GP or other health professionals. The anti-ageing industry as we know it is not regulated and is merely cosmetic. When biogerontologists (biologist studying ageing) talk about anti-ageing, we talk about physiology (function), health and disease. I try to study ageing to improve health during old age. Ageing is the major risk factor for many of the killer diseases of our time, like diabetes, cardiovascular disease and cancer. Understanding what makes aged bodies vulnerable to threat of these diseases should be a major concern of our generation. As our societies are growing older it is expected that our health systems will be overwhelmed with treatments for patients suffering from these chronic conditions. No hospital running on public funds will see you for wrinkles or stretch marks when you are 65, but they certainly have to see you for a growing lump, forgetfulness, urinary problems and other serious health issues.

Using model organisms like flies and worms we have been able to establish that specific genes have the ability to enhance longevity and health when appropriately manipulated. For example, the first genetic manipulations that showed that an organism could live healthier for longer came from research using worms. Later it was shown that the same interventions in flies and mice had similar effects and these organisms also lived healthier for longer. Nowadays, we have a more comprehensive understanding of what genes need to be manipulated to delay deterioration with age and, in some cases, even prevent the onset of diseases. Of course all of this is in worms, flies and mice. To jump to humans, interventions need to be less of the genetic kind and more on the drug side. With our current knowledge of ageing we are now trying to find ways to manipulate the function of genes with drugs. The good news is that it seems that this is possible. We do not need to manipulate the genes of an organism to delay the ageing process; this can be achieved by supplementation with specific compounds at specific doses, and in some cases at specific time of life. However, for humans to be able to take these anti-ageing interventions they need to be appropriately tested and regulated by agencies in charge of ensuring their safety for human consumption. We must continue to wait patiently…

For far too long we have considered growing older as two extremes, either as a burden to society, or as the great achievement of our generation. After all living to a 100 was quite rare 100 years ago. We should celebrate our older population and the best way is by enhancing their health and allowing them to live a fulfilling life, not one of deterioration and despair.

Next time you see an anti-ageing cream, think about this: would I rather have beauty or health? If the latter is your choice, just wait a little bit longer, we are working on it.

References

  • Juengst ET, Binstock RH, Mehlman M, Post SG, Whitehouse P. Biogerontology, “anti-aging medicine,” and the challenges of human enhancement. Hastings Cent Rep. 2003 Jul-Aug;33(4):21-30
  • Partridge L. The new biology of ageing. Philos Trans R Soc Lond B Biol Sci. 2010 Jan 12;365(1537):147-54
  • Rose MR.Can human aging be postponed? Sci Am. 1999 Dec;281(6):106-11
  • Stipp D. A new path to longevity. Sci Am. 2012 Jan;306(1):32-9

JorgeCastilloQuanJorge graduated with a Medical degree from the Autonomous University of Yucatan, Mexico. After this he completed an MSc in Clinical Neuroscience at the UCL Institute of Neurology, and a PhD in Genetics, Neuroscience and Biogerontology from the UCL Institute of Healthy Ageing (IHA). Currently he works as a Research Associate at the UCL IHA and Research Department of Genetics, Evolution and Environment.

Watch Jorge’s TEDx talk elaborating on the topic:

“Anti-Ageing: Beauty or Health?”

Can Large MPAs Protect Tuna and Sharks?

By Claire Asher, on 4 June 2015

a guest blog by David Curnick, written for the 2015 Write About Research Competition.

With a global human population of over 7 billion it is becoming ever more important to manage our natural resources effectively. For centuries, the oceans have been seen as an endless bounty, ripe for harvesting. However, this simply isn’t the case and concerns are growing over the status of many fish populations, particularly those of predatory fish, and this has led to concerns over potential impacts on food webs and ocean health. A number of management initiatives have been adopted in an attempt to address these perceived declines such as restrictions on fishing gear, catch limits, closed seasons and the establishment of marine protected areas (MPAs).

Recently, there has been a growing trend for the establishment of large MPAs, such as that around the Chagos archipelago in the Indian Ocean, as countries attempt to meet global conservation targets (e.g. the Convention on Biological Diversity states that 10% of the ocean should be under protection by 2020). However, whilst the benefits of smaller coastal MPAs have been widely documented, there is uncertainty about their effects on wide-ranging oceanic species, such as tunas and sharks. This is because oceanic species tend to utilise the open ocean more than their coral reef counterparts and therefore have the potential to cross MPA boundaries and render such reserves obsolete. Therefore, for spatial management to work for these wide-ranging species, the MPAs would need to be large enough to either encapsulate the entirety or a significant proportion of their home range, or protect them during crucial life stages such as during breeding or to provide nursery grounds.

Given society’s fondness of tuna, you would think that we would know everything there could possibly be to know about our easily tinnable friends. Unfortunately, unlike the well-documented migration of wildebeest, migratory patterns in tuna are not that well understood, and nor are many of their life histories. In fact, the range size of tunas, a key consideration for spatial management, is hotly debated in the literature. Sibert and Hampton (2003) suggested that the average lifetime distance travelled for skipjack tunas in the Pacific Ocean ranged from 420 to 470 nautical miles (nm) and that for yellowfin tuna it was about 20% less. This led Sheppard (2010) to propose that, should this also hold true for populations in the Indian Ocean, then potentially there is a large resident tuna population within the Chagos MPA year-round. The fact that a longline fishery used to operate in Chagos throughout the year seems to support that there are at least tunas in Chagos year round, although whether they are the same individuals is impossible to say at the moment. In contrast to Sibert and Hampton’s findings, Hallier and Million (2012) found that tunas tagged off East Africa, the Seychelles and the Maldives travelled significantly further, with an average of 800nm for yellowfin, and 600nm for bigeye and skipjack tuna. Such a large discrepancy in range estimates existing between sub-populations of species only serves to highlight our lack of understanding, and could be the difference between a marine reserve proving effective or not. An additional issue with these tagging programmes is that they are based on simple mark-recapture studies and therefore we have no idea of the route that the tuna took between point A and B (being tagged and being re-caught). Maybe they actually travelled much further than the estimates, or maybe they spent 90% of their time in one location. We simply do not know from these data. It is also apparent that both of these studies assume that all individuals within a population follow the same migratory pattern and that behavioural traits of species are similar across regions and even oceans. In reality, neither of these assumptions is likely to hold true and therefore we need to investigate the tuna populations on a case by case basis to understand the specific ecology of these animals better.

So how are we addressing this knowledge gap in Chagos? Well, until recently, our knowledge of oceanic predators in Chagos was limited to historical fisheries records and a handful of observations on coral reef focused scientific expeditions. Together with colleagues from Stanford University, the University of Western Australia, the Bertarelli Foundation and the Zoological Society of London, we have been studying sharks and other ocean giants within the Chagos MPA to try and find out exactly what role the reserve has within the context of the wider Indian Ocean, and if it truly can protect wide-ranging species. Covering 640,000km2, Chagos is certainly large, in fact it’s about the same size of mainland France. Oceanic sharks, like tunas, are often branded as ‘highly migratory’, but a number of studies have shown these species to exhibit site-fidelity around nutrient-rich seamounts and upwellings which are known to be abundant in Chagos. If high site-fidelity is observed in sharks around Chagos, this would indicate that the reserve may be of huge benefit to sharks, tuna and other migratory species in the Indian Ocean. Alternatively, sharks may range far beyond the boundaries of the reserve and this may therefore raise questions of its efficacy for these species. Through satellite tagging sharks and tunas, we will get high resolution data on their movements which will help us to understand how much time they spend within this mega reserve, whether there are any hotspots of activity or aggregations that could suggest feeding or breeding grounds, and how connected populations are with others across the Indian Ocean. So far, 152 sharks and 25 manta rays have been tagged in Chagos in order to find out their movements inside and outside the reserve. Only through understanding these key baseline data can we then start to assess the potential impact of the Chagos MPA.

A final point to note is that in terms of marine resource management, we are currently operating with one hand tied behind our back. Why? Well, in the current legislative environment, marine reserves and other initiatives can only really be established within the 200nm national jurisdiction (Exclusive Economic Zone – EEZ) of willing countries. This means that within the ocean beyond, which amounts to 64% of the ocean and 50% of our planet, management options are limited. Previous studies have suggested that, particularly within the Indian Ocean, important breeding grounds for tunas may exist within this legal black hole. Therefore it is quite possible that our best chance for ocean sustainability is currently just beyond our 200nm reach.

References

  • Altenhoff AM, Dessimoz C. Inferring Orthology and Paralogy. In: Anisimova M, editor. Evolutionary Genomics. Totowa, NJ: Humana Press; 2012. pp. 259–279. Available: http://discovery.ucl.ac.uk/1395519/
  • Altenhoff AM, Škunca N, Glover N, Train C-M, Sueki A, Piližota I, et al. The OMA orthology database in 2015: function predictions, better plant support, synteny view and other improvements. Nucleic Acids Res. 2014; gku1158. doi:10.1093/nar/gku1158

DavidCurnickDavid Curnick has a recreational fishing background, over 12 years’ experience working with in the fields of fish biology and ecology, and has been researching Chagos megafauna for the last 5 years. He was part of the February 2014 Vava II research expedition focusing on shark biology and behaviour and also the Darwin Funded 2014 reef expedition. He has experience tagging several species including reef shark (grey, blacktip) oceanic (silvertip, silky), mantas and billfishes. He is currently reading for a PhD at UCL on the role Chagos plays in the conservation of pelagic predators such as sharks and tunas analysing both tagging and fisheries data. David satellite tags pelagic sharks to understand how they utilise the reserve in both space and time. He also tweets regularly from @d_curnick

Finding Shared Genes Between Species

By Claire Asher, on 7 May 2015

a guest blog by Natasha Glover, written for the 2015 Write About Research Competition.

Did you know we share approximately 98% of our protein-coding genes with chimpanzees? Chimps are commonly referred to as our evolutionary “cousins.” This makes sense to anyone who’s seen Planet of the Apes – chimps and humans share many of the same physical characteristics. But did you also know that we share approximately 90% of our genes with mice? About 70% of our genes with zebrafish? Even about 15% of human genes can be found in fruit flies!

These shared genes are evidence of evolution from a common ancestor and the relatedness of all life on Earth. The shared genes are called homologous genes, or genes which share a common ancestry either between or within species. They can be further classified into two main categories: orthologs, which are pairs of genes that started diverging through speciation, and paralogs, which are pairs of genes that started diverging through gene duplication. Finding and studying homologous genes is important, because the same gene in two different species (orthologs) are more likely to have the same cellular function than two duplicated genes (paralogs).

This brings us to the concept of model organisms, which are representative species studied by many scientists from which the knowledge learned from them can be transferred to other, closely related species. For example, this is why researchers experiment on mice instead of humans to test new drugs. Orthologs between mice and humans allow for observing basic human biological processes in mice, and then transferring the knowledge to humans. Orthologs are also applicable to agricultural research. Imagine if a scientist finds an interesting gene in the model plant Arabidopsis thaliana, perhaps a gene controlling an important agronomical trait like seed size, flowering time, or tolerance to drought. It would be useful to find the ortholog of this gene in another economically important crop such as rice, wheat or soybean in order to exploit the trait of interest.

Homologous genes correspond to shared attributes between species. We can identify the shared traits just by looking at them. But how can we identify orthologs and paralogs at the molecular level, that is, how do we identify these genes by analyzing their sequence? It’s important to keep in mind that the concepts of homology are purely from an evolutionary perspective. Thus, we can deduce orthologous and paralogous relationships between pairs of genes using a phylogenetic tree (See Box 1).

SharedGenes_fig1Box 1. This tree represents the relationship between 5 gene sequences. Each node of the tree either represents a speciation (S1 and S2) or duplication event (star). Thus to know the relation between pairs of genes, you just have to trace them back to their shared node (closest common ancestral copy). In this example, the blue genes between dog and human are orthologous to each other (because they trace back to a speciation event). The red dog and red human genes are also orthologous to each other. However, all the blue genes are paralogous to all the red genes because they trace back to a duplication node. All of these red and blue genes are orthologous to the black (frog) gene, an example of a many:1 relationship.

Evolutionary scenarios and relationships become complicated when dealing with many lineage-specific gene duplications and losses. In plants especially, homologous relationships are hard to infer because of their highly complex genomes compared to animals. Plant genomes tend to be much larger and much more duplicated than animal genomes, making ortholog inference in plants very challenging.

Several algorithms and tools are available to predict homologous relationships between genomes. OMA (Orthologous Matrix) is one of them. It’s a method and database for the inference of orthologs and paralogs among completely sequenced genomes. Launched by Dessimoz and colleagues in 2004, OMA has steadily increased the number of species in the database to 1706, including both prokaryotes and eukaryotes. With its many genomes and accurate orthology prediction, OMA is a great starting point for evolutionary biology and genomics analyses. Recently OMA has undergone its 17th browser release to include a website facelift, gene function prediction, and more support for plant genomes. For plants in particular, there is now over 450 million years of evolution represented with the orthology prediction between the species Selaginella moellendorffii (representing early vascular plants) and Physcomitrella patens (representing the non-vascular plants).

The burst of larger, more complex sequenced genomes in the past decade provides a unique challenge in terms of orthology prediction. OMA tackles this problem, and provides a valuable resource to the scientific community. So, want to find out how many genes humans have in common with yeast? Try OMA.

References

  • Altenhoff AM, Dessimoz C. Inferring Orthology and Paralogy. In: Anisimova M, editor. Evolutionary Genomics. Totowa, NJ: Humana Press; 2012. pp. 259–279. Available: http://discovery.ucl.ac.uk/1395519/
  • Altenhoff AM, Škunca N, Glover N, Train C-M, Sueki A, Piližota I, et al. The OMA orthology database in 2015: function predictions, better plant support, synteny view and other improvements. Nucleic Acids Res. 2014; gku1158. doi:10.1093/nar/gku1158

NatashaGloverNatasha Glover received her Bachelor of Science and PhD from the Department of Crop and Soil Environmental Science at Virginia Tech in the U.S. Her PhD was focused on plant genomics and biotechnology. She received a Marie Curie International Incoming Fellowship for her first postdoc and worked in Clermont-Ferrand, France at the Institut Nationale de la Recherche Agronomique for 3 years. There, she concentrated on computational biology, with a focus on synteny and duplication in the wheat genome. Natasha is a currently a postdoc based at Bayer CropScience in Ghent, Belgium as part of the Marie Curie PLANT FELLOWS program. Her co-advisor is Dr. Christophe Dessimoz in the department of Genetics, Evolution, and Environment at UCL.