 Close
Close

PREDICTS Project: Global Analysis Reveals Massive Biodiversity Losses
By Claire Asher, on 21 May 2015
The changing climate is only one of a myriad of pressures faced by global biodiversity – we are also changing habitats and altering land-use on an unprecedented scale. The first global analysis published from the PREDICTS project reveals the striking global effect of land-use change on local biodiversity patterns, and highlights the importance of future climate-mitigation strategies in shaping the future of biodiversity and the vital ecosystem services it provides.
Human activities are causing widespread change to and degradation of habitats, which has been linked to serious biodiversity declines globally. Land-use change comes in many forms, from deforestation and agriculture to urban development and road-building, and previous work by the PREDICTS project has shown how different types of land-use influence different types of species differently. We are interested in biodiversity loss at a global scale, and many metrics aim to quantify this, but viewing global patterns can obscure local-scale changes that are likely to be more important for the resilience of ecosystem services. Ecosystem services include clean air and water, food, medicine and nutrient cycling, among others, and are vital both for biodiversity and for human survival and well-being. The PREDICTS project considers local-scale changes to biodiversity in response to land-use change, to produce a powerful model that can be used to project the impact of future land-use and climate change. In their latest paper, published in Nature last month, the PREDICTS team reveal their most comprehensive analysis to date, showing massive reductions in local biodiversity since 1500, and projecting further widespread losses under several future climate and land-use scenarios. There is still hope, however, and strategies to mitigate greenhouse gas emissions without major land-use change could offer the opportunity for global biodiversity to recover.
Understanding the Past and Present

The PREDICTS team have assembled a database of over 1,130,000 records of species abundance and nearly 330,000 records of species richness across more than 11,000 sites worldwide. The database includes results from 284 scientific publications, and represents over 25,000 species. Using this incredible resource, the team compared species richness and abundance between sites with different land-use types and produced a statistical model to quantify local biodiversity responses to land-use change. This enabled them to infer changes in species assemblages since the year 1500.They found that species richness and total abundance were both strongly influenced by land-use type and intensity, with reductions in biodiversity outside of primary vegetation and the worst losses seen in intensively used areas. Local biodiversity was also negatively impacted by human population density and accessibility (measured by the distance to the nearest main road). In the worst-affected habitats, changing land-use away from primary vegetation reduced species richness and abundance by an average of about 40%, and globally, land-use change was responsible for an average reduction in species richness and abundance of around 9%. The value of secondary vegetation (forest recovering from past damage) for biodiversity depended strongly on how mature the habitat was, with species diversity increasing over time, and mature secondary vegetation most closely resembling primary habitats. Restoration projects do, therefore, have the power to return biodiversity to damaged habitats, but (unsurprisingly!) it will take time.
Previous estimates have suggested that local losses of species richness and diversity greater than 20% are likely to substantially impair ecosystem services contributed to by biodiversity and reduce overall ecosystem function. Some scientists believe biodiversity loses at this scale may push populations towards ‘tipping points’ where ecosystem function declines lead to further species loss. Thus, in the worst-affected habitats considered by the PREDICTS team, which experienced on average a 31% loss of local species richness, ecosystem function is likely to be substantially impaired.
Changes in species richness and abundance may underestimate the real impact of land-use change because the measure fails to capture the composition of a community. The team therefore compared the species composition between sites and found that communities tended to be similar under similar land-use. Communities living in primary and secondary vegetation were most alike, while more disturbed habitats such as plantation forest, pasture and cropland tended to support a different cluster of more human-tolerant species. Human-dominated landscapes lost far more natural local diversity than more pristine sites where natural vegetation remains.
Reconstructing past biodiversity loss indicated that the greatest reductions in species richness occurred in (unsurprisingly) the 19th and 20th centuries, and that by 2005 local species richness worldwide had reduced by 13.6% due to land-use change and related anthropogenic pressures. How will this trend continue into the future?
Projecting the Future
The PREDICTS team then went on to combine their analysis of current species’ responses to land-use change with four climate scenarios produced by the Intergovernmental Panel on Climate Change, to project future changes in biodiversity under different socioeconomic scenarios of land-use change. Projecting as far as 2095, the PREDICTS model projects rapid biodiversity losses under a ‘business-as-usual’ land-use scenario, with species richness projected to drop a further 3.5%. These loses are not likely to be uniformly distributed, however, with the largest loses predicted to occur in economically poor but highly biodiverse regions, such as Southeast Asia and Sub-Saharan Africa. Buisness-as-usual results in rapid human population growth and agricultural expansion, and most closely matches recent trends, and yields the most severe losses in biodiversity of any scenario considered by the PREDICTS team. Continuing on as we have been does not bode well for biodiversity or the vital ecosystem services it provides us.
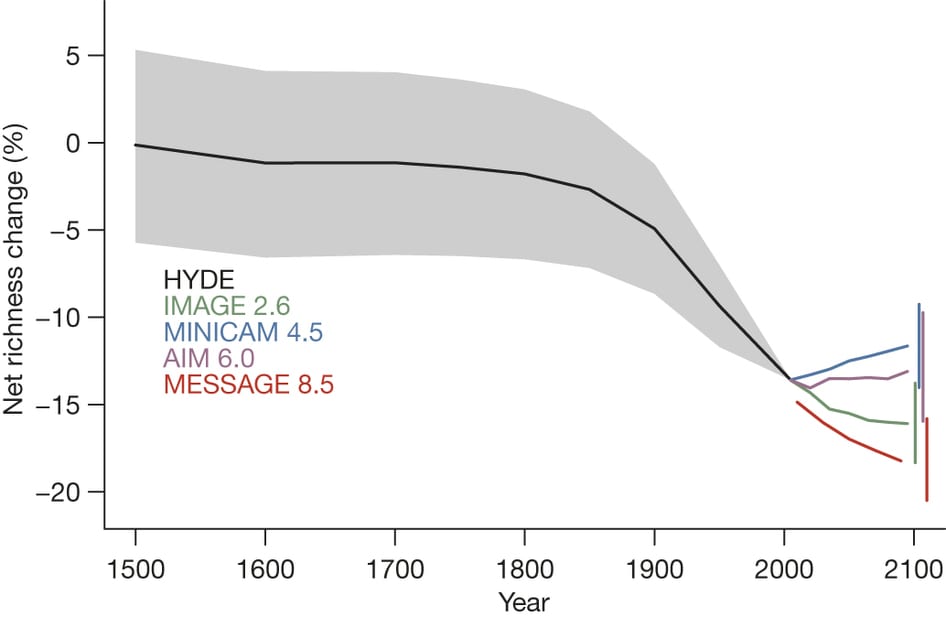
Projected net change in local richness from 1500 to 2095. Source: http://www.nature.com/nature/journal/v520/n7545/abs/nature14324.html.
Perhaps surprisingly, the second-worst scenario for biodiversity is in fact the scenario with the least climate change (IMAGE2.6). This is because this scenario achieved reduced emmisions and climatic change by rapidly converting the world’s forests (primary vegetation) to crops and biofuel. In contrast, the IPCC scenario MiniCAM 4.5, which mitigates climate change through the use of carbon markets, crop improvements and diet shifts, however, is projected to increase average species richness. Not all our possible solutions to curb greenhouse gas emissions and reduce climate change will necessarily spell good news for biodiversity.
It isn’t all bad news, though. The right strategies can promote biodiversity globally, even producing increases in species richness by 2095 of up to 2%, and the PREDICTS team say widespread biodiversity loss is not inevitable. Concerted efforts and the right socioeconomic choices can make long-term global sustainability of biodiversity an achievable goal.
Original Article:
![]()

This research was made possible by funding from the Natural Environment Research Councik (NERC) and the Biotechnology and Biological Sciences Research Council (BBSRC).
 Box 1. This tree represents the relationship between 5 gene sequences. Each node of the tree either represents a speciation (S1 and S2) or duplication event (star). Thus to know the relation between pairs of genes, you just have to trace them back to their shared node (closest common ancestral copy). In this example, the blue genes between dog and human are orthologous to each other (because they trace back to a speciation event). The red dog and red human genes are also orthologous to each other. However, all the blue genes are paralogous to all the red genes because they trace back to a duplication node. All of these red and blue genes are orthologous to the black (frog) gene, an example of a many:1 relationship.
 Natasha Glover received her Bachelor of Science and PhD from the Department of Crop and Soil Environmental Science at Virginia Tech in the U.S. Her PhD was focused on plant genomics and biotechnology. She received a Marie Curie International Incoming Fellowship for her first postdoc and worked in Clermont-Ferrand, France at the Institut Nationale de la Recherche Agronomique for 3 years. There, she concentrated on computational biology, with a focus on synteny and duplication in the wheat genome. Natasha is a currently a postdoc based at Bayer CropScience in Ghent, Belgium as part of the Marie Curie PLANT FELLOWS program. Her co-advisor is Dr. Christophe Dessimoz in the department of Genetics, Evolution, and Environment at UCL.