 Close
Close

Where are economy seven tariffs used in GB?
By ucesres, on 30 January 2015
Economy seven tariffs provide an alternative to electricity consumers in Britain, allowing users to pay less for electricity during the night. The cheaper period last 7 hours but may be discontinuous. Rate savings during this period of up to 50% are possible, but daytime rates may be higher or a charge applied. Very useful if you are at work all day and you can put appliances such as a washing machine or water heaters on a timer.The other technology which can make best use of this tariff is an electric storage heater, which can charge up during the cheaper period and release heat at any time necessary. Electric storage heaters and hence the eco7 tariff are associated with poorer households in Britain. Therefore data on the use of this tariff could be useful for targeting fuel poor households and schemes aiming to save money on energy bills. This is important during periods of economic recession or rising energy bills, something that is likely to be the norm for the near future as we pay the price for lack of investment in energy infrastructure. The eco7 tariff is also interesting as it is likely that tariffs in the future will require consumer interaction as the grid becomes “smarter” and the tariff provides a precedent for successful implementation and use. Generally data on this kind of thing is commercially sensitive and could be used by people for nefarious purposes and is therefore difficult to get hold of. However, DECC do publish data on metered gas and electricity as part of their sub national statistics. As well as providing data on gas and electricity demand, these datasets show how many meters there are by census area. The maps below show a couple of examples of how this data can be visualised to give insights into how and where energy is used in Great Britain.
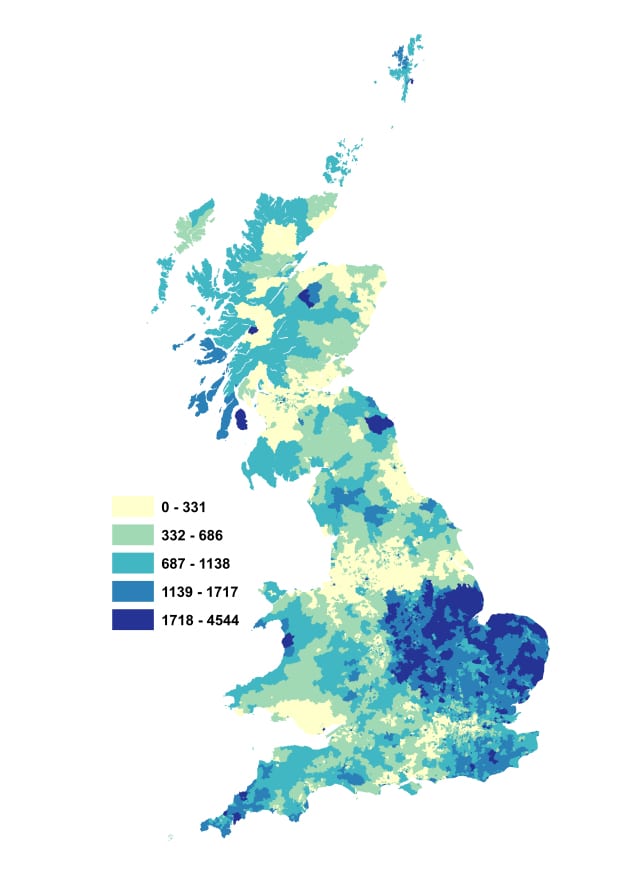
The first map is a simple chloropleth map describing how many eco7 meters there are per Middle Layer Super Output Areas in 2010. For the uninitiated these MSOA’s are areas created as part of the census designed to show zones that are reasonably homogeneous in terms of size and population. There are 5000-15000 people in each one and 2,000 – 6,000 households. The map shows that the tariffs are not popular in urban areas with the major British conurbations comprised of and surrounded by the lowest classification. Elsewhere most of GB shows no trend, other than the band across central and eastern England. This is unusual, as no economic, social or demographic driver springs to mind. One possible explanation is that in these areas the tariff is pushed by the prevalent energy supplier. In GB you are free to choose suppliers irrespective of your location. It may be, however, that companies advertise more heavily in certain areas. The dark band does sit within two distribution zones where a particular company operate the distribution of electricity. The companies may have a larger market share for supply here. Two things make it difficult to find out the drivers. The first is the fact that eco7 is longer available and more recent patterns cannot therefore be derived. The other is finding the correct information on network operators; a Google search brings up 5 conflicting maps.
This data provides an excellent opportunity to look at another method of visualising spatial energy data, the cartogram. One issue with representing the data as above is that analysis assumes that the areas used are the same. Given that the population sizes varies by 150% this can lead to misinterpretation. The cartogram avoids some of this by scaling the area of the polygon by the attribute, in this case the number of eco7 meters. This can lead to a large amount of distortion, but is very effective in many cases in communicating a metric quickly and effectively. The map below shows exactly the same data as a cartogram. This visualisation emphasises the obvious areas described above, expanding the area in central and eastern England and shrinking the urban areas. More interestingly, south eastern England is identified as an area with an increased number of eco7 tariffs and Cornwall maintains it size, suggesting uptake here. Scotland has been shrunk, reflecting the smaller population. Comparing the two maps shows that the second is probably the better at communicating at what the data is showing, with a richer description of the data.

The maps are made using ArcGIS. Colors come from colorbrewer and the cartogram is created using a plugin arc script freely downloadable.
7 Responses to “Where are economy seven tariffs used in GB?”
- 1
-
2
DavidPriceUCL wrote on 30 January 2015:
RT @UCL_Energy: New @UCL_Energy blog: ‘Where are economy seven tariffs used in GB?’ by @steadier_eddy http://t.co/KEzLgqEH7T
-
3
janicemorphet wrote on 30 January 2015:
RT @UCL_Energy: New @UCL_Energy blog: ‘Where are economy seven tariffs used in GB?’ by @steadier_eddy http://t.co/KEzLgqEH7T
-
4
LoLoCDT wrote on 2 February 2015:
RT @UCL_Energy: New @UCL_Energy blog: ‘Where are economy seven tariffs used in GB?’ by @steadier_eddy http://t.co/KEzLgqEH7T
-
5
LoLoCDT wrote on 2 February 2015:
@UCL_Energy blog: ‘Where are economy seven tariffs used in GB?’ by @LoLoCDT @steadier_eddy http://t.co/9Pj8qm8fNV
-
6
SofiePelsmakers wrote on 2 February 2015:
RT @UCL_Energy: New @UCL_Energy blog: ‘Where are economy seven tariffs used in GB?’ by @steadier_eddy http://t.co/KEzLgqEH7T
-
7
AlisonParkerUCL wrote on 2 February 2015:
RT @LoLoCDT: @UCL_Energy blog: ‘Where are economy seven tariffs used in GB?’ by @LoLoCDT @steadier_eddy http://t.co/9Pj8qm8fNV
New @UCL_Energy blog: ‘Where are economy seven tariffs used in GB?’ by @steadier_eddy http://t.co/KEzLgqEH7T