 Close
Close

If you don’t count the people, the people don’t count
By Oliver W Duke-Williams, on 12 September 2013
The most recent census of the UK was taken in 2011. It might also have been the last. The Office for National Statistics will shortly launch a consultation exercise setting out some alternatives to current census practice. Based on what is known so far, there will be two options: an Internet census, and a data set based on administrative data, coupled with a rolling survey. Continuing with the census as it has been done for the last two hundred years is not expected to be offered an option.
My own research interests and grant funding cover various parts of the large collection of census data. I’m a Co-Investigator in Census Support and also in CeLSIUS and the CALLS Hub. I also have a smaller project which is exploring a potential use of the recovered 1961 microdata. Many of the issues that arise in work with the census overlap the research interests of colleagues in the Department of Information Studies – we aim to help people understand and navigate large volumes of data to find what they are looking for, we need to build robust metadata and classification systems that can accommodate changing questionnaire wording over time, we need to build systems that can extract (and possibly pre-process) items from large database holdings in a speedy, efficient manner. There is considerable interest in historic census data within the humanities – as seen, for example in the ReACH project and the Dig Where We Stand project. Extracting digital data from historic records is not necessarily an easy task, as records are handwritten and can be hard to read; this can present problems for transcription efforts, but transcribing hand-written documents is something in which UCLDH has a special interest.
The blog discussess the merits of the options to replace the census, and argues that cancelling the census is short-sighted.

Clay tablet; census list of town
© Trustees of the British Museum
Source: British Museum [AN1060466]
A brief history of censuses
Censuses have been taken every ten years in the UK since 1801, with the exception of 1941. This is not as long as is the case in the United States, which conducted its first census in 1790, but it is still one of the longest running national censuses. Historically, censuses have a much longer pedigree, even if veracity of the most famous of the ancient censuses is disputed by some.
The nature and scope of the UK censuses has changed over time, reflecting political changes in the constitution of the union, and developments in methodology. The earliest censuses (1801-1831) were compilations of aggregate counts, but since 1841 the census has been based on the collection of information on individuals. In recent decades, the ‘UK census’ has actually comprised three separate (but largely harmonised) censuses conducted on the same day in England and Wales, in Scotland, and in Northern Ireland.
The most recent census took place in April 2011, with the results being released in stages since mid 2012. However, this may well be the last census. Debates about the best way to count the population have carried on for some time, but it emerged in 2010 that Francis Maude, the Cabinet Office Minister, believed that the census should not continue in its current form. The headline cost of the census is high: the cost of the 2011 Census was put by ONS at £480 million (although it is unclear whether this answer relates to the cost for the whole UK, or just for England and Wales), although as many commentators have pointed out: when this number is divided by the population, and spread over ten years, it seems somewhat lower. On a purely economic basis, this cost should be balanced against savings that are made through the use of well informed planning. Clearly, this calculation is not necessarily easy to make: we use census data in planning, and don’t know what mistakes might have been made had we not had access to population counts, and how much any such mistakes might have cost to ameliorate.
Availability of data
The censuses have, over time, delivered a wealth of data suitable for research use. The data are available in a number of ways. Modern data (where ‘modern’ broadly means “from 1971 onwards”) are available to academic researchers via Census Support, a service which is part of the UK Data Service. More recent data (from 2001 and 2011) are – or will be, when they are released – also available from the statistical agencies: the Office for National Statistics, the National Records of Scotland, and the Northern Ireland Statistics and Research Agency. There is a discrepancy here – data prior to 2001 are hard to find beyond academia; one of ways in which academics have ‘added value’ to the data are through archiving and maintaining them. Recent license changes should make it easier for access to be opened up to these older data for all users. Other ‘value adding’ exercises have included the construction of flexible interface tools, and metadata databases.
Historic data – from 1801 through to 1931 are available from a variety of sources. These were published at the time as tables of aggregate counts in printed volumes. Histpop provides scanned copies of the reports, whilst A Vision of Britain Through Time also provides machine readable copies of many of the tables included in the reports. Of greater interest to many people are the individual records on which the (1841 and onwards) censuses were based. Genealogists make considerable use of historic census data, along with parish records and other sources, to explore family histories, whilst social historians can use these individual data to learn more about the wider structure of societies over time, as well to study the family life of figures of interest. Demographers can also use individual records to study a large population of individuals, as well as to generate new aggregate statistics, exploring social characteristics that were not considered relevant at the time that the original reports were prepared. (At least, they can do this in theory; in practice most databases of individual records are set up to search for named individuals, rather than for aggregation across many records). There are a number of sources, including commercial operators such as Ancestry.co.uk, but there are also interesting projects that aim to make individual data more openly available: the Freecen project is a crowd sourced transcription project that is building a database of individual records, whilst the Integrated Census Microdata project at the University of Essex is building an anonymised set of records for research use.
The interest in census data by both academic and professional historians, and individuals studying their own family histories, reminds us that today’s administrative data (both census and other sources) are the coalface at which future historians will dig. Given that, it is incumbent on us to try and generate good quality datasets now if we’re going to bequeath them to our descendents.
In the UK, census data are held to be confidential under what is known as ‘the hundred year rule’, and individual records become accessible 100 years after the original census was collected. It is now standard practice for these to be made available in a digital form, in collaboration with commercial data providers. Thus, records from the 1911 Census are now searchable via findmypast.co.uk. A similar arrangement will no doubt be made for the 1921 Census, and with that the sequence of census data for research use will be near to completion. The original records from the 1931 Census were lost in a fire during the Second World War (the fire itself was unrelated to bombing or any other war activity), and no census was conducted in 1941, due to the war. Moving forwards, the 1961 Census was the first in the UK to be digitally processed, and although machine readable datasets were not created at the time, the Enhancing and Enriching Historic Census Microdata project based at Essex is currently in the process of recovering usable microdata from original database records. The project aims to create exciting new datasets including anonymised microdata samples from the 1961 Census and other early digitally processed censuses. This leaves only the 1951 Census, which will not be available for public access until 2051, and was not captured digitally and thus will not give rise to any new aggregate data or microdata samples.
Research using the census data
Within Census Support, my area of specialism is interaction or flow data: these are data about movements of people from one place to another. This includes migration flows within and between areas of the UK (in UK census terms, a migrant is someone who has changed their usual residence in the year prior to the census) and journey to work flows. These are expected to be joined in the outputs from the 2011 Census with data sets based on second residences. The data sets share a common characteristic that they are extremely sparse. The most detailed journey to work data sets from the 2001 Census reported flows between Output Areas (OAs) by method of travel to work, by a number of employment states. OAs are the most detailed reporting geography available: there are over 223,000 of them in the UK. If you were to stitch together a UK-wide version of these journey-to-work data (there are slightly different data sets for Scotland and for the rest of the UK) this would give you a matrix of about 1.8 trillion possible attribute combinations. With a population of around 60 million people, it is clear that such a matrix is going to be astonishingly sparsely filled. This, of course, is one of the challenges that interface software has to overcome: we have to make it easy for researchers to find data that they want in a sparse matrix. Of course, few researchers actually want to use data at such a fine scale – the utility of this very detailed data is that it can be re-aggregated into new geographies, and thus has great flexibility.
CeLSIUS provides support for users of the ONS Longitudinal Study (ONS LS). The ONS LS is one of the most valuable research databases we have in social science in the UK. It is based on a sample (about 1%) of the population of England and Wales, and includes sample members’ census data from the censuses of 1971, 1981, 1991, 2001 and (soon) 2011 (or – as many of those censuses for which the sample member was alive, in England and Wales at the appropriate time, recorded in the census, and traced for linkage in the census database). The data are anonymised, but are so detailed that access to them is closely controlled, and there are also controls on the results that can be published. An important part of the sample confidentiality is that nobody knows whether or not they are a sample member. The sample is based on four birth dates during the year, and those birth dates are only disclosed on a need-to-know basis to a team who do data linkage and tracing. By comparing sample members socio-demographic characteristics at different points over their lives, we can tell much about social mobility and the effect of employment and education on lives. As well as data for sample members, the study also includes records for other persons in the sample members’ households, thus allowing such things as the effect of parental occupations and educational achievements on a person’s later life to be examined. As well as census data, the study also contains linked birth and death records. Death records note both fact of death, but also the cause of death – thus, all of these characteristics (occupation, family status, parents’ occupations, education etc) can be linked to outcomes, allowing (for example) occupation-specific mortality to be explored, taking into account changes in occupation over life. There are similar longitudinal studies in Scotland and in Northern Ireland; the three studies are similar, but vary in aspects such as the sample size, the length of time over which they have been running, and the variety of additional linked data sets. The CALLS Hub is a newly funded group, which is working towards integrating aspects of the three sister longitudinal studies, and making UK-wide research easier.
Flow data and longitudinal data share a common feature that they are strongly dependent on a census taking place. In the case of flow data, this is due to the sparsity of the multi-dimensional data sets that are used to capture and tabulate flow data. The combination of an origin, a destination and only a few personal attributes (age and sex, etc) are often unique when a detailed geography is used, but as noted above, the use of a detailed geography is of great utility, as it allows researchers to re-aggregate the flows into whatever target spatial system they need to use. Further, researchers generally want more than just age and sex as personal attributes – they also want to know about occupation, employment status, health and many other characteristics. Designing a sampling strategy to try and get a representative picture of these data is hard, especially as the flow data are skewed and clustered in different ways to the clustering of the base population.
Longitudinal data are sometime collected from surveys known as panel studies: the same set of respondents are re-visited on more than one occasion and change over time in the resulting data can be explored. However, there are a number of crucial differences between these and the existing census based longitudinal data sets. The census LSes are a sample of a (fairly comprehensive) larger population, whereas people have to agree to take part in panel studies, with biases in participation. A vital aspect of the census LSes – as described above – is that the sample members do not know that they are in the sample. If people did know that they were in the sample, this would mean that the birth dates used to select the sample would be known, and thus the confidentiality of the data would be destroyed. However, the only way that we can randomly draw a longitudinal sample from a set of data is to draw it each time from a complete population. Furthermore, drawing from a complete population allows a much larger sample to be used than would be practical in a targeted survey. The Understanding Society study is a UK longitudinal panel study of households and has a sample of about 40,000 households, or about 0.15% of all households in the UK. By international comparisons, this is a large sample, and the study has permitted a wide range of excellent research. However, the study design of the ONS LS allows a far larger sample to be used: in each census, 1% of individuals are included, together with the census records for the other people in their households. (The calculation is not quite so straightforward: the ONS LS is not exactly a 1% sample of households, as there is a chance that a fellow household member might also be in the main sample, through having one of the LS birthdates. The probability of this occurring is low, but the sample is large enough that you would expect it to happen in a few cases).
The end of the census, and options for alternatives
Recent reports in the media (FT (paywalled), Guardian, BBC) have reported that ONS are planning to consult on options for the future of the census. Carrying on with existing approach is not currently one of the planned options.
Over the past two years, our Beyond 2011 programme has been researching and consulting on a range of alternatives, and we will shortly be launching a consultation discussing two possible options. They are:
- The Online Census Option: An online census to be carried out every 10 years
- The Administrative Data Option: An approach that depends on the re-use of the ‘administrative data’ already held within government – combined with a rolling annual survey.
The consultation will ask users to think about how they use population statistics, and the benefits they bring, so that they can properly consider the advantages and disadvantages of the two options.
It is worth considering both of these options.
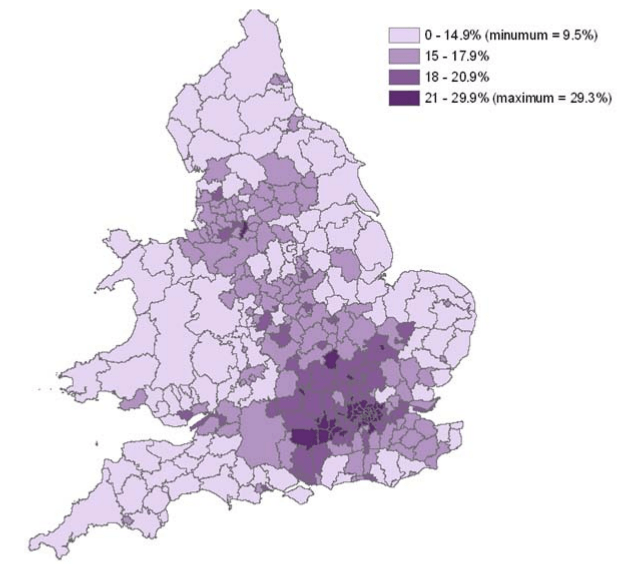
% completion of 2011 Census using online form
Source: ONS: Providing the online census
The 2011 census was the first in the UK to include an option for completion over the Internet, and many people used this method. Internet completion rates varied quite significantly around the country, from 9.5% of households in Blaenau Gwent to 29.3% in Tower Hamlets (data for England and Wales; the national online completion rate for Scotland was ‘around 20%’, and for Northern Ireland was 15%). The ONS report ’Providing the online census’ gave extensive detail about the time of day and day of the week of form completion in England and Wales, along with other statistics, and a map of completion rates.
An online census has quite a lot going for it: it can be easier to create accessible forms and more efficient for providing a range of forms translated into community languages – without having to make a pre-census guess about what community languages will be required in each area. A web-based form can also provide some built-in error checking, and prompting to make some questions easier (for example, instead of saying, as on the paper form, ‘How is person 4 related to person 2?’, an online form can insert the names that have already been provided, and say ‘How is Alice related to Bob?’). Online forms can also remove some of the problems that enumerators face in gaining entry to buildings with doorphone entry systems etc. Given that the data are ‘born digital’, web gathered census data can in theory be captured much more quickly. Human processing is still required, to evaluate text entries that have been typed into boxes, but an intermediate stage of having to process a form with optical character recognition, or to read handwriting, is side-stepped. Clearly, if physical census forms do not have to be printed and distributed, and do not have to be posted back, physically handled, scanned, OCRed and so on, there is considerable scope for cost savings to be made.
Not all, however, is rosy in the online garden.
A major problem with the general idea of an ‘Internet census’ – assuming that that means an ‘internet only’ one – is that not all people use the Internet. In any census, it is known that some people will be missed: in some cases through deliberate avoidance, but in others through a variety of ‘hard-to-capture’ populations. However, they are missed during an attempt at full data capture. With an internet census, we’d start out knowing that a proportion of people would be missed as a feature of the design. The graph below shows the proportion of people surveyed who have never used the Internet in Great Britain (ONS formally cover England and Wales, but also produce some statistics for Britain, and some for the UK).
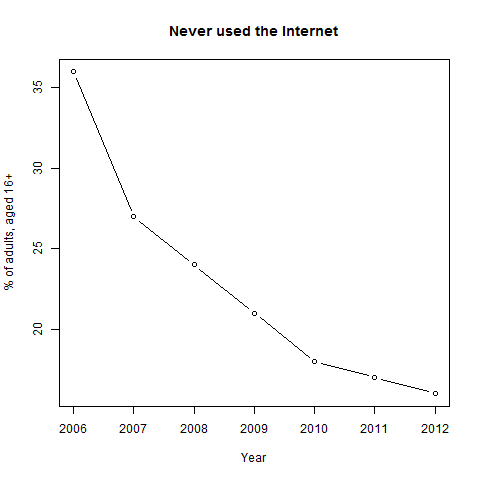
Adults who have never used the Internet
UK, 2006-12
Source: ONS
The proportion of adults who have never used the Internet has dropped significantly in recent years, but the rate of change has slowed quite considerably, and the graph looks like it could be asymptotic: that there will always by a significant proportion of people who have never used the Internet (this is not the same as ‘do not regularly use the Internet’, but is a useful baseline). These people are thus very likely to be missed in an Internet census. Statistical agencies are used to imputing missing data values – it is a standard practice, and methodology is well developed: follow up surveys generally show that imputation is done well. However, the missing fraction above is much larger than the normal proportion of missing records. This is itself a worry in an instrument that is supposed to collect data on all people, but more worrying is the fact that ONS’ regular statistics on Internet usage show that this group of people are not evenly distributed. Older people are less likely to use the Internet than others, and within that group, older women are even less likely to be Internet users than older men. The poorest in society are less likely to be Internet users. Separated and divorced spouses / civil partners are less likely to be Internet users; the widowed are much less likely to be Internet users. The disabled are less likely to be Internet users. There are overlaps between many of these groups, but we don’t understand a great deal about how they interact. Internet non-use also has strong spatial variation, and the quarterly reports from ONS given a relatively detailed breakdown by area.
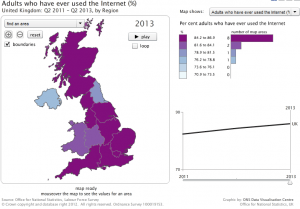
Interactive map of internet usage 2013
Source: ONS
An ‘Internet census’ that is backed up with a traditional paper form for those without Internet access might therefore seem like a good idea, but of course there are obvious flaws with this plan: a) it requires setting up a complete workflow path for printing, distributing, publicising, retrieving and processing the paper forms which is nearly as expensive for a sizeable fraction of the population as it is for the whole population, and b) you don’t know who those people are. You might also take into account the people who could complete an online form, but don’t want to, but at that point you’ve pretty much re-invented past procedure.
The second option suggested is to exploit existing administrative data. Administrative data include resources such as NHS and DWP data, as well as all sorts of other national and local government data. These are already collected for some primary purpose (managing patient records, making benefit payments, collecting taxes, and so on) and thus are already paid for in some senses (although of course, large scale systematic re-use of data isn’t something that can be done for free). A key strength of these data is that they are collected on a frequent or continual basis, as opposed to census data, which are only collected every ten years; they are thus far more timely. Much use is already made of administrative data, in areas such as population projections and estimates of internal migration, and funding agencies such as ESRC are investing heavily in facilities to make more use of administrative data.
The big gains from administrative data lie in the potential for them to be linked together, although this is not easy or cheap, either from a data processing perspective, or from the wider considerations of (necessary) data security environments that must be used. The stumbling block in data linkage is that in the UK we do not have a universal personal identifier, and attempts to introduce one have long been politically difficult. Proponents of ID systems have tended to focus on the more headline grabbing aspects of fighting terrorism or countering identity theft; regardless of the merits of any such claims, the argument that ID systems would make public administration a bit easier are always going to seem a bit dull in comparison. Separately, administrative data sets have their own identifiers – NHS numbers, National Insurance numbers, driving license numbers and myriad others that generally work for their own purposes, but provide no cross-linking capability. Linking often has to be done on a combination of dates of birth, names and addresses, which might in good data be almost unique, but the data tends to be messy: names vary, addresses aren’t standardised and people have more than one address and have a tendency to move. Even birth dates can be unreliable.
The difficulties in linking administrative data are not the only concern with respect to replacing the census, however. There are a number of issues that are problematic.
1: Not all census questions have obvious administrative problems
Many census questions have obvious counterparts in administrative data. Most administrative data hold details of a person’s age and sex, for example. This is not the case for all questions. My interests are in migration and commuting data. In the first case, we have a reasonably good alternative: patient registration data from the NHS allow changes in usual address to be identified. The NHS data are fairly comprehensive in their coverage of the population. There are biases, but these are fairly well identified: the most significant bias is that young adult males often do not register with a new GP after changing address unless and until they become ill. Biases that are known can be accommodated for in data models, although it is unfortunate (from the point of view of estimating migration) that this under-represented group also happen to be a very mobile group. Commuting data are more problematic. There are regular surveys done on journeys to work (which can go into much greater depth than the census) but these are small scale, and as noted above, the sparsity of flow data mean that collection via a full census is much preferable to collection via a sample survey. In principle, income tax data might be able to furnish some data about journeys to work, where the tax authorities know both individuals’ addresses, and details of their employer. The data might not be very clean and coverage would not be comprehensive, but a more significant issue is that tax based data would not include any information about the mode of transport used to get to work, which is the most commonly used part of the journey to work data. A separate potential source of data might be from a combination of driver and vehicle licensing records, and widely installed Automatic Number Plate Recognition (ANPR) devices. This is a politically contested area, and approaches to anonymisation would be important. However, even if the significant political issues could be addressed, the data would still provide problems: they would be about car journeys and not about journeys to work per se (you’d have to model the latter from the former, which sounds messy to me), and you wouldn’t know who was driving a given vehicle. In some parts of the country this could be supplemented by public transport usage data (from Oyster cards, for example) but this would also generate many problems, and overall, data across the UK would be highly variable, both in coverage and in quality; and you still wouldn’t have information about people who walked or cycled to work.
2: Linkage introduces new ambiguities
As described above, some data items are present in almost all administrative sources; others are more limited. We could try to build a census-like profile of an individual by linking multiple sources: age and sex from here, employment details from there, ethnic group from somewhere else, and – as argued above – journey to work from nowhere. But wait, there is trouble ahead: we don’t actually get ‘age and sex from here’ – we get them from lots of sources. And lo! – not all of those sources will agree, even on something like age and sex which sound like they should be objective and easy. It gets worse with other data. How do you decide which record is correct? That’s hard, and it means that your resulting data has a lot of ambiguity. Remember also: linkage isn’t easy, because you rarely have common identifiers.
3: Household level data will be very limited
So – we have some census-like data, stitched together from inconsistent sources, and missing some hard-to-capture items. Let’s do some household level analysis. Ah! Here’s another problem. Very few administrative sources contain much detail on household composition. Most administrative data is held on individuals, as the primary use of the data is concerned with the individual. Some sources might ask you about other people in your household – for example, electoral rolls and tax or benefits that might vary depending on household size, but few if any collect comprehensive data on those household members, or record the relationships between household members.
4: We won’t know whether survey data are representative
A potential solution to the gaps in data, and the absence of data at the household level, is to try and model the data to fill in those gaps using results from surveys. There is a non-trivial catch with this approach. Surveys generally use detailed census data in order to compare the set of people who take part in the survey with the wider population, in order to determine whether the survey is representative. Comparison with census data allows weighting factors to be produced: if you know that a survey has under-represented a certain group of people, you can use a weight in analysis to boost the contribution to the results of that under-represented group. If we have no census data however, we won’t know whether or not our sample is representative, and how it should be re-weighted. The alternatives will to be used the last available census data, and project forwards, or to use the collective administrative sources as a population source. The former approach will suffer from becoming increasingly inaccurate over time, and the latter approach will suffer from the problems described above: we’ll be using a data set of unknown quality to gauge the representativeness of survey data.
The options described above refer to the use of administrative sources coupled with an annual survey. Much hinges on the nature of this survey. Would it be a new survey? An existing one, such as Understanding Society? An enhanced version of an existing survey? For sparse data such as migration and commuting, the difficulties of using survey data will remain; as we’ve seen even a ‘large’ survey like Understanding Society is a tiny sample of the overall population. For census longitudinal studies, an annual survey would not help, as it could not guarantee that the LS birth dates were effectively sampled.
Much is in flux in global census practice. Since 2004, France has adopted a rolling census design, which operates on a five year cycle. The design is unique, and as such highly interesting from an academic perspective. Even assuming good quality data capture, the design poses many challenges to analysts (not least because different sampling strategies are used for large and small communes), who have to work out how the design might affect their statistical methodology. How is it affected by migration? How does it accommodate changing definitions over time? How consistent are small area populations gathered over a long period of time? From a procedural point of view, how does the cost of this strategy compare with traditional methods? In the US, the 2010 Census introduced a new design that bears some similarity to the French approach: all households received a short census questionnaire that collected basic information (in contrast with previous rounds, in which some households received a ‘short form’ and about a sixth received a more detailed ‘long form’), and a new survey (the American Community Survey) was initiated to fill in the more detailed information, with a design such that over a ten year cycle, the ACS should cover the same proportion of households that were previously covered by the ‘long form’ census. This sort of approach might be what ONS have in mind when they refer to an ‘annual rolling survey’ – but a crucial difference would be that our basic ‘core’ would be provided not by a census, but by the combination of administrative data sources.
Why it is wrong to end the census
The discussion above has considered the advantages and disadvantages of two possible alternatives to the traditional model of census taking. But we would be wrong to take the cancellation of the census as a fait accompli. It is not too late: in order to carry out a census in 2021, the necessary legal and planning operations have to start quite soon. An incoming government in 2015 could make a rapid decision to reinstate a census, although even by then it might have to defer the census by a year or so.
The discussion has also glossed over the political considerations of cancellation, and the messages that it might send to other countries, and to UK citizens. Again, these should not be ignored. They have been discussed in some detail by Danny Dorling and others. The publicity strapline for the 2001 Census was “count me in”, and publicity for the 2011 Census featured the phrase “Help tomorrow take shape”, both suggesting that it is opportunity for citizens to make an active effort to signal their inclusion in society. A high profile act of cancellation suggests that this is no longer welcome. That the people don’t count. Internationally, it would look like the UK is not interested in its own population. Most countries hold censuses and those that don’t generally have mandated population registers. The UK has no current plans to assemble a population register, and thus if the census was cancelled we would be the outlier that has neither a register nor a census.
Finally, we should not forget our gift of data to the future. We collect enormous amounts of administrative data, but little or no attempt is made to archive this in a sensible manner that will allow it to be exploited and understood in the 22nd century. The census by contrast, is clearly documented, and ready to use. For politicians with eyes on short term considerations and the next election, the argument that something will be useful in 100 years’ time is not a very strong one, but for citizens, we should cherish it.