X Close

UCL CHIME

Home

UCL MEDICAL SCHOOL

Menu

Archive for the 'Informatics' Category

What’s the evidence?

By rmhipmt, on 25 June 2010

Two things happened yesterday that made me think about how we assess the evidence for and against a hypothesis. The first was a radio debate in which a politician – known to his detractors as the Right Hon. member for Holland & Barrett – was arguing with a scientist about what we could infer from three selected studies of homeopathy. The second was a session with MSc students talking about how to evaluate and present the conclusions in their dissertations. The specific difficulty we were considering was how to be honest in presenting the limitations of one’s work without undermining it.

One way to look at the published literature relating to a particular question is funnel plot. You identify all the known studies addressing the question and then create a scatter plot with a measure of study quality (e.g. sample size) on the y axis and a measure of the effect (e.g. patients improved) on the x axis. In an ideal world the identified studies would be scattered around the the true effect, with the better studies being more tightly clustered and the less accurate ones being more widely spread. The shape should resemble an upside-down funnel that straddles a line marking the true effect. What you actually see is generally more like this:

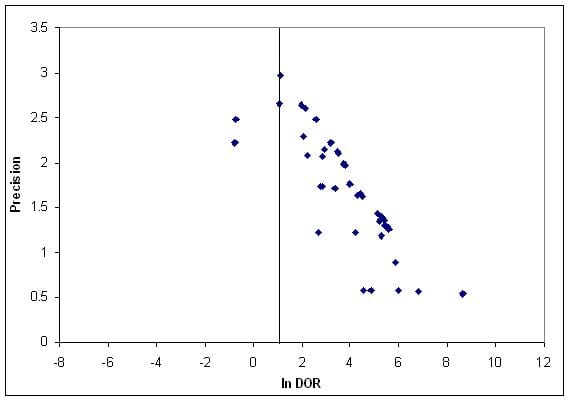
Funnel plot of studies of computer aided detection in mammography, thanks to Leila Eadie

There is an obvious asymmetry and it’s easy to explain. The bottom left corner is missing: small studies that show little or no effect aren’t there. Either researchers don’t bother to write them up, peer reviewers reject them or editors spike them. And you can see why: it’s a small study, and nothing happened.

But there’s a problem. The big studies, the ones that command attention even when the results are disappointing, are hard to fund and hard to complete. The result is that for some hypotheses (say getting children to wave their legs in the air before class makes them clever) we probably only ever see the studies that would be at the bottom right of the ideal plot. How can we judge the true effect?

My conclusion is that there is strong responsibility on those of us who work in fields where there are relatively few large, well-resourced robust studies to be self-critical and to look at how we examine and use evidence to support the claims we make.

Data-mining: it’s all about the data

By rmhipmt, on 4 May 2010

Marooned in NY last week, I made the trek uptown for a meeting at Columbia. It was about data-mining which isn’t really my field, and I might not have gone if the circumstances had been different. It was interesting though, because I think of data-mining as being an applied field of statistics, so assume that the questions are primarily about approaches and involve complex mathematical arguments about the applicability or power of different algorithms or techniques. In this meeting, however, the conversation never got to a mathematical concept more complex than a percentage or a standard test of significance. Instead the discussion was all about the data. What does it mean? How was it gathered? Does it really mean what we think it means?

The project was looking at data about patients who had had an heart attack in hospital. Specifically they were looking at the observations and comments made in the two days before the event to see if there was some signature or pattern that could be used as a warning of the event.

Three interesting observations:

(1) One idea is to look not at the content of observations but at their timing and frequency. In an earlier project the group had assessed the number of comments or observations about a patient. The first pass at that analysis revealed something seemingly odd: a number of patients died without there being anything in the notes to suggest that the patient was ill at all, never mind critically ill. No signs, no symptoms, no tests, nothing. A quick review of the notes for these patient revealed that these were patients who – if not actually dead on arrival – died within minutes. So the absence of information was not a sign of an absence of concern, but that the speed of the crisis altered the requirement for documenting the case.
(2) A previous attempt to identify a predictive signature from the record found that information that was predictive of the outcome wasn’t useful, because it didn’t tell you something you didn’t already know. So, if a doctor orders a test for TB, and this is – to an extent – predictive of TB, well no surprise. The things that were useful – that had been somehow hidden in the data – were only weakly predictive. And how do you use that information clinically? If the test has an AUC that is significantly greater than 0.5 but is only 0.6?
(3) One analysis had involved looking at the comments associated with observations. Unsurprisingly most comments were made about observations that were outside the normal range. Except for oxygen. Most comments about oxygen were made about patients who were in the normal range! So what does that tell us? Well one thing might be that ‘normal’ is a context-dependent term, so that for these patients to be in that range was not normal, or at least was an event that required some documentation.

All in all, it reinforced the impression that health informatics is all about the data. And it doesn’t always mean what it might be thought to mean.

Who decides what we can afford in healthcare technology?

By rmhipmt, on 26 March 2010

Both the major parties acknowledge the need to cut public spending after the election. Neither talks as if cuts are planned to NHS budgets. However, the NHS has always, in its 60 year history, enjoyed real-term increases in spending. A politician promising to protect NHS spending, is rather like someone promising not to halt a rising tide. If the next Chancellor manages to keep the NHS to zero growth, that will seem a huge success. Richard Smith, writing for the BMJ notes that NHS spending has tripled since 1979 and wonders what we have bought for the money: “In 1979 there were about 40 000 doctors and dentists in the whole NHS (it was one NHS in those days) but now there are 122 000 doctors (not dentists) in the English NHS alone. Nurses have increased less dramatically—from 300 000 in the whole NHS in 1979 to 400 000 in the English NHS now. In particular we have many more specialists. Cardiologists were exotic creatures when I was a junior doctor; now they’re a dime a dozen, all busy putting catheters in all day long.”
How did we decide that this level of spending is necessary? It can’t be that we “need” three to five times as many doctors as we did 40 years ago. The answer is that we don’t exactly “decide”. Tony Blair made a conscious decision to increase spending on the NHS, but he was probably responding to public perception of the quality of healthcare here compared to other wealthy European countries, following rather than shaping a public mood. Yet clearly the spending is driven by something, it is a function, somehow, of decisions that are taken by individuals responding to information picked up from contacts and colleagues.
I’ve been talking this week about the move from analogue to digital in breast cancer screening. This hasn’t happened in response to clinical need. Sure, the new machines have advantages over the old, but they don’t offer a step-change in performance. It seems rather that doctors are deciding to buy digital because they are conscious that manufacturers have stopped developing analogue. It doesn’t follow, though, that the process is straightforwardly determined by the manufacturers. The decision to switch to digital can’t have been an easy one for companies with a strong track record in analogue. My guess is that they were trying to provide what they expected customers to want and probably felt that the market was driving the shift. But the astonishing thing is that this cycle – customers making decisions based on what the market offers and the market offering what customers are expected to want – is taking place in a spiral of rapidly increasing costs. Digital mammography is roughly twice as expensive as analogue. Is someone somewhere making the judgement that that’s simply OK? Or maybe lots of people in different places are acting as though that is OK, because it’s hard to see how to act otherwise.

CHIME in UCL Eprints chart (December 2009)

By Henry W W Potts, on 15 January 2010

The December 2009 top downloads from UCL Eprints is now available: the review on electronic patient records co-written by Henry Potts and Pippa Bark with Trish Greenhalgh et al. in Milbank Quarterly is at #13 with 108 downloads, while Bate & Robert (2002, in Public Administration) is at #19 with 76.

For the fourth quarter of 2009, Bate & Robert (2002) is at #14, while Kalra (2006, in IMIA Yearbook of Medical Informatics) is at #26. And for the year 2009 in total, it’s Kalra (2006) at #16, Bate & Robert (2002) at #18 and Potts (2005) at #31.

Electronic patient records are not a panacea

By Henry W W Potts, on 22 December 2009

Large-scale electronic patient record (EPR) programmes promise much but sometimes deliver little, according to a new study by UCL researchers including CHIME’s Dr Henry Potts and Pippa Bark. The study reviewed findings from hundreds of previous studies from all over the world.

The major literature review, published in the US journal Milbank Quarterly, identifies fundamental and often overlooked tensions in the design and implementation of EPR programmes. The findings have implications for President Obama’s election promise of “a computerized medical record for every American within five years”, and for other large-scale EPR programmes around the world.

First author Professor Trish Greenhalgh of UCL’s Department of Open Learning said: “EPRs are often depicted as the cornerstone of a modern health service. According to many policy documents and political speeches, they will make healthcare better, safer, cheaper and more integrated. Implementing them will make lost records, duplication of effort, mistaken identity and drug administration errors a thing of the past.

“Yet clinicians and managers the world over struggle to implement EPR systems. Depressingly, outside the world of the carefully-controlled trial, between 50 and 80 per cent of EPR projects fail – and the larger the project, the more likely it is to fail. This comprehensive review suggests that the EPR is a complex technology introduced into a complex system – and that only a small proportion of the research to date has been capable of addressing these complexities.

“Our results provide no simple solutions to the problem of failed EPR projects, nor do they support an anti-technology policy of returning to paper. Rather, they suggest it is time for researchers and policymakers to move beyond simplistic, technology-push models and consider how to capture the messiness and unpredictability of the real world.”

Key findings of the new review include:

  • While secondary work like audit and billing may be made more efficient by EPRs, primary clinical work can be made less efficient;
  • Paper, far from being technologically obsolete, can offer greater flexibility for many aspects of clinical work than the types of electronic record currently available;
  • Smaller, more local EPR systems appear to be more efficient and effective than larger ones in many situations and settings;
  • Seamless integration between different EPR systems is unlikely ever to happen, as human input will probably always be required to re-contextualise information for different uses.

Co-author Henry Potts added: “There has been considerable prior debate in the media and among academics about the benefits and hazards of EPR systems. We believe the next generation of research should focus on how human imagination, flexibility and collaboration can work with electronic systems and help overcome their inherent limitations, thereby allowing us to realise the full potential of EPR systems.

“In the US, the debate over these issues is just beginning and it’s important that policymakers worldwide pay attention to the problems and issues we raise in order to avoid costly mistakes.”

The research was sponsored by the Medical Research Council, the UK Department of Health and the UK NIHR Service Delivery and Organisation programme. The full text of the paper is freely available at Milbank.org or through UCL Eprints.

The paper was the basis for an interview with Henry Potts by UCL News, and has also been covered by Pulse, Computer Weekly, eHealthInsider and others. This Health Care Renewal blog entry is particularly interesting.