X Close

BRITS cell therapy project planning and valuation tool

Home

Menu

Archive for the 'Global Cell Therapy Industry' Category

The Global Cell Therapy Industry

By zceie01, on 1 June 2014

Background

The BRITS tool incorporates data the BRITS team collected on cell therapy firms and R&D projects from a range of data sources that include the Citeline Pharmaprojects database, Recombinant Capital, LexisNexis, and Bloomberg. These data were used as input for the tool’s estimates of project risks and development times based on information provided by users about individual projects. The data, the BRITS team collected provides useful input across the following areas:


Cell therapy companies

By zceie01, on 1 June 2014

The BRITS team collected data on a total of 592 commercial cell therapy projects from Citeline’s Pharmaprojects database and linked these projects to a total of 235 companies, distributed across 22 countries. Figure 1 highlights the locations of cell therapy companies across the globe.

Figure 1: Geographical locations of cell therapy companies

cell companies


The geographical distribution of cell therapy companies the BRITS team collected data on is not an even distribution, and the overwhelming number of companies that commercialise cell therapies is located in North America (see figure 2).

 Figure 2: The geographical distribution of cell therapy companies

geographic distribution

The BRITS team’s analysis of the sizes of cell therapy companies highlights that, reflecting the industry’s early stage of development, the number of larger companies in the cell therapy R&D space is relatively small. Figure 3 provides an overview of the distribution of cell therapy companies by size.

Figure 3: Cell therapy companies by size

companies_by_size


Cell therapy projects

By zceie01, on 1 June 2014

The BRITS team’s analysis of the 592 commercial cell therapy projects that were identified highlights that the cell therapy sector is a sector that spans all key therapeutic application areas. A breakdown in figure 4 of the therapeutic focus of cell therapy projects highlights that oncology constitutes the largest area in which new cell therapies are being developed as 26.2% of cell therapy projects are in the oncology space. Oncology is followed by neurology (15.4%), alimentary/metabolic (13.4%), cardiovascular (11.3%), and musculoskeletal as the largest therapeutic markets cell therapy projects are directed at.

Figure 4: Cell therapy projects by therapeutic focus

therapy_projects

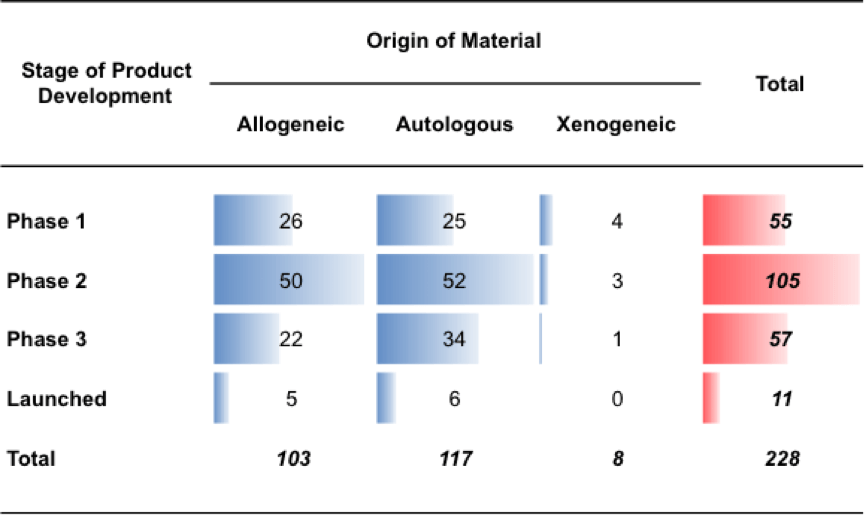
Figure 5 breaks down the 593 commercial cell therapy projects the BRITS team collected data on, by the stage of development. Figure 5 highlights that most (364) cell therapy projects did not progress beyond pre-clinical trials. 55 reached stage 1 clinical trials, 105 reached stage 2 clinical trials, and 57 reached stage 3 clinical trials. Finally, the BRITS team identified 11 cell therapy projects that reached the market.

Figure 5: Cell therapy companies, projects by stage of development

cell therapy companies

A unique aspect of the dataset of cell therapy projects the BRITS team created is that it contains information on both discontinued and on-going cell therapy projects. This has allowed the BRITS team for example to provide assessments of the likelihood of failure for specific types of cell projects. Figure 6 breaks down the number of discontinued and on-going projects that data were collected on.

Figure 6: On-going/discontinued cell therapy projects by therapeutic focus

fig 6


Development times

By zceie01, on 1 June 2014

Based on information users provide on the type of projects they are working on (i.e. type of source material, therapeutic focus), the BRITS tool provides average development times for comparable projects. The BRITS team formulated estimates of development times for different types of cell therapy projects by matching data on cell therapy projects from Citeline Pharmaprojects with data on clinical trials associated with these projects that were downloaded from www.clinicaltrials.gov. For the 305 clinical trials on which the BRITS team was able to identify a start and end date of the trials the total duration of trials was calculated. Figure 7 highlights the average development times at different stages for allogeneic and autologous cell therapies.


Figure 7: Development times for cell therapy projects

Screen Shot 2014-06-27 at 17.06.49


Success rates

By zceie01, on 1 June 2014

Based on information users provide on the type of projects they are working on (i.e. type of source material, therapeutic focus), the BRITS tool provides estimates of these projects’ likelihood of failure based on failure rates of comparable projects. The BRITS team collected data on these failure rates by examining how many of the projects in the dataset that progressed to a specific development stage (i.e. phase 1,2,3, launch), also progressed to the subsequent development stage, and which projects did not progress. Figure 8 provides a breakdown of the most advanced stages of development different types of cell therapy projects reached.


Figure 8: The most advanced development stage reached by cell therapy projects

fig 8

Figure 9 provides a breakdown of the success rates of cell therapy projects across various stages of the development process. The BRITS team calculated two different success rates for cell therapy projects across the stages of the product development pathway. First, the BRITS team calculated the success rate as a percentage of projects that started, and did not fail during clinical testing at a specific stage. Second, we calculated the success rate as a percentage of projects that were successful at a specific stage and progressed to the next stage. BRITS data highlight that cell therapy projects tend to have higher success rates than generic therapeutic product development projects, for which success rates are provided in the right-hand column of figure 9.


Figure 9: Success rates of cell therapy projects

 fig 9


Sales growth curves

By zceie01, on 1 June 2014

To help stakeholders in the cell therapy sector develop a better appreciation of the uptake of cell therapy products in the marketplace, the BRITS team collected data from a range of sources such as IMS Health, news reports and company websites, to map sales growth for cell therapy products that have reached the market. Figure 10 maps data we collected on the quarterly sales for 6 cell therapy products.

 Figure 10: Sales data for launched cell therapy products

fig10

Source: IMS Health, Google Searches on company, news website


To allow users to compare post-launch adoption curves, the BRITS team also mapped in Figure 11, sales for different cell therapy products using the launch date for different products as t=0.


Figure 11: Quarterly sales data since product launch

fig 11

Source: IMS Health, Google Searches on company, news websites.